FIN600/ FINA6017 Financial Management Assignment Sample
Question
Instructions
The basic requirement is to undertake a general financial analysis, comparing financial position and performance over the two most recent financial years, of an ASX listed company. Your Learning Facilitator will provide the details of the ASX listed company. The annual report for the chosen company should be available on the company website and/or will be provided by your Learning Facilitator. The analysis should consider each of the following financial ratios: - profitability and market performance
- Efficiency,
- Liquidity,
- Capital structure
Note: You are to use the ‘consolidated’ data in conducting your analysis. You are only required to look at the most recent financial report. For those ratios which involve averages, you will calculate an average for the most recent year only, the prior year ratio calculation will NOT consider average calculations.
This assignment will contain two elements: 1. Schedule(s) of relevant ratios and other useful calculations
- The detailed calculation of relevant ratios and other useful calculations should be included, as one appendix, prepared using Excel. An example template is provided under the assessment 2 information, Assessment 2 Appendix template.xls.
- You will be advised by your facilitator as to which ratios to calculate.
- You are advised to show the formulae used in determining particular ratios and other figures.
2. A written report The written report is the main element of this assessment. A sample template is provided under the assessment 2 information, Assessment 2 report template.doc. The written report should:
- Explain what is revealed by the ratios and other calculations, in the context of the company’s profitability, asset efficiency, liquidity, capital structure, and market performance.
- In particular, any important changes over the two financial years should be identified, discussed and, where possible, explained.
- Provide an overall assessment of whether the company, over the recent financial year, has been better than the previous financial year, in the perspective of existing equity investors (shareholders).
In preparing this report, you should:
- analyse the financial statements of the business;
- identify key ratios and apply ratio analysis; - argue the case of why the organisation may or may not succeed in the future and what the business should be doing to help it succeed;
- consider the impact of the political and competitive environment on the business;
- include external factors that need to be taken into consideration and the likelihood of a merger or acquisition;
- provide a recommendation, that is, would you invest in this company after your own analysis or under what circumstances would you buy/save the business?
SOLUTION
• Introduction
• Background and Business
Bega Cheese is an Australian Diversified food company with its manufacturing site and headquarters located in New South wales, Victoria and Queens. It was established as an agricultural business in the town of Bega located in New South Wales by suppliers of dairy in Australia. The company subsequently got public in 2011 and got listed in Australian stock exchange. More than half the shares that are currently outstanding in the market, is owns by the farmers of Bega Suppliers. Currently, it is one of the largest companies in the dairy industry of Australia and was responsible for supplying more than 750 million liters of milk for the year ending 2018 (begacheese.com.au 2021).
The primary source of income for Bega is its spread product like along with packaged dairy products and other grocery products with their flagship “Bega” brand owning 15.7% of the Australian cheese retail market. The other major food brands operating under the brand name Bega include Farmers Table, “Picky Picky” and Zoosh. Fronterra is a major distributor of all Bega dairy products under long term agreement. The 1/3 of Bega’s revenue results from export activities of the nation. The Cheese products of the brand are exported to over 40 countries around the world and distributed across Australia where they are easily available in all general stores and supermarkets (begacheese.com.au 2021).
Other business segment of the company comprises of core dairy ingredients such as cream cheese, cheese and powered milk and nutritional products produced under the Bega Bio nutrients brand which contributes to 9% of the total revenue of business. In the year 2017, Bega announced its sponsorship to mumbulla foundation 2017 gala dinner. In 2019, it won a legal dispute against Kraft Heinz over their peanut butter packaging. In 2020, they raised considerable amount of fund to purchase Kirin’s suite of dairy products (begacheese.com.au 2021).
• Company Analysis
• Current Financial performance, Key financial highlights, Economic outlook
For the year ending 2020, the Bega Cheese has performed in a sound and stable way which is why it is critical to assess the financial statement of the company. Against the backdrop of increased uncertainty imposed by covid 19, Bega successfully overcame all odds and strengthen its cash reserves while extending their helping hand in unprecedented times. The challenging year even though have left every industry shook and broke, Bega managed to survive and build resilience through is effective planning and strategy execution. The culture and experience of the business has once again reflected on the firm’s strong financial outlook and financial efficacy over the years (begacheese.com.au 2021).
Financial highlights/events of 2020
• For the year ending 2020, the company successfully increased its revenue by 5% to $1.49 Billion compared to the performance of 2019.
• While the revenue has been steadily increasing, the increasing competitive environment of milk and dairy supply chain has normalized PAT and EBITDA that amounted to $236.4 Million, a reduction of 18% (Kourtis, Kourtis & Curtis, 2019).
• The overall production of the business was drastically impacted by prolonged drought and competition in supply chain which reduced productivity by 2% to 298 thousand tonnes. Bega cheese is persistent in reviewing its infrastructure and integrating it with supply profile and the market.
• Year 2020 was the year of focusing on strengthening the balance sheet of the business and improve cash management which helped the company in reducing its net debt to $236.4 Million as at 30th June.
• The EBITDA of business amounted to $103 Million which is towards the upper end of guidance (Setiawan & Amboningtyas, 2018).
Economic Outlook
• The group is well positioned as it enters the financial year 2021 with improved profit contributions from the recently commissioned lactoferrin facility at Koroit.
• Further, the company is expecting to benefit from reduced debt and working capital which would further strengthen its potential acquisition ability.
• Innovation in the product category would depend on the performance of existing products including Simply Nuts and Vegemite (AREAS, 2018).
• The dairy category of the business would continue to strengthen the company’s performance even further and would enable it to reach new highlights of success while driving more revenue in the long run.
• In the opening quarter of 2021, the prices of milk were lower than 2020, majorly onset by the Covid 19 pandemic which reduced the demand of dairy products (Mitrovi, Kneževi? & Veli?kovi?, 2015).
• Ratio Analysis
• Profitability and Market ratios
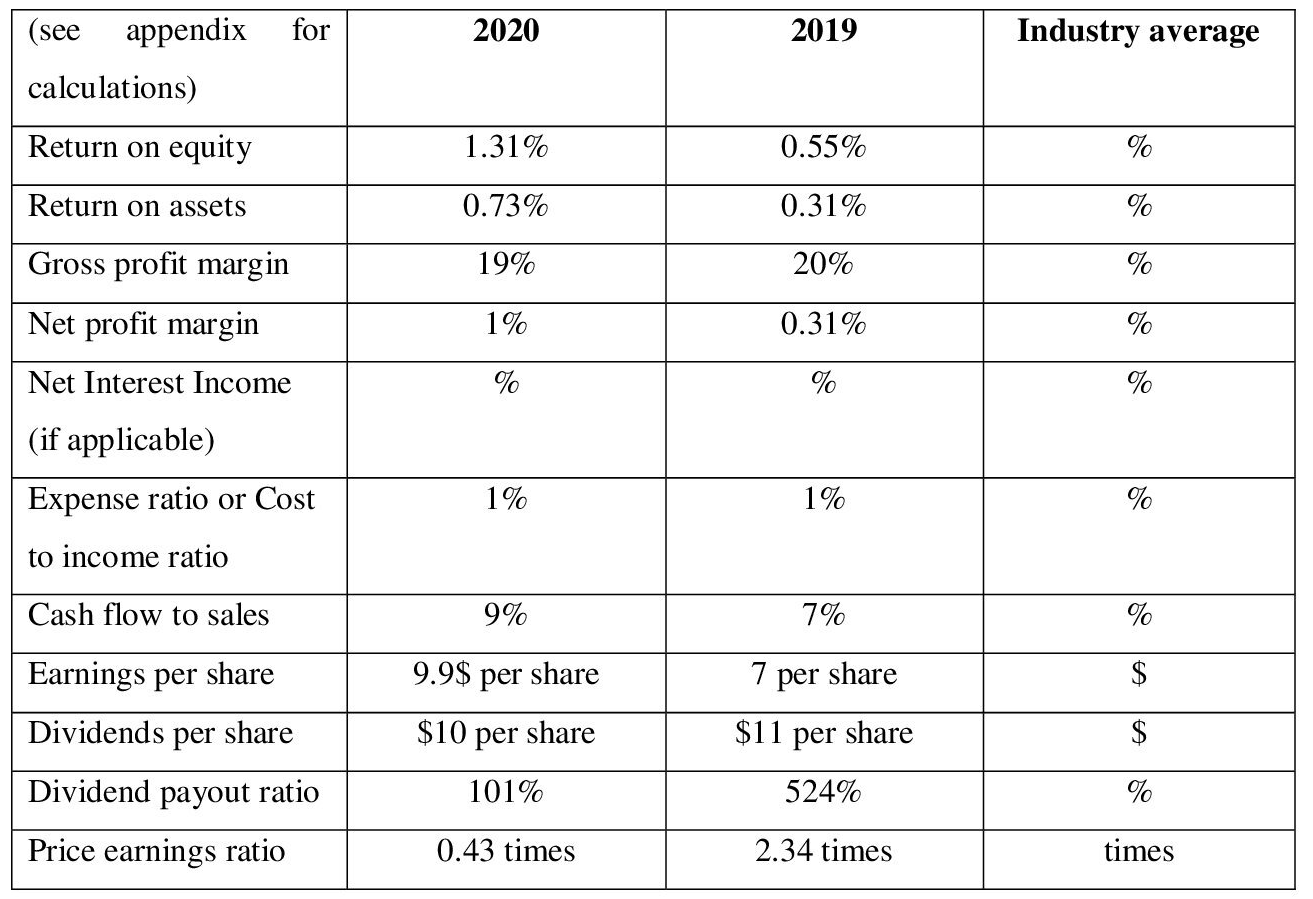
As can be observed by the table above, it represents the financial outlook of Bega Cheese for the years ending 2020 and 2019 to observe its trend and comment on its changing financial positioning. First thing to be observed is a steady growth in the ROE of business. ROE represents the returns that the company is generating from the effective investment of its equity share capital. As can be seen, even though the increase is marginal in nature, it indicates that the company’s expertise to improve its revenue stream from successful investment strategy has increased over a period of one year, and if the management continues to operate in the same pace, then the revenue stream would increase further in the future (Kanapickien? & Grundien?, 2015).
Further, the ROA, which indicates the returns from the total asset, has also increased to a marginal level from 0.31% in 2019 to 0.73% in 2020. This would not have any significant impact on the overall growth, but in general, a growing trend is a good indication and suggests that the assets of the company are effectively increasing its productivity and hence are able to generate better revenue based on the performance (Arkan, 2016).
However, the gross profit, which indicates the income of business after covering for the cost of goods sold, depicts a marginal trend, by falling to 19% in 2020 compared to 20% in 2019. Even though the decline is not drastic compared to the uncertainties that the business went through, if the reason behind the decline is not properly monitored, it would eventually leverage the entire operations of the company and would make the operations highly vulnerable. Usually, a declining trend is observed when the growth in COSG is higher than the revenue, or revenue has significantly declined, or sometimes a combination of both (Olariu, 2016).
The expense ratio seems to be in a constant state indicating the fact that the expenses have been kept effectively under control even under uncertain times like the pandemic, which has put a dent the overall performance of the business. The company needs to significantly focus on increasing its income, and be better able to cover for all the outstanding expenses, which at the moment, it relatively lower than the industry standard and is certainly an area of concern (Nofiana & Sunarsi, 2020).
The cash flow to sales ratio reflects a positive trend by increasing to 9% in 2020 compared to 7% of 2019. This means that the company has improved its cash retaining capacity and is saving more from total sales rather than spending in on operational activities of the firm. However, compared to the industry standard, the ratio is relatively lower, and means that the company is struggling to retain majority of its revenue and is rather spending a lot in its operations (Ball et al., 2015).
Further, the EPS of the business also reflects a increasing trend from 7 per share in 2019 to 9.9 per share in 2020. This means that the company has successfully invested its share in the market to improve its revenue stream. A n increasing EPS is always a good indication and suggests that the company is able of skillfully managing its revenue from and increase it using outstanding equity.
Dividend per share marginally declined which was expected as the company faced much hardship dealing with the impact of covid 19 virus. Finally. The P/E ratio of the company stood undervalued for the year 2020 compared to its value of 2019. This means that the shares of the business are being traded lower than the market value which is an ideal situation for buying shares (Ichsani & Suhardi, 2015).
• Efficiency ratios
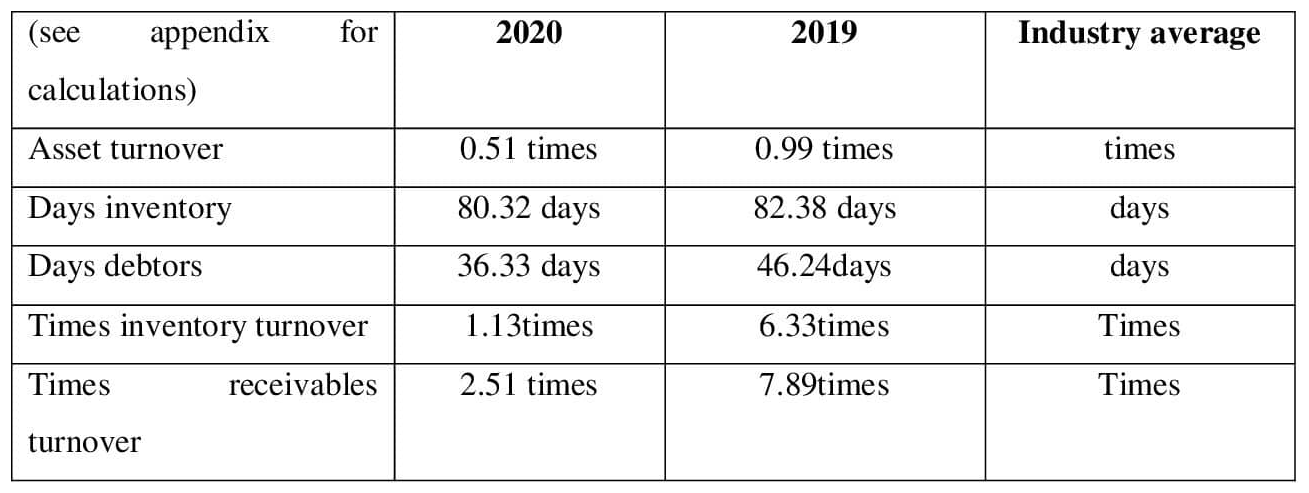
Efficiency ratios helps in assessing the ability of company to work efficiently and use its resources in a way that would generate the highest value for the company and decrease cash outflow as much as possible. Efficiency ratios are critical for the interpretation of company’s performance as it provides insight into the ability of business to effectively manage all the internal resources while keeping check on cash outflows in the process (Olesen et al., 2015).
As can be seen from the table above, the asset turnover of the business has a marginal declining trend and reduced to 0.51 times for 2020 compared to 0.99 of 2019. Even though it would not have drastic or immediate negative impact on the performance of business, a declining trend is indicative of the fact that the efficiency of total assets to generate and improve revenue has reduced, and hence the company needs to invest in the in improving its productivity and ensure that the assets are in demand and strengthen the balance sheet of business.
Day’s inventory is the number of days that the company rakes to sell its entire inventory and replace it with new one. As can be seen from the chart above, the days inventory of the business is relatively higher than the industry average. Investors usually prefer investing in companies with short inventories days as the revenue generation in these companies are usually high. Even though the days inventory of Bega Cheese has a declining trend, it is not very impressive compared to some of its competitors (Bunker, Cagle & Harris, 2019).
Days debtor on the other hand, indicate the amount of time it takes for a business to collect its receivable from debtors. As can be seen, the days debtor’s ratio of Bega cheese reduced from 46.24 days of 2019 to 36.33 days in 2020. This is a good indication and suggests that company is improving its capability of collecting its debts on time and to reduce the chances of incurring bad debts. It can undertake many initiatives to further improve its collection period like providing early bird discount. Times inventory of the business also has a declining trend which is not a good indication and suggests that the number of times an inventory is sold within a financial year has been reduced, primary due to pandemic Covid 19.
Time receivables turnover is the number of times a company collects its receivables from debtors. As can be seen, the times receivable of Bega Cheese for 2020 amounted to 2.51 compared to 7.89 of 2019, a downward trend which is not very preferred by investors as it means that the company is not putting much effort in collecting its receivables (Garanina & Belova, 2015).
• Liquidity ratios
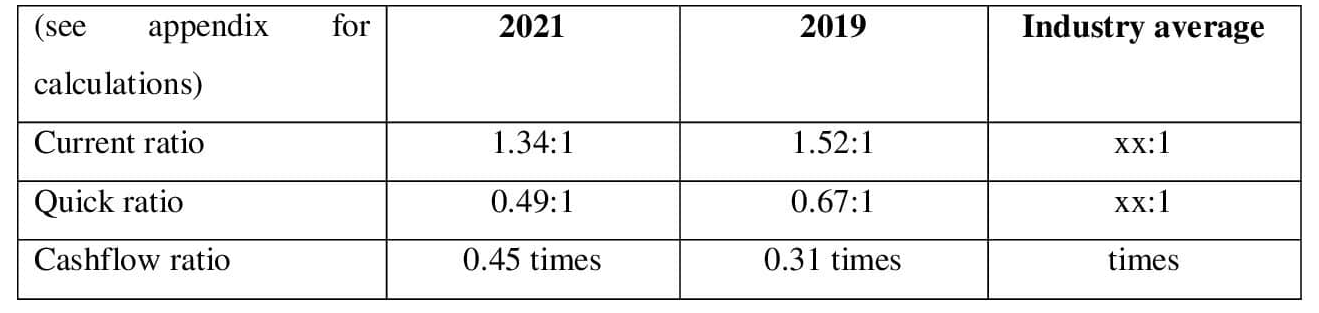
Liquidity ratio helps in assessing the short-term solvency of companies. The first and foremost liquidity that can be observed from the table above is current ratio. This ratio helps in comparing marketable assets with short term debts of the company. Current ratio of Bega Cheese for both the years is observed to be higher than one which means that the current ratio is higher than current liabilities and hence the business is capable enough to cover for all short-term debts without raising external source of funding (Saputra, 2019).
Quick ratio on the other hand helps in assessing the liquidity of business after deducting the inventories from current asset. As seen, quick ratio for both the years has been lower than one which means that the company is not capable enough to meet for its debts if the inventories are excluded from the current assets of the company (Alipour et al., 2015).
• Gearing ratios
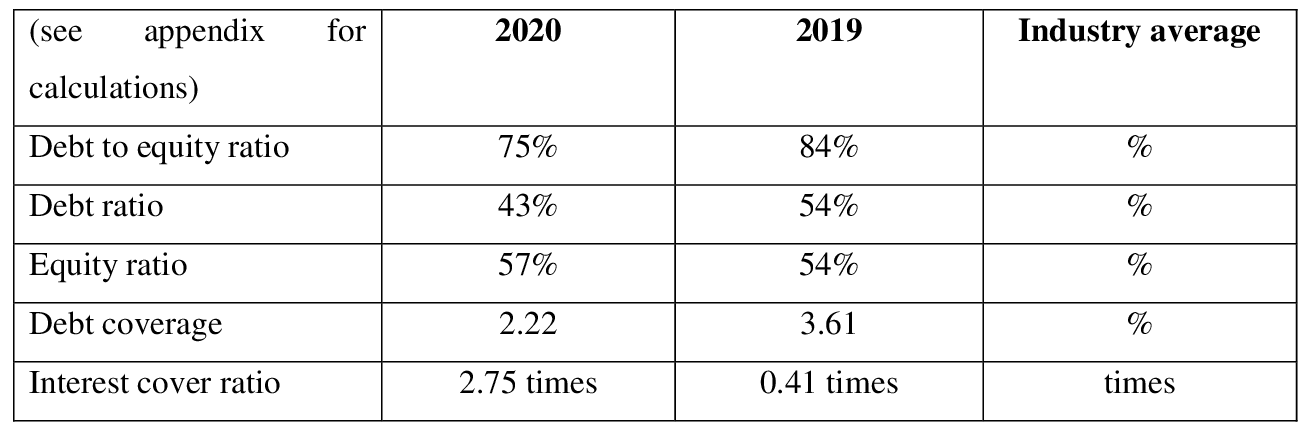
Gearing ratio helps in gaining insight into the liquidity of company. Debt to equity ratio of the business amounted to 0.75 for 2020 compared to 0.84 of 2019. For both the years the debt-to-equity ratio was lower than one which means that company gives more importance to equity to fund most of its operations (Trenca, Petria & Corovei, 2015).
Debt ratio on the other hand provides insight into the number of total debts used to fund the total assets that the company currently owns. The debt ratio of 2020 and 2019 amounted to 0.43 and 0.46 respectively. This means for every $1 spent on asset, 0.43 is funding from debts and rest from other sources of funding. Preference over s specific funding source is a matter of choice. Generally, businesses avoid being highly dependent on debts to fund most of its operation as the chances of becoming highly leveraged increases (Lang & Schmidt, 2016).
On the other hand, it can be noted that equity ratio of the business has an increasing trend which means that preference towards equity to fund the acquisition of assets is high. Also. Equity ratio of 0.57 means that for every $1 dollar spent on asset, 0.57 is sourced from the equity capital. Businesses gives high preference to equity ratio has it does not have the company leveraged and the company is not obligated to return back the capital gathered unlike the debt funding. However, the cost of maintaining equity capital is significantly higher than debt which needs to be keep in mind (Yapa Abeywardhana, 2017).
Debt coverage ratio indicates the ability of company to cover for long term debts using the cash from operating activities. As can be seen from the table above, the debt coverage ratio for both the years have been higher than one, even though having declining trend. This means that the cash from operating activities is significantly lower and can effectively cover for the long-term debts.
Lastly, the interest coverage ratio is a capital structure ratio which indicates the ability of business to cover for interest expense using the EBIT. As can be seen from the table above, the Interest coverage has significantly positive and increasing trend. This means that EBIT of company has increased at a faster pace than interest expense and hence Bega Cheese has become significantly capable of cover for its interest expense without needing funds from external sources (Öztekin, 2015).
• Recommendations and overall assessment
Has the reporting year been better than the prior reporting year for the company?
The reporting year of 2020 has not been better than the previous year, primarily due to the onset of Covid 19 pandemic is reduced prices of its dairy products. Further, the profitability ratios for both the years have not been very impressive given the competitive environment of dairy industry in Australia. Apart from the ROE, ROA and net margin ratios, with a marginal increasing trend all other profitability ratio had a declining trend (begacheese.com.au 2021).
This indicates, that even though the company has gain market leadership in the industry, it is still failing to generate significant income for itself, due to increase competition in the market and inability of investing in new innovative products. Further, the ROE and ROE of the company is not very impressive as well standing at 1.31% and 0.73% respectively which is an area of concern and indicates that the company is failing to generate value from its resources.
Will the company succeed in the future?
Based on the assessment of gearing and efficiency ratio, the chances of business succeeding in future is relatively high, as the business has survived an unfortunate event like the Covid 19 pandemic and was still able to improve its revenue significantly. Also, the current ratios of the business are more than 1 for both the years which means that the company is capable enough to cover for its short-term debts without raising external source of funding.
However, based on the efficiency ratio, the growth and success of business seems doubtful as the company does not have effective strategy in place to collect receivables from debtors and neither has a high receivable turnover ratio which increases the chances of incurring bad debts. As far as the gearing ratio is concerned, Bega Cheese is dependent on the equity share capital for funding most of its capital which means that the company would not get heavily leveraged in the future.
The likelihood of a merger or acquisition of the company?
In the upcoming years, the company is likely to acquire a business rather than getting acquired as it has significant hold over the market place and is a renowned dairy business located in Australia. It is also very likely to increase to create huge synergy through acquisition. However, the company has been lagging behind is significantly improving its profitability which is an area of concern,
Even if the company successfully acquires a business, the chances of becoming highly leverage would also increase. This is due to the fact that the company inclination towards debt money would steadily increase with increased requirement of capital. Further based on its interest coverage ratio, Bega Cheese would be able to cover for its long-term debts without needing external funding.
Suggest what should the company be doing help it succeeds
• There are several things that the business can do to improve its performance. Firstly, it can expand its line of products to attract higher customer base. It can expand its operation to international market which would help gaining traction from all around the world. It can also offer special discounts to its loyal customer to retain their loyalty.
Bega Cheese needs to improve their profitability and efficiency ratio which are considerably lagging behind in the market. The profitability can be increased by increasing revenue while the efficiency can be improved by increasing the returns from invested assets.
External impacts that need to be taken into consideration
The impact of government on the business
The external factors such as economy of country, political factors, technological factors, environmental and social factors are some of the aspects which the business needs to consider while taking any decision. Economic factors such as GDP growth can help boost the revenue of business while political factors can limit the chances of success.
Government can impose higher tax on businesses making significantly high revenue which posses’ immense threat to the income of company. Further, it regulates the performance of businesses in the market which is another reason why it is necessary to abide by the rules and regulation set by the administration of country.
Would you invest in this company?
Based on the performance and evaluation of ratios, I would not invest in the stakes of business and rather look for better alternatives which has higher chances of geniting revenue. The major concern for me is declining EPS and ROE which are two critical areas depending on which a company can the performance is assessed. Also, the shares are trading lower than market value which is another red signal for the company.
• References/Bibliography
Alipour, M., Mohammadi, M.F.S. & Derakhshan, H., (2015). Determinants of capital structure: an empirical study of firms in Iran. International Journal of Law and Management.
AREAS, B., (2018). Financial analysis. growth, 30, p.10.
Arkan, T., (2016). The importance of financial ratios in predicting stock price trends: A case study in emerging markets. Finanse, Rynki Finansowe, Ubezpieczenia, (79), pp.13-26.
Ball, R., Gerakos, J., Linnainmaa, J.T. & Nikolaev, V.V., (2015). Deflating profitability. Journal of Financial Economics, 117(2), pp.225-248.
Begacheese.com.au 2021. Home - Bega Cheese. [online] Retrieved from: https://www.begacheese.com.au/
Bunker, R.B., Cagle, C. & Harris, D., (2019). A Liquidity Ratio Analysis of Lean vs. Not-Lean Operations. Management Accounting Quarterly, 20(2), pp.10-16.
Garanina, T.A. & Belova, O.A., (2015). Liquidity, cash conversion cycle and financial performance: case of Russian companies.
Ichsani, S. & Suhardi, A.R., (2015). The effect of return on equity (ROE) and return on investment (ROI) on trading volume. Procedia-Social and Behavioral Sciences, 211, pp.896-902.
Kanapickien?, R. & Grundien?, Ž., (2015). The model of fraud detection in financial statements by means of financial ratios. Procedia-Social and Behavioral Sciences, 213, pp.321-327.
Kourtis, E., Kourtis, G. & Curtis, P., (2019). Αn Integrated Financial Ratio Analysis as a Navigation Compass through the Fraudulent Reporting Conundrum: Α Case Study. International Journal of Finance, Insurance and Risk Management, 9(1-2), pp.3-20.
Lang, M. & Schmidt, P.G., (2016). The early warnings of banking crises: Interaction of broad liquidity and demand deposits. Journal of International Money and Finance, 61, pp.1-29.
Mitrovi?, A., Kneževi?, S. & Veli?kovi?, M., (2015). RATIO ANALYSIS SPECIFICS OF THE FAMILY DAIRIES’FINANCIAL STATEMENTS. ????????? ????????????, 62(4).
Nofiana, L. & Sunarsi, D., (2020). The Influence of Inventory Round Ratio and Activities Round Ratio of Profitability (ROI). JASa (Jurnal Akuntansi, Audit dan Sistem Informasi Akuntansi), 4(1), pp.95-103.
Olariu, D.B., (2016). Profitability ratio as a tool for bankruptcy prediction. SEA–Practical Application of Science, 4(11), pp.369-372.
Olesen, O.B., Petersen, N.C. & Podinovski, V.V., (2015). Efficiency analysis with ratio measures. European Journal of Operational Research, 245(2), pp.446-462.
Öztekin, Ö., (2015). Capital structure decisions around the world: which factors are reliably important?. Journal of Financial and Quantitative Analysis, 50(3), pp.301-323.
Saputra, A.J., (2019). The Effect Of Liquidity Ratio Leverage Ratio And Activity Ratio In Predicting Financial Distress. Management and Economic Journal, pp.581-592.
Setiawan, H. & Amboningtyas, D., (2018). Financial Ratio Analysis for Predicting Financial Distress Conditions (Study on Telecommunication Companies Listed In Indonesia Stock Exchange Period 2010-2016). Journal of Management, 4(4).
Trenca, I., Petria, N. & Corovei, E.A., (2015). Impact of macroeconomic variables upon the banking system liquidity. Procedia Economics and Finance, 32, pp.1170-1177.
Yapa Abeywardhana, D., (2017). Capital structure theory: An overview. Accounting and finance research, 6(1).
MBM BST 713 Analysing Financial Performance Assignment Sample
Assignment Brief
• You are required to produce a 2,000 word individual report containing:
An analysis of the financial performance and position of Marks and Spencer. Your analysis should be based on your calculation of basic accounting and financial ratios for 2021, and 2020 for comparative purposes; and an evaluation of the results of those calculations. In addition, your analysis should be supplemented by key data contained in the narrative sections of the 2021 annual report and other sources; (40 marks)
• a consideration of Marks and Spencer’s prospects for the foreseeable future, taking into account the challenges facing the group and its responses thereto;(30 marks) and,
• drawing on appropriate literature, an assessment of the extent to which Marks and Spencer could justifiably claim to have a diverse board of Directors. (20 marks)
The remaining 10 marks will be awarded for the presentation and structure of your report and appropriate referencing.
The report can be found here:
https://corporate.marksandspencer.com/msar2021/m-and- s_ar21_full_210602.pdf
Report Guidance:
As a guide, for the report, you should aim to devote:
• 900 words on Marks and Spencer’s past financial performance;
• 600 words on the future prospects of the group; and
• 500 words on the corporate governance aspect.
In addition, you should present the accounting ratios as a table in an appendix to your report for https://www.theassignmenthelpline.com/ (see proforma on final page); the appendix will not be included in the overall word count for the assignment. You MUST show the figures you use in the calculation of the ratios AND, if they do not come from the face of the Consolidated Statement of Comprehensive Income or the Consolidated Statement of Financial Position, you must show the exact source of the figure(s). Failure to do so will result in no marks being awarded for that calculation.
Your report should also be:
1. Word-processed;
2. Professionally presented with page numbers and having undergone a Grammar/spell-check;
3. Properly referenced (where you use words taken from a source, you must give a proper citation to that source).
Academic Misconduct
You need to be aware that this is an individual assignment. Academic misconduct will not be tolerated. Do not be tempted to copy another’s work or use another person to do the work that you should do yourself. Academic misconduct will result in an award of a zero mark, at best; at worst, the consequences could be more serious.
Submission Details:
Deadline for submission is: 11.00 AM BST, March 18, 2022. The report must be submitted via the Learning Central portal. If you have any queries or difficulties with submitting your work, please address those to the PG Hub, NOT to academic staff.
Solution
Introduction
The business environment is uncertain and dynamic that is faced by the business organization. This report provides the business performance analyses of Marks and Spencer by implementing the ratio analyses tool. It also contained the recommendation to improve the business performance of the company. It considers the foreseeable future of the company and the challenges faced by the company. Diversify board of directors has been assessed in this report.
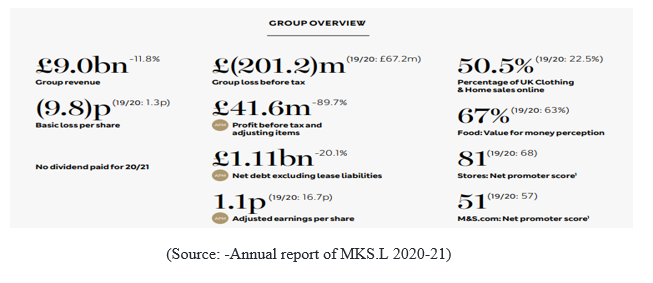
Company outlook(MKS.L)
Marks and Spencer Group plc engaged in the industry of department stores in the sector of consumer cyclical with the total number of employees of 69577. It operates as a retail store in 5 segments. These five segments are UK Clothing & Home, UK Food, International, OCADO, and all others. It offers protein daily, ambient, dairy produce, meals dessert, and food on move products. It also provides women's wear, menswear, and clothing for kids. Apart from that company invest in real estate property. It has been founded in 1884 and headquarter in London, The United Kingdom (MKS.L 2021).
Financial review of MKS.L
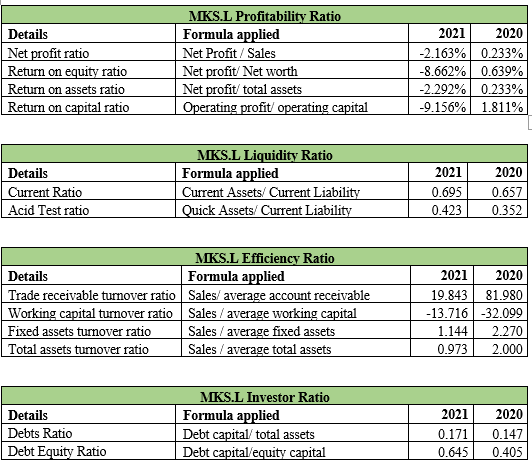
To assess the financial performance of the business organization, the ratio analyses tool is the best option. It helps to assess the financial data of the company in comparative form so that trends in each financial item can be understood easily. It considers the financial data of more than 1 year. Following are the computational ratio analyses of the Marks and Spencer Group plc:-
Core ( Financial Ratio computation)
Additional ( Interpretation , Notes to accounts)
Narratives
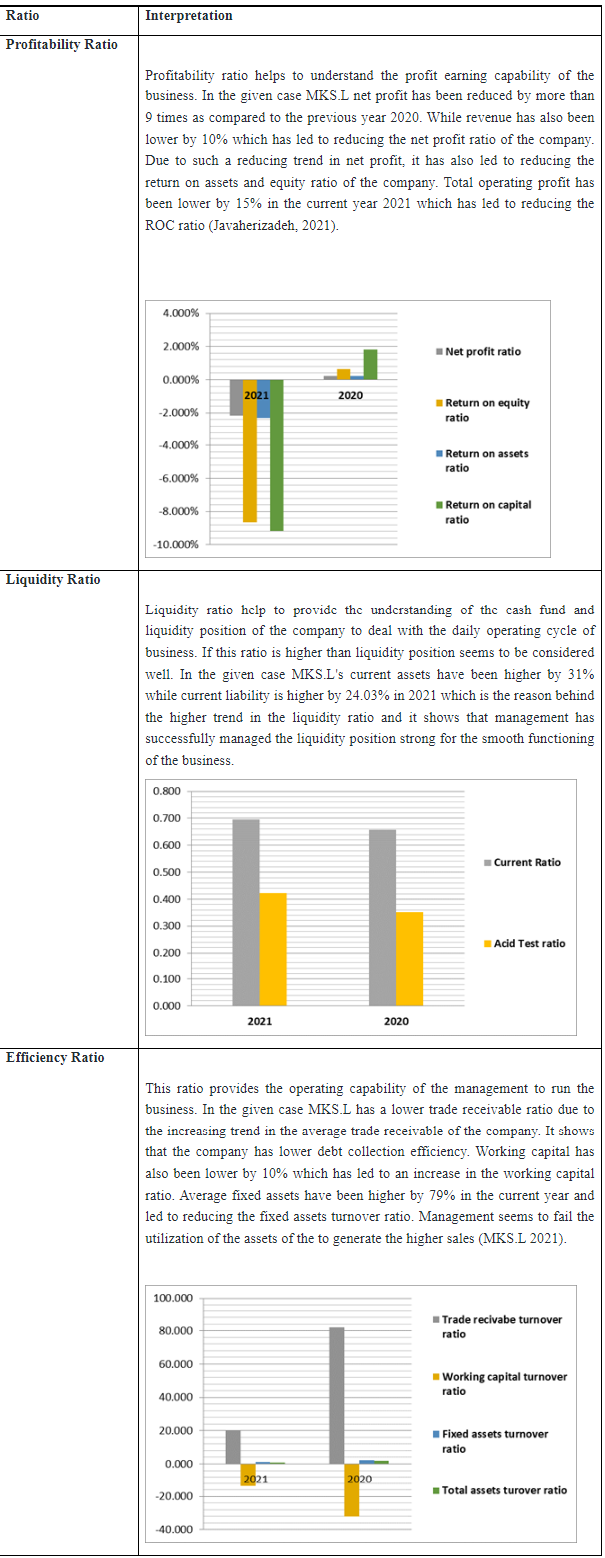
Hence it can be observed that MKS.L company has not performed well in the current year 2021. It needs to improve the performance by considering the cost control factor so that profitability gets positive in next upcoming years. The company needs to improve the efficiency ratio too so that operating capability can be increased and businesses will get benefit from it. The company should focus on the long-term goal and cost control should also be done by incorporating the new policy (Easton,& Zhang, 2018).
Future Prospectus
Marks and Spencer Group Plc. is a British based multinational company that runs its business in the retail sector and the headquarters of the company is located in London. The company has different lines of business which includes retail stores of clothes, food stores, and home products. The company had its presence in the industry for a long. But, in 2018 a radical plan was issued by the company where it stated that the company will be closing its 100 stores worldwide by 2022 (MKS.L 2021).
During the pandemic, the company has cut down more than 7,000 jobs, because the stores were closed and the expenses of the company were exceeding the income that the company was earning from running the stores. Moreover, again in 2021, the company has announced that other than 100, it will be closing 30 more stores, in the next 10 years, as a part of its turnaround plan. Based on the financial analysis conducted above, it can be said, that in some areas the company has been able to maintain its stance, such as the liquidity of the company is strong in 2021 in comparison to 2020. On the other hand, the efficiency ratios of the company have declined which states that the company has not been utilizing its assets to earn income for the shareholders (MKS.L 2021).
Core Analysis
In the past few years, the company is facing several issues, due to which the company had to come up with different turnaround plans, where they are deciding to close the stores. The policy of the company has always been clear, where they want to satisfy the customers by providing them valuable products. As a part of its future, the company has decided that they want to come up with stores that fit the future and will help the company to achieve its transformation goals. The strategy that a company can use is to open the right stores, at the right locations. This can be done by conducting market analysis, which will help the company to identify the central locations, where the company should open its stores. It will also help the company to close the stores in the location which is not yielding results for the company (Joshi, et al., 2021).
To achieve the future that the management has seen the company will require to indulge in some investing and renewing the new stores to target the new markets that the company is viewing. This can be done by redeveloping the existing space that is available with the company. There are several risks and issues that the company is facing, which is stopping the company from moving forward.
One such issue has been exiting of UK from EU. This has initiated the Brexit contract among, which the trade between UK and EU countries have been limited. Hence, the company has to work on its importance and make strong its third-party relationships. The company plans to do this, by focusing on customer loyalty and improving the brand experience provided to customers.
External fact analysis
Apart from this, there are several regulatory changes in SOX that are impacting the business of the company. As the regulations are changing, the risks of the company coming under scrutiny have increased and the future reporting requirements of the company has also increased. However, in the past two years, the performance of the company has declined in several aspects because of the emergence of the pandemic but, it has also helped the company to learn new things. Such as it has helped the company to understand how it can respond to the customers quickly and how important it is to maintain touch with the customers. As a result, the company immediately decided to improve their website, so that customers who cannot go to retail stores can order goods online. This involved refocusing the strategy of the company, and instead of maintaining retail stores, the company should try to shift its focus to online stores (Schleper, et al., 2021).
In the future, the company wishes to accelerate its stores, and improve the experience of customers. Also, the main issue or challenge that the company is facing is regarding its property portfolio which is aged, due to which the company is not able to focus on its earning from investment in property. Hence, the company plans to upgrade its property portfolio, which has been negatively impacted due to pandemic.
Hence, if the company implements what they have decided while keeping the sustainability aspect in mind, the company will have a bright future.
Governance practice:
The responsibilities that are borne by the board of directors of the company are very important. They are basically the agents of shareholders, who are the owners of the company. The duty of the board of directors is to manage the business effectively and formulate operating and financial strategies to ensure that the practices of the company are helping the business to grow (Zopounidis, and Passas, 2020).
Over the years, the focus has been put on the board of directors, whereas part of the regulation, it is compulsory for every company to have non-executive directors on their board. Along, with this, it is important that at least one of the non-executive directors is a person with skills and competence in accounting, finance, etc. Hence, here the importance of board diversity is dictated. When there is diversification in board, it leads to effective decision-making, it helps in better utilization of talent, and it increases the level of relationship that company has with the shareholders of the company (Dicuonzo and Dell’Atti, 2022).
Diverse board of directors
The governance of Marks and Spencer is also diversified. Over the years, there are several changes that the company has made in its board of directors, were not long back company has introduced two more non-executive directors, and the same was done by the company to ensure that their board of directors are balanced. This is done because of the uncertainties that are prevailing in the market amid pandemic and Brexit (Yukhno, 2022).
The board of directors of the company is diversified and it helps them to enhance their decision making. Some directors of the company are proficient in law and help the company to ensure that they are abiding by the legal laws. Other directors of the company are proficient in finance and help the company to take decisions amid pandemic, and how the situation can be controlled.
Recommendation
Hence, for every company in the business, it is advisable that the board of directors of the company are diversified, as it will help them to improve their choices, and will lead to better decision making. When the board of directors of the company are not diversified it leads to bad decision making, because the choices are limited, and there are no educated people who will question a decision, or who will put their opinion in front.
Conclusion:
From the above, it can be concluded that Marks and Spencer have been in the retail business for a long now, as the company had been able to make its name in the industry. However, for the past few years, the company is facing issues, due to which they have taken the decision of closing some of the stores. As a result, the company is thinking of renovating the strategies that they have currently employed, which included new stores, and diversifying the board of directors of the company.
Reference:
Aigbedo, H. 2021. An empirical analysis of the effect of financial performance on environmental performance of companies in global supply chains. Journal of Cleaner Production, 278, 121741.https://www.sciencedirect.com/science/article/pii/S0959652620317881
Annual report of the Marks and Spencer has been retrieved from https://corporate.marksandspencer.com/annualreport
Dicuonzo, G., Donofrio, F., Iannuzzi, A.P. and Dell’Atti, V., 2022. The integration of sustainability in corporate governance systems: an innovative framework applied to the European systematically important banks. International Journal of Disclosure and Governance, pp.1-15. https://link.springer.com/article/10.1057/s41310-021-00140-2
Easton, P.D., McAnally, M.L., Sommers, G.A. and Zhang, X.J., 2018. Financial statement analysis & valuation. Boston, MA: Cambridge Business Publishers. https://www.fau.edu/graduate/faculty-and-staff/programs-committee/docs/02202019/NCP-ACG5176.pdf
Javaherizadeh, E. 2021. An empirical study on the impact of female leaders and intellectual capital on the financial performance of FTSE 350 companies (Doctoral dissertation, University of West London).http://repository.uwl.ac.uk/id/eprint/8511/
Joshi, N., Gabhane, D., Devi, B. P., & Somashekhar, I. C. 2021. How social media marketing is helping in customer retention and customer engagement: A case of Marks and Spencer. SPAST Abstracts, 1(01).https://spast.org/techrep/article/view/3561
Ramzan, M., Amin, M., & Abbas, M. 2021. How does corporate social responsibility affect financial performance, financial stability, and financial inclusion in the banking sector? Evidence from Pakistan. Research in International Business and Finance, 55, 101314.https://www.sciencedirect.com/science/article/pii/S0275531919301199
Schleper, M. C., Gold, S., Trautrims, A., & Baldock, D. 2021. Pandemic-induced knowledge gaps in operations and supply chain management: COVID-19’s impacts on retailing. International Journal of Operations & Production Management.https://www.emerald.com/insight/content/doi/10.1108/IJOPM-12-2020-0837/full/html?utm_source=rss&utm_medium=feed&utm_campaign=rss_journalLatest
Zopounidis, C., Garefalakis, A., Lemonakis, C. and Passas, I., 2020. Environmental, social and corporate governance framework for corporate disclosure: a multicriteria dimension analysis approach. Management Decision. https://www.researchgate.net/profile/Alexandros-Garefalakis/publication/346060596_Environmental_social_and_corporate_governance_framework_for_corporate_disclosure_a_multicriteria_dimension_analysis_approach/links/5fbb452d299bf104cf6cf32e/Environmental-social-and-corporate-governance-framework-for-corporate-disclosure-a-multicriteria-dimension-analysis-approach.pdf
MCR006 Financial Management Assignment Sample
Assignment Brief
Due date - Friday Week 10 11.59 pm
Weight - 15%
Marks for assignment - 50
The Research Report should contain no more than 2,000 words, excluding references.
Submission via Turn-it-in on Moodle and strict adherence to submission and uploading rules to be followed. All parts should be answered.
All references and examples must be within an Australian context.
Scope of the research can include Academic articles and journals, and relevant Books. Students are encouraged to use the e-library resources.
Assignment Topics
Complete all questions for assignment help
Part A 400 words each 10 marks each
a. Explain how the general dividend valuation model values a share.
b. Explain, compare and contrast the various capital budgeting methods such as the Net
Present Value Method, the Payback Period, the Accounting Rate of Return and the Internal Rate of Return.
c. Discuss the two Modigliani and Miller propositions and the key assumptions underlying them and their relevance to capital structure decisions.
Part B 800 words 20 marks
Your Board of Directors is considering acquiring a business in the same industry. The Board has not undertaken such a venture before. The CEO has come to you to ask you to prepare a Board report
which clearly explains the 3 main methods of valuing a business. Include in your report the specific valuation methods the board should consider when making their decision on the company they should acquire. Assume this is a listed company and the company Being acquired is a listed company.
In the report identify and explain some other areas than valuation methods that should be considered by the directors when undertaking the acquisition of another organisation.
Solution
Abstract
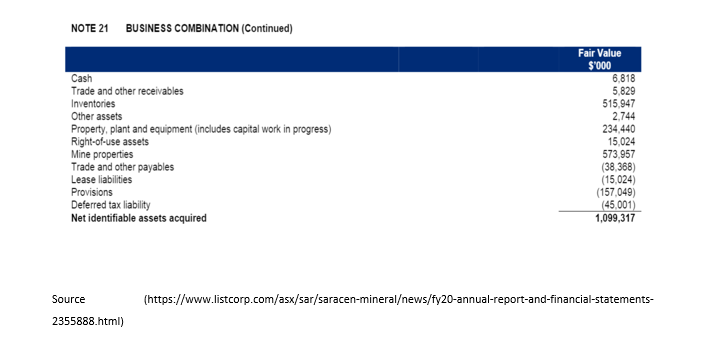
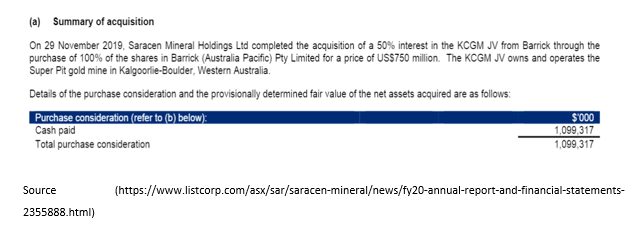
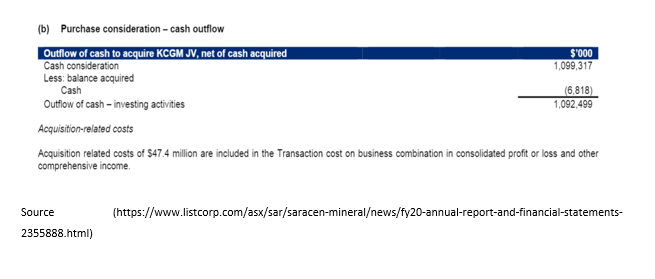
This report provides the acquisition analyses of the two business corporate belong to Australia in the industry of gold mines. Saracen Mineral Holdings has acquired Kalgoorlie Consolidated Gold Mine. It also includes the various financial appraisal technique and model. Saracen Mineral Holdings company engaged in the mineral development and exploration while KCGM has also been engaged in the same business filed.
Part A
a. Dividend Valuation Model
The dividend is referred to as a part of a business's profit that is distributed by an entity to its shareholders (Sahoo 2020). Whenever a business entity earns profits, it has the option to either reinvest the earned profits in its business or payout such profits to its shareholders in the form of a dividend. Different patterns or models may be followed by the business entities for the payment of dividends. These dividend valuation methods help in determining the value of an entity's share. These patterns may include the following:
? Zero Growth Model
When the payment of dividends by any business entity is expected to remain the same in the future, then it may be said that the business entity applies a zero growth dividend model. The following formula may be used to determine the value of share when the entity is using a zero growth model for the dividend payment:
Stock’s Value = Dividend / Required (RoR) Rate of Return
The above formula is also used to determine the present value (PV) of perpetuity. Also, the formula may be used to calculate the price of the preferred stock of the entity that pays the dividend at a particular rate. The price of the stock may change in the zero-growth model when there is a change in the required rate (RoR) of a return due to the change in risk factors (d'Amico & De Blasis, (2020)).
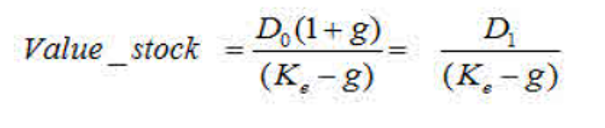
? Constant Growth Model
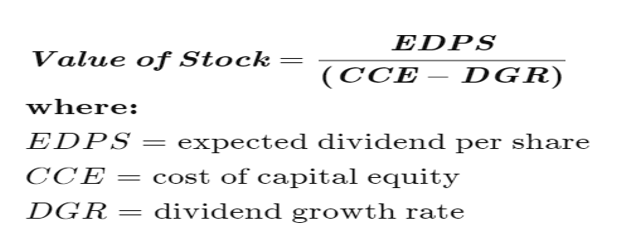
When the payment of dividends by any business entity is estimated to grow or increase at the same rate in the future, then it may be said that the business entity applies a constant growth dividend model. It is also known as Gordon (GGM) Growth Model. Valuation of matured companies may be performed based on this dividend model. The dividends of matured companies using this model increase on a steady basis. The formula in the below-provided image is used to determine the value of the entity's share who is applying constant growth model for dividend:
? Variable Growth Model
The variable growth model is the most commonly used dividend model in a real-life scenario. As the business entity goes through different phases, it becomes difficult for the entity to pay the same dividend every year. The growth in the variable model may be divided into 2 or 3 phases. The growth rate in the initial phase may be high, then it may get low in the transition phase and finally, it may end with a lower dividend rate. The formula in the below-provided image may be used to calculate the stock value as per the variable model:
b. Capital Budgeting
Capital Budgeting is a method used in finance to evaluate the potential of a major investment proposal or project (Siziba & Hall, (2021)). It helps the investors to ascertain the value that a potential project may provide to them. Capital Budgeting helps to make an important investment decision that may increase its profitability and ultimately the wealth of its shareholders (Cloyne & Surico, (2018)). Different methods may be used by the business entity in the process of capital budgeting that has been discussed hereunder:
? Net Present (NPV) Value
Net Present (NPV) Value helps to assess the profitability aspect of an investment proposal in the process of capital budgeting (Kadim & Husain, (2020)). The present value (PV) of all the cash inflows that are expected to be generated through the tenure of the project is subtracted from the present value (PV) of all the cash outflows to arrive at the Net Present (NPV) Value. If the difference between the cash flows is positive that the investment project may be considered viable. The discount rate is used to ascertain the expected cash flows of the future period. Assessing the profitability of a project from NPV may have several errors as it is based on various assumptions & estimates.
? Payback Period
The payback period is the period by which the investment cost in any investment project is recovered. It is the period by which the project reaches its break-even. A short payback period is considered favorable by the investors. This method has some limitations as it ignores the time value (TVM) of money. Overall profitability of an investment proposal may not be ascertained through the payback period as it will only tell the time by which cost will be recovered and it will not tell what will happen after such period.
? Internal Rate (IRR) of Return
Internal Rate (IRR) of Return is referred to as a rate of discount that will make the NPV of future cash (FCF) flows to zero. A higher IRR is always considered good by the investors. It is calculated similarly as the NPV is calculated. The only difference in the calculation is that IRR makes the NPV zero.
? Accounting Rate (ARR) of Return
Accounting Rate (ARR) of Return is referred to a rate (RoR) of return that may be expected from an investment in comparison to the cost of the initial investment. ARR is calculated by dividing the average revenue of an asset by the entity's initial investment. ARR is useful when determining the profitability of investment quickly but it ignores the time value (TVM) of money.
c. Modigliani & (MM) Miller Approach
The theory of Modigliani & (MM) Miller Approach states that the overall value of a business entity is not affected by its capital structure. In Modigliani & (MM) Miller Approach's first version there were a lot of limitations as such version was developed with the assumption that a business entity operating in the perfectly efficient industry wherein it need not pay taxes. Later on, Modigliani along with Miller developed the next version of the theory wherein they included bankruptcy costs, asymmetric data, and taxes.
MM Approach in Perfect Market
Modigliani & Miller's first version of the theory assumed that businesses always operate in the perfectly efficient market. This means that the business entities are not required to pay tax, no transaction costs are incurred on the trading of the entity's shares. Also, it had the assumption that no bankruptcy costs are incurred in case of bankruptcy.
Proposition 1 (First Version)
Value of (Vl) Levered Entity = Value of (Vu) Unlevered Entity
According to the first proposition, the value of an entity is not affected by its capital structure whether it is funded by only equity or by a combination of debt & equity as its value is determined by the present value (PV) of future (FCF) cash flows. Additionally, entities need not pay taxes in a perfect market, the entity does not get a benefit tax deduction for the interest on the debt.
Proposition 2 (First Version)
Cost of (Re) levered equity = Cost of (Ra) unlevered equity + Debt to (D/E) Equity (Ra – Cost of (Rd) Debt)
According to the 2nd Proposition of the theory, the Cost of (Ke) Equity and leverage level of entity is directly proportional. When leverage level increases, the entity's profitability of entity also increases.
MM Approach in Real Life
Proposition I
Value of (Vl) Levered Entity = Value of (Vu) Unlevered Entity + Tax Rate x Debt
According to the 1st Proposition, the value of (Vl) levered entity is higher than the unlevered entity's value because of the tax benefit shield on the interest payment.
Proposition II
Cost of (Re) levered equity = Cost of (Ra) unlevered equity + Debt to (D/E) Equity x (1 – Tax Rate) x (Ra – Cost of (Rd) Debt)
According to the 2nd proposition, the cost of (Ke) equity and leverage level of the entity is directly proportional. The effect of tax shield makes the cost of (Ke) equity& entity’s leverage level less sensitive to each other.
Part B
Board Report
Introduction
At Saracen Mineral Holdings, all of our operations are controlled and managed by the Board of Directors on shareholders' behalf. This report has an agenda for the acquisition of the business of one of the listed companies known as Kalgoorlie Consolidated Gold Mines (KCGM) which is also engaged in the business of gold mining.
Reason for Acquisition
The main reason for the acquisition is to become the source player in the gold industry and to remain in the field of basic material . As our company is competing with Saracen Mineral in the Gold industry, its acquisition will help our company in gaining competitive advantages and both the company will merge to create the AUS 16 billion global gold producer (Saracen Mineral Holdings 2019)
Capital Expenditure
On considering the business of Saracen Mineral and its market value, Board is willing to expand a budget of AUD 1099.31million (Saracen Mineral Holdings 2019) Various business valuation methods have been applied to assess the most realistic value for the business of Saracen Mineral .
Business Valuation Methods
? Net Asset Method
Net Asset Method is one of the business valuation methods that derive the value of an entity's business by deducting all the liabilities of the entity from its total assets. The following formula may be used to derive the net asset of the business.
Net Assets = (Assets in Total – Total Liabilities – Preferred Stock) / Outstanding Equity Shares
Net Asset (NAV) Valuation helps to understand the real worth of the business. The acquirer firm always wants to assess the value of the acquired firm to offer the best bid price. SARACEN MINERAL HOLDINGS is getting the value of 50% by paying a sum of $ 750 million which is a very great deal for the entity. This will add value to the wealth of the shareholders in the coming future (Saracen Mineral Holdings 2019)
? Price-Earnings (P/E) Ratio
Price-Earnings (P/E) ratio is used to determine the value of the business by comparing the share price of an entity's share with its earnings (EPS) per share (Anwar, (2019)). PE ratio helps to understand whether the share price of an entity is undervalued or overvalued. This ratio helps to know the value that an investor may pay for an entity's share on the earnings of the entity (Wibowo & Radianto, (2019)). The P/E ratio of KCGM is 24.14 and the P/E ratio of the industry in which Kalgoorlie Consolidated Gold Mines Operates is 18.6. This means that the share price of KCGM is undervalued and it is a great opportunity for us to make our investment in KCGM 's Business.
? Discounted Cash (DCF) Flow
Discounted Cash (DCF) Flow is one of the business valuation methods that consider the present value (PV) of all the cash flows that are expected from the investment proposal. The present value (PV) of future cash (FCF) flows are added with the present value (PV) of Terminal value (TV) to arrive at the total value of the business (Fernandez, (2019)). The following images are presented to show the business value of Kalgoorlie Consolidated Gold Mineson the basis of the DCF method:
According to the above calculation, the value of each share of KCGM is lower than market price of its share. This means that the share of the company is undervalued and the company has the potential to grow shortly that making it a great investment opportunity that will surely bring value addition to SARACEN MINERAL HOLDINGS and will help in increasing the wealth of its shareholders in near future.
Compliances
? Appropriate standards for corporate governance along with legal compliance are required to be established by the management to proceed with the acquisition.
? Statement on Corporate Governance along with ASX Appendix is required to be approved
? Charter of Board committee is required to be approved
Risk Management
? Framework for managing the overall risk of the company is to be approved.
? Policies regarding risk management, taxes, and financials are required to be approved.
? Due Diligence shall be exercised to make sure that the company is complying with all the required obligations.
Human resources
? Selection, Remuneration, cessation, and termination terms for the Managing director along with the CEO are required to be approved.
? Performance objectives for every person shall be set.
? Incentive plans for the employees shall be considered by the board.
Health & Safety
? Board is required to consider the reports on health & safety along with the environment.
? It shall be made sure that the health & safety of the entity's people is not compromised at any cost and the entity complies with all the environmental obligations.
? Policies related to health & Safety shall be approved.
? Policies related to Environment shall be approved.
References
Anwar, Y. (2019). The effect of return on equity, earning per share, and price earning ratio on stock prices. The Accounting Journal of Binaniaga, 4(01), 57-66.https://stiebinaniaga.ac.id/e-journal/index.php/Accounting/article/download/314/264
Cloyne, J., Ferreira, C., Froemel, M., & Surico, P. (2018). Monetary policy, corporate finance, and investment (No. w25366). National Bureau of Economic Research.https://www.nber.org/system/files/working_papers/w25366/w25366.pdf
D'Amico, G., & De Blasis, R. (2020). A review of the Dividend Discount Model: from deterministic to stochastic models. Statistical Topics and Stochastic Models for Dependent Data with Applications, 47-67.https://arxiv.org/pdf/2001.00465
Fernandez, P. (2019). Three residual income valuation methods and discounted cash flow valuation.http://pruss.narod.ru/ThreeIncome_OneDCF.pdf
Kadim, A., Sunardi, N., & Husain, T. (2020). The modeling firm's value is based on financial ratios, intellectual capital, and dividend policy. Accounting, 6(5), 859-870.http://m.growingscience.com/ac/Vol6/ac_2020_48.pdf
Sahoo, V. D. Investors perception on Dividend Policy and Valuation Models (2020) .https://www.academia.edu/download/79810078/13635.pdf.pdf
Siziba, S., & Hall, J. H. (2021). The evolution of the application of capital budgeting techniques in enterprises. Global Finance Journal, 47, 100504.https://repository.up.ac.za/bitstream/handle/2263/74586/Siziba_Evolution_2020.pdf?sequence=1
Wibowo, A. I. L., Putra, A. D., Dewi, M. S., & Radianto, D. O. (2019). Differences In Intrinsic Value With Stock Market Prices Using The Price Earning Ratio (Per) Approach As An Investment Decision Making Indicator (Case Study Of Manufacturing Companies In Indonesia Period 2016-2017). Aptisi Transactions On Technopreneurship (ATT), 1(1), 82-92.https://att.aptisi.or.id/index.php/att/article/download/23/6
BEAFGE Business Economics and Finance in a Global Environment Assignment Sample
A. Project question
You have received an email from the Chief Executive Officer of Clark Casc Logistics plc, where you are employed as manager of the refrigerated goods division, inviting you to the first in a series of budget-setting meetings and asking you to submit a brief report in advance for assignment help.
You are only permitted to submit your report once. Trial runs are not permitted and no spare, draft or test drop boxes will be provided. It is your responsibility to submit your own work and to ensure that your report is finalised, complete and properly edited before, not after, you submit it.
This is an individual assignment. The sharing of files or copying of work between students is not permitted.
You are only allowed to submit one document, which must contain your full report, including your reference list. Do not attempt to submit additional documents.
Your submission must be either a Word document in .doc or .docx format or a .pdf document.
Appendices are not permitted.
Dear “Laser”,
For the last financial year Clark Casc Logistics plc made a profit of £32 million – with profits of £18 million in the first six months of this year and the Board believes that there is scope for continuing expansion. We are therefore reaching out to all managers to provide realistic budgets for the income and costs for which they are responsible, so that we can plan ahead with confidence.
We will be holding a first round of budget-setting meetings on Thursday next week. As the manager of the refrigerated goods division, the income and expenditure for which you were responsible for the last financial year were as follows.
Your expenditure for the first six months of the present financial year is as follows, with a comparison with the budget which, I would remind you, you agreed to this time last year.
Year Ended April 30th 2022
Six Months to October 31st 2021
Refrigerated Goods
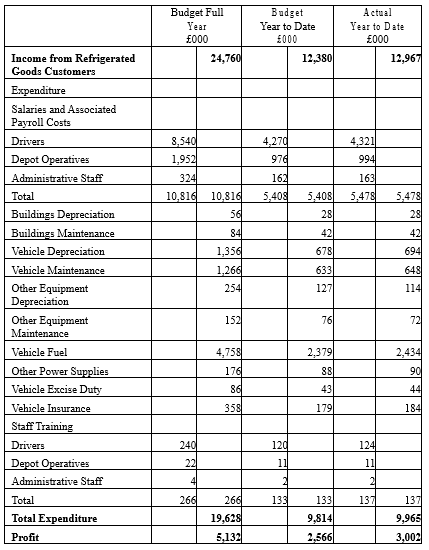
Next Year: Year Ending April 30th 2023
The purpose of next week’s meeting is not to congratulate ourselves on past profits but to plan for the future.
We already have a budget for the rest of this year and monitoring progress against this is an entirely separate exercise and not the purpose of this report, so do not include any budget monitoring information, as we already have that.
We need a realistic budget for income and expenditure, to tell us how much sales income we intend to make and how much we are going to have to spend to earn it. This year is already underway and what we need is a budget for next year. We need this budget to be agreed well in advance, so that we can make the necessary commitments and contractual arrangements for all our planned expenditure.
Please provide a report in advance of the meeting detailing your budget for the year ending April 30th 2023.
The format of the proposed budget is up to you, as is the method by which you arrive at the budget. However, please include the following sections in your report. We do not require an executive summary:
1. Introduction
2. Approach to evaluation of the proposed investment in a new depot
3. Evaluation of the proposed investment in the new depot
4. Approach to drawing up the refrigerated goods department budget
5. Relevant calculations to show that your budget for the year ending April 30th 2023 is realistic
6. Your proposed budget for the year ending April 30th 2023 with complete income and expenditure figures
7. A conclusion on the levels of income and expenditure in your department and on the likely result of building the new depot
8. Recommendations on the new depot proposal, including a recommendation on whether or not to proceed with it, and on the next steps in managing resources in the refrigerated goods department
Please make sure you provide a list of references to any published external material you refer to in your report.
Make sure your report is at least 2,250 words to prove you’ve done some work but I’m not reading it if it’s more than 2,750 words apart from the references. I will not waste time reading appendices. If you have something to say, say it in your report.
Our growing sales income has already enabled the Board to give employment to the Chief Executive’s son and I was frankly astonished to find that he has been assigned to the Finance department. As I am struggling to find any real use for his talents, I will be reading your report carefully for signs that you “need help” with financial matters, in which case I will have no hesitation in sending young Tony to “help” you on a daily basis.
Best Wishes,
Iain
“Until a man dies, wait and until then never call him happy but only fortunate.”
Herodotus
This email contains confidential information relating to Clark Casc Logistics plc. If you are not the intended recipient delete this email immediately.
Further information
As manager of the refrigerated goods division you are responsible for sales income from the transport of refrigerated goods.
Note that the figures above are for six months. You are required to provide a budget for a full year and not for six months only.
You are responsible for pricing and negotiating each contract. You have complete discretion over pricing and all refrigerated goods contracts must be signed by you or somebody authorised by you. You usually start by offering a price based on £0.22 per tonne per kilometre. However, if a prospective client has asked for sealed bids in a competitive bidding process you submit a bid priced at £0.19 per tonne per kilometre, which is approximately the average price you are able to negotiate with customers.
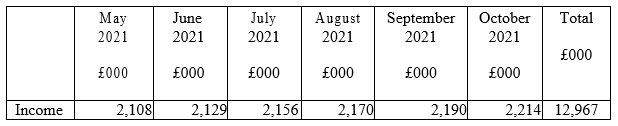
The sales income generated by your department over the past six months has been as
As manager of the refrigerated goods division, you are responsible for the following costs:
Salaries and Associated Payroll Costs
In addition to the salaries below, Clark Casc is required to pay Employer’s National Insurance Contributions. Employer’s National Insurance Contributions are presently assessed as 13.8% of each employee’s salary, including bonuses but excluding the first £8,840 of the employee’s annual salary.
Clark Casc is also required to pay an additional 0.5% of total salaries, including bonuses, as an apprenticeship levy.
Clark Casc also contributes to an employees’ superannuation scheme. Clark Casc’s contribution is 8.5% of all staff salaries, including bonuses.
All of these costs are part of your budget.
Heavy Goods Vehicle Drivers:
You have 202 drivers earning an average base salary of £35,000 per year. Each driver can presently cover about 125,000 miles per year. Last year, all drivers also qualified for a bonus of 10% of base salary for accident-free driving and there have been no vehicle accidents this year.
Employer’s insurance is handled centrally and is not part of your department’s budget.
Refrigerated Goods Depot Operatives
You have 97 operatives working at you refrigerated goods depot, earning an average salary of £19,000 per year.
Administrative Staff
You have 11 administrative staff in the refrigerated goods department, earning an average salary of £27,000 per year.
Property Plant and Equipment
Vehicles
Your department uses 151 heavy goods vehicles and 16 other vehicles, all of which are owned by Clark Casc. Each vehicle has an estimated useful life of 12 years in the company after which it can be resold for an estimated 10% of its original cost. The average replacement cost of a heavy goods vehicle is presently £120,000 and the average replacement cost of other vehicles is £24,000 per vehicle. You are responsible for the cost of depreciation on these vehicles. Depreciation is to be charged at current replacement cost.
Vehicle Excise Duty
Vehicle Excise Duty varies from vehicle to vehicle but is an average of £560 per vehicle per year for heavy goods vehicles and an average of £220 per vehicle per year for other vehicles.
Vehicle Insurance
Your vehicle insurance costs average £2,400 per vehicle per year for heavy goods vehicles and £400 per vehicle per year for other vehicles.
Other Equipment
You have just completed a major exercise with the finance department to establish what equipment you are using at the refrigerated goods depot and in the office. The annual depreciation cost at current replacement cost for this equipment is £228,000.
Equipment insurance other than vehicle insurance is handled by another department and is not part of your budget responsibilities.
Buildings Depreciation
The depot and office which you occupy have a current replacement cost of £3,500,000 and a useful life of 50 years. The land which they occupy has a current resale value of £600,000 and the scrap value of the building materials is estimated at £100,000 at current prices. You are required to budget for depreciation on the buildings on a straight-line basis.
Buildings Maintenance
Buildings maintenance, including cleaning, is carried out by the in-house Buildings Maintenance Department and recharged to your department. It is a fixed cost and averages £7,000 per month.
Equipment Maintenance
Vehicle Maintenance
Clark Casc’s vehicle maintenance department is under separate management. You are responsible for booking the vehicles in your department in for repairs, routine maintenance and annual testing. You are also responsible for ordering the recovery of any vehicles which have broken down or been involved in accidents. All of these
services are managed by the vehicle maintenance department. There have been no motor vehicle accidents in your department in the last 18 months.
Vehicle maintenance is a semi-variable cost.
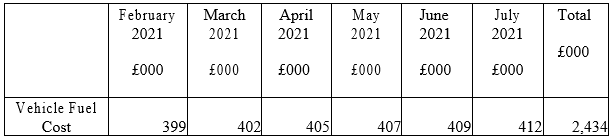
The vehicle maintenance costs charged to your department over the last six months have been as follows:
The sales income generated by your department over the past six months has been as follows:
Other Equipment Maintenance
Depot and office equipment maintenance is a fixed cost and averages £12,000 per month.
Fuel and Power Costs
Vehicle Fuel
Vehicle fuel is a semi-variable cost.
Total vehicle fuel costs for the last six months have been as follows:
Other Power Supplies
Gas and electricity supplies to the depot and office are a fixed cost and average £15,000 per month.
Staff Training
The cost of drivers’ training averages £1,225 per driver per year, including fees for Certificates of Professional Competence.
Depot operatives’ training costs average £225 per operative per year. Administrative staff training costs average £275 per person per year.
Other Costs
There are no other costs in your budget. All other costs, including legal costs, employer’s insurance, public liability insurance and insurance of buildings and non-vehicle equipment, are handled by other departments and you are not responsible for managing them.
Step Fixed Costs
You presently have enough drivers and vehicles to meet demand up to 140 million tonne kilometres per year (£26,600,000 sales income per year at £0.19 per tonne kilometre). To fulfil orders above this level you will need 2 extra drivers and 1 extra heavy goods vehicle for every 1.4 million extra tonne kilometres per year (£266,000 sales income per year at £0.19 per tonne kilometre).
Proposed New Depot
If sales exceed 150 million tonne kilometres per year (£28,500,000 sales income per year at £0.19 per tonne kilometre), your department will need a new depot of the same size and with the same number of depot operatives as the existing depot and you will also need 3 additional administrative staff with salaries of £27,000 per year each. It will take 12 months to build a new depot and bring it into use and Clark Casc will have to pay the builders before it is complete.
You are responsible for deciding whether to make this extra investment in a new depot or not. You are not responsible for deciding on how to finance it. However, you have been told that further investments are required to make a return of at least 9% per annum and that this is to be used as the discount rate in any discounted cash flow calculations.
Additional Information
You are the manager of the refrigerated goods department and you have full access to any additional information required. If more information is required from a published, broadcast or webcast source, you must present that information with a proper reference in the normal referencing format required in the business school. If further information would be required from internal sources at Clark Casc, you must create that information yourself for use in drawing up your report and provide your own indication of internal sources.
You must not present a report which concludes that information is incomplete, or that further information is required or which recommends that further information is obtained. This would be a clear indication that you have not completed your report as required.
Required:
Write your report, addressed to the Managing Director of Clark Casc and containing the following sections, as directed in the Managing Director’s email. Submit your report in the Turnitin dropbox.
1. Introduction
2. Budgeting Approach
3. Relevant Calculations, including any investment appraisal
4. Proposed Income and Expenditure Budget
5. Conclusion
6. Recommendations
7. References
Your report must be between 2,250 and 2,750 words in length excluding references.
Do not include an executive summary.
Appendices are not permitted.
Solution
Introduction
The term forecasting is associated with the aspect of predicting the future expected outcome by analysing the present situation. As we are all know, that being human, it is difficult to watch the future, but on can make an predication about the possibility. The corporate leaders or business leaders, use their skill and the methods, along with the past data for projection of future projected outcome. Forecasting is the systematic approach of examining the future. Forecasting sales in this context refers to the act of producing a prediction about future sales, followed by a careful investigation of data linked to future events and factors that may effect the entire firm. This budget report is drafted based on the past experience, the prevailing situation of business and the expectation of top management. (Ogun Bayo, B. F., Alibaba, C. O., Thala, W. D., & Akinradewo, O. I. (2022).
As a head of the refrigerator department, I believer, that every corporate operates under the Isolated business environment and they are open to influence by the factors associated in the business environment. the smart business tried to take an advantage through continues scanning, reviewing and analysing the operation and non-operation activities surrounding the business. All these activities are essential for continues growth and development of business. Further scanning, analysing, reviewing, planning, controlling and formulating the action plans are some key elements which are widely associated with business. After associating myself with Clark Cask Logistics plc, and after reviewing the work culture in the corporation. I feel that the planning and budgeting is the primary requirement for continues growth of business. Any decision with logical reason, required detail research, as well as this decision required continues observation of business environment. this budget report is drafted based on the experience gain in last year, as well as observing the overall strength of my department and considering that this budget report shall be realistic one. We have seen numbers of opportunities in the competitive business environment, but we sometime wait to check the actual reaction of change in the market.
Approach To Evaluate The Proposal To Invest in New Department
The growth and expansion of any business is the outcome of hardworking, delegation and continues commitment from the all the people associated with the company and the various department. projection about the future inflows and flows are made based on the overall demand for customer as the company market share in the competitive environment. further business is also required to update and up-grade them self, with the change in the business environment and level of competition. The expansion strategy of business can be carried out either by acquiring control over the competitor or by reinvesting the in exiting business by adding funds in exiting operation. Either of the selected option will result into growth of business and which will enhance the capacity of company to serve more and more customers. However, this decision of expansion of operation or the decision to enhance the operating capacity, again suffers from the numbers of drawback, hence it is essential to make proper research, before adding new capital either in exiting operating capacity or to expand the business operation. Here in current case, our management are on the option that we are in position to grow our business, considering these facts we have plan out to adopt some strategic action plan, at each division. It is totally true that we are in position to growth. But as the responsible person of the refrigerator goods department. I personally feel that before finally taking an decision for further, expansion or investment of funds in to the existing operation, we need to wait for another one year. (Nikodijevi?, M. (2021). the proposal of new investment is totally correct, but before finally deciding, or taking a finical conclusive decision. We are supposing consider the growth rate in sales of industry as whole as well as the growth of sales of our department from one year or another year. based on the growth in sales of during first 6 months, it can be projected that the refrigerator department will continues to grow at the stable rate, however as the industry is growing and our top executive also feel that we have a opportunities to expand, then in such a situation we can project that refrigerator department can grow at the rate of 10 % in total sales, this growth rate Is seem realistic, and if we consider this growth rate, then the budged sales will be nearly to £27000000, this situation does not permit use to make an further investment in new plan, rather we can go with the option of adding some more resources, which can help our operation to work smoothly and deliver the product and services with high quality standard. Here we can adopt the approach of being aggressive but with suitable Calculation. Here we will adopt the approach of adding new resources and expanding the operation in next one or two years. Further even if we take a decision for further investment in this department, it will start operating after a year.
This decision shall not be limited with the final conclusion to avoid investment in department in order to expand the operation strategy. As we are in middle of year, we are can wait for next 6 month in order to oversee the actual performance of industry as whole, the competitor position and the reaction of our customers. The new investment decision will result into the high outflow of cash. this decision required to consider the opportunity cost with this investment planning. Hence it is best suitable for wait for some time let say 6 months, and then after again the meeting shall be called to take a decision to start new operation division.
Evaluation of Proposed Investment in New Department
Starting the new department is always indicate that business is growing and creating new opportunities, but it is not means that we shall make an investment to start a new division, without being considering the negative phase of propose investment option. If the top management feel that it will be best suitable to make an investment in new division, then we need to consider the fact about the possible operating outflow, and expected inflow. Here we need to compare the proposal with the inflow and outflow. Cost benefit analysis is always advisable to consider. Here, the major investment is the capital investment, and I believer that out company is in sound position to make such investment. This addition division strategy will be suitable when it gives the high in sales by more than 25 % as again the current level of sales. In addition to that if the new department is in position to grow the net earnings by more than 12 % than again this investment option is best suitable, as here we believe that the nominal rate of return is nearly 7 %, which again indicate the risk-free return. Hence it is essential to consider that the new investment plan in department will contribute in net profitability of not less than 9 %. The second condition which as the superior authority at the department, I also think that the new department must be in position to give some additional benefits to the society at large as well as to the current and prospective customers. The further investment in new department also required supportive level of sales, which are nor less then £28,500,000, if we are fail to get this level of sales, than it become hard for our department to justify that our suggestion was correct, and we are in position to use the invested resources in productive ways. the new investment in department required, new deport with the same size, nearly 97 new of operators, whose average salaries are nearly to the existing staff, £19,000 per year. additional 3 administrative staff, whose expected salary are not less than £27,000 per year for each employee. Further this proposal will take nearly 1 year to build the new deport in order to bring into the usage and it is essential that our company shall allocate the space and allocate the work to the builder before it is complete. This outflow will not end here with as we are planning to enhance the operating capacity the additional investment in vehicles, driver, training to new staff, etc are some associated with the outflow and they will surly incurred. The new division will result into continues outflow for the fixed as well as operating expense, the expected sales level may not be in position to justify these expenses, however if we believe that out division will grow at the average rate, that is nearly 10%, then we are position to justify the expected outflow with the sales and profitability along with the return on investment.
Relevant Calculation To Associated with Budget
Instead of investing in new division, at this level we are can consider this option as the next level, and present we shall make certain amount of investment activities to enhance out ability to serve the customer. Our team believe that during the year ended 2023; we are in position to achieve the sales at the growth rate of 10% by taking the based budgeted sales of 2022. This sales required one additional vehicle, two additional driver. (Nikodijevi?, M. (2021).
This additional injection of new workforce will result in to additional outflow in driver salary. Additional outflow to Purchase new vehicle and additional cost of new vehicle for maintenance, fuel, vehicle excise duty, training expenses for the driver.
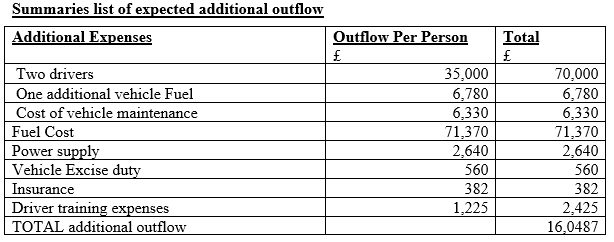
The above stated table shows the additional outflow one account of reaching our sales in excess of expected level. Here this expenses or additional investment can be justified by the level of sales we can achieve, the growth in the sales by nearly 10 % is suitable considering the fact about the overall growth of industry as well as again the inflection found in the market. Additional of two driver and one vehicle will enhance the strength of department and we are in position to boot our sales and improve the overall services in order to maintain the customer based as well as to maintain the strength of our department.
Computation of budgeted statement showing income and expenditure for the year ended on April 30th 2033
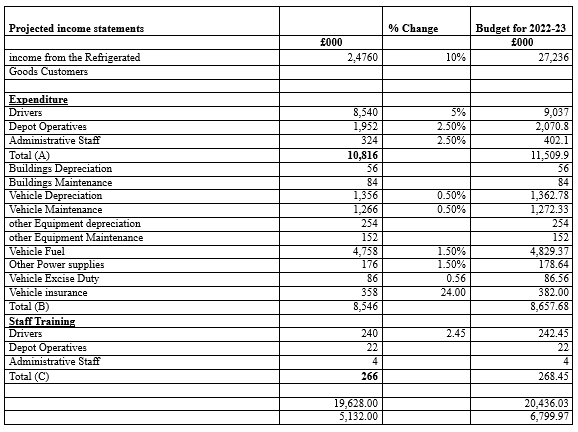
Conclusion on income and expenditure over the refrigerator goods department
The above stated calculation shows the budgeted inflow and outflow based on the income year of 2021-22. Here major focus is given toward the overall growth in expenses and the income, further a change for the year ended 2023 as again 2022, is reflected in form of percentage (Hartanto, 2018). This can make the statement user-friendly for every interested stakeholder of this department. the drafted budget report shows the growth in sales by 10 %, along with minor to major change in the operating expenses, however we have assumed that there isn’t any addition of new building, hence the cost associated with building maintenance and depreciation will be same as it was in the previous year. major change is found in the area which are variable in nature and such expenses will continues to be change due to change in overall price, tax rate, and others expenses which are not in the control. Further the above budgeted report also excludes the employee insurance contribution, bounds to the employees and other benefits which employees are eligible to receive, these benefits and the outflow for the company are in addition to above stated projection, the average percentage of this additional expense will be 5 % of sales. The above stated budget shows the comparative data of two year, here we can see the change in all major expenses, except those which are fixed in nature, such as the non-cash expenses.
Recommendation for New Deport Proposal.
After going through the above stated discussion, and after analysing the possible benefits and the drawback of adopting and investment option of new department., we are on conclusion that instead of investment this major amount to expand operation, we need to wait for next 6 month or till the end of current financial year, at the year end we are in position to know the growth of industry and overall demand of our product and services. If there is a unexpected growth in sales for next 6 months then we should plan to make additional investment, and if we are not in position to observe the expected level of growth in sales and revenue than we shall drop an plan for new deport proposal.
References
Ogun Bayo, B. F., Alibaba, C. O., Thala, W. D., & Akinradewo, O. I. (2022). Assessing maintenance budget elements for building maintenance management in Nigerian built environment: a Delphi study. Built Environment Project and Asset Management. https://doi.org/10.1108/BEPAM-06-2021-0080
Nasri, H., Nurman, N., Azwirman, A., Zainal, Z., & Riauan, I. (2022). Implementation of collaboration planning and budget performance information for special allocation fund in budget planning in the regional development planning agency of Rokan Hilir regency. International Journal of Health Sciences (IJHS) Ecuador, 6(S4), 639-651. https://doi.org/10.53730/ijhs.v6nS4.5597
Nikodijevi?, M. (2021). Implications and challenges of using driver-based budgeting in contemporary business environment. Trendovi u poslovanju, 1(17), 49-57. https://scindeks-clanci.ceon.rs/data/pdf/2334-816X/2021/2334-816X2101049N.pdf
Hartanto M. R. (2018). Implementation of Performance-Based Budgeting: A Phenomenological Study on National Land Agency. International Journal of Scientific Research and Management. Vol. 6 No. 02 (2018). https://ijsrm.in/index.php/ijsrm/article/view/1277
Moses, M. (2022). Inside the Crisis of Municipal Budgeting. In The Municipal Financial Crisis (pp. 27-52). Palgrave Macmillan, Cham. https://doi.org/10.1007/978-3-030-87836-8_1
MAN605 Financial Analysis and Decision Making Assignment Sample
Weighting: 25%
Word Limit: 1,200 words
Due date: Week 10 Sunday 11:59 pm
Please select one (1) out of the following three (3) organisations to base your report on.
? Delaware North Companies Australia Pty Ltd
? Retail Zoo Holdings Pty Ltd
? Oaks Hotels & Resorts Limited
Your manager has been asked to prepare a report for the Board of Directors on the financial health of the business and needs your help.
Use IBISWorld to locate the company report and conduct research online to understand the company’s:
? Company information – background, vision
? Strategy and direction
? Financial performance based on their ratios
? Performance compared to industry average and competitor performance
You may not have all the information to complete a full analysis so you will need to include in your report any additional information you need and why – your manager is expecting this.
Your manager hopes that your analysis will show that the business is healthy and therefore that she is performing well in her role.
Required
Prepare a report for your manager, in a short report format, that assesses the financial health of the organisation. Your report must include the following:
? your assessment of the financial health of the organisation for at least the past 3 years.
This would include an explanation of the ratios or other data you are using to support your analysis.
? any additional information that you need to complete your analysis.
? an explanation of at least 3 (but not limited to) recommendations that your manager can take to the Board of Directors that are related to the strategic focus of the business.
You may refer to the lecture and tutorial notes and activities to help you organise your analysis.
Getting started: You can also use the following questions to guide your analysis for assignment help -
Profitability
How has the business performed?
Is the business generating a satisfactory return?
Efficiency
Are debts being collected? How long does it take?
Is the inventory turning over efficiently? Are inventory holdings increasing or decreasing?
What are the implications for cash flow?
Are the assets working hard?
Liquidity
Can the business pay its bills?
Are they collecting their debtors efficiently?
Do they have a lot of creditors?
What are the inventory holdings?
Solvency
Can the business repay its long term loans?
Can the business pay its interest?
What is the balance of equity to debt?
Other suggested areas to research include: current interest rates, supply and demand, market trends. You can even complete a short PESTLE analysis however it is not required for this assessment.
Solution
1: Introduction
This report shall discuss the essential aspects relevant for the financial analysis and decision-making skills on a long-term prospect. In order to evaluate the financial analysis and decision making, the company selected is Delaware North Companies Pty Ltd. (DNCPL), while a detailed discussion on company background, vision and information shall also be discussed. Analysis and calculation of financial ratios shall also be conducted in this report to outline the stability of the company’s performance as compared to industry benchmarks and competitors’ performance.
2: Company Background, Vision and Information
DNCPL is considered to be a strong industry player who is engaged in the retail and hospitality sector over a span of three decades. The background is further energised by strong financial performances, where the company was able to generate revenues worth $281,986,000 (my-ibisworld-com, 2022). The vision and information statement of the company further suggests a steep inclination to keep progressing and growing in the field of hospitality services.
3: Strategy and Direction
The major strategies and direction of the company are considered to be mostly based with meeting financial and nonfinancial objectives. Hence, a cohesive direction is being employed by the concerned loggerhead of the company to ensure through meeting of goals and objectives prescribed by the company. As per explanations and illustrations of Xu, Sheng & Tian (2020), a unified direction is needed to be emphasised where teamwork and proper management should be initiated for ensuring financial and nonfinancial growth of an organisation.
4: Financial Performance
4.1: Calculation of Ratios
The calculation of ratios for DNCPL shall be substantiated by considering the relevant figures during 2020, 2019 and 2018 respectively.
4.1.1: “Profitability Ratios”
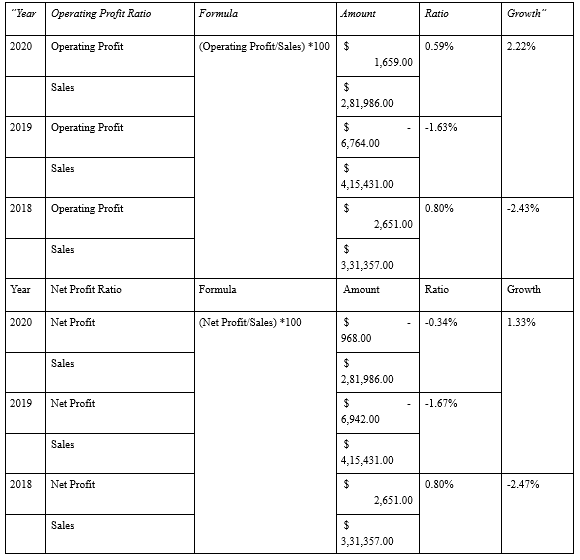

Table 1: Profitability Ratios
4.1.2: “Liquidity Ratios”
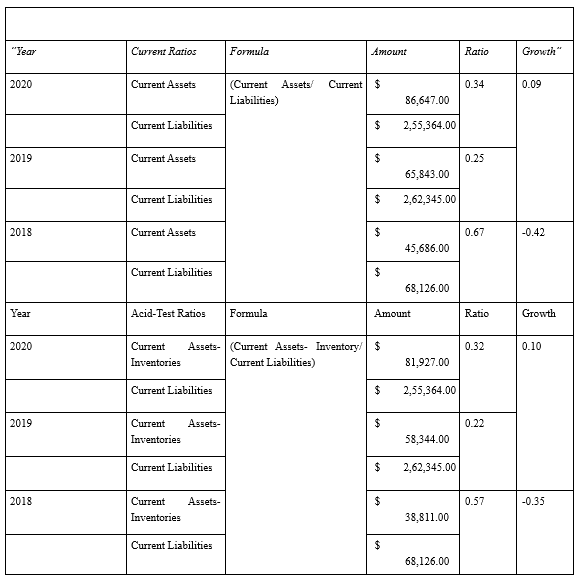
Table 2: Liquidity Ratios
The above table of liquidity ratios further suggests marginal improvement in current and quick ratios in 2020 as compared to 2019. The overall growth in 2020 as compared to 2019 is considered to be 0.09.
4.1.3: “Solvency Ratios”
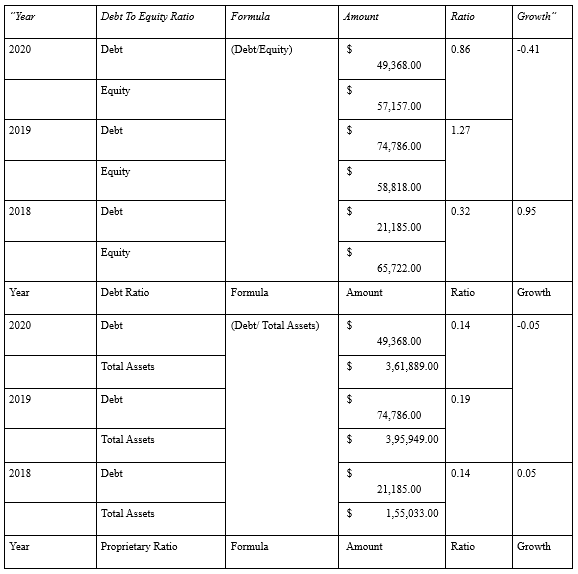
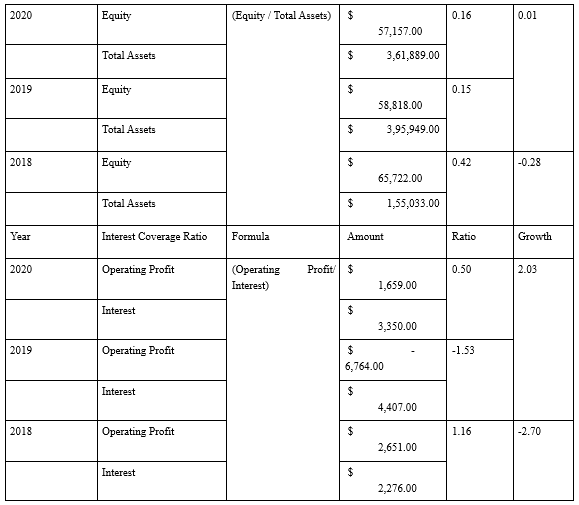
Table 3: Solvency Ratios
The above table of solvency ratios further reads to better performance in 2020 as compared to 2019 and 2018.
4.1.4: Efficiency Ratios
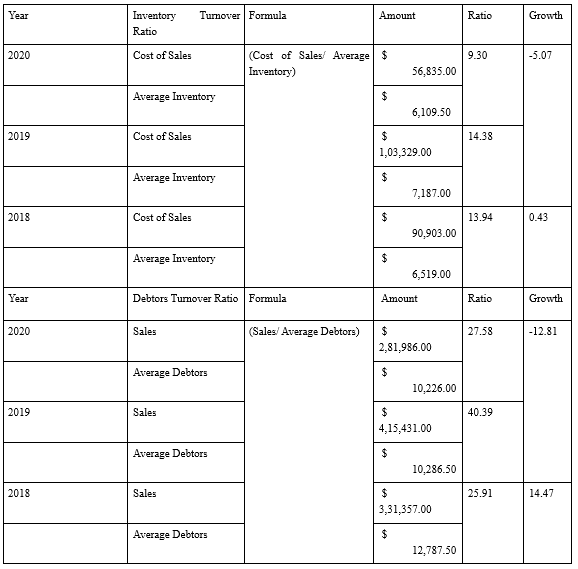
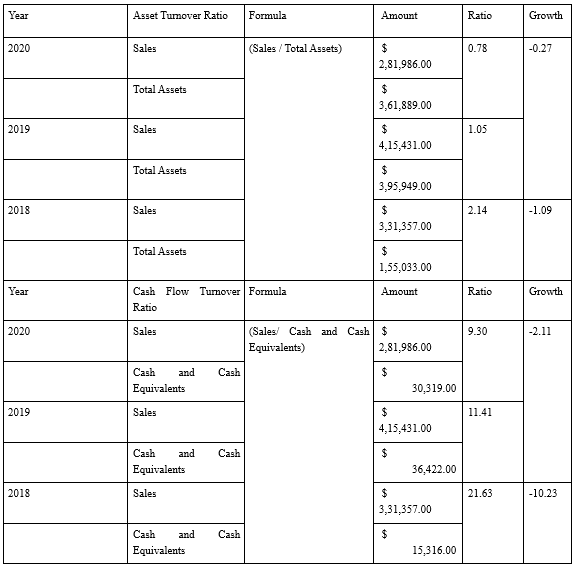
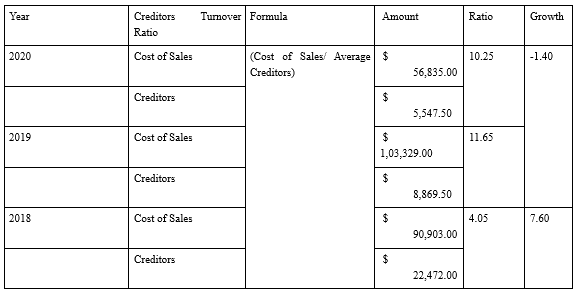
Table 4: Efficiency Ratios
As per the above table of efficiency ratios, it can be ascertained that the ratio metrics has decreased substantially in 2020 as compared to 2019 and 2018.
5: Analysis of Performance
Profitability Analysis
The profitability ratios suggest that a marginal increase in performance is being witnessed in 2020 as compared to 2019. The business performance in 2020 is considered to be adversely positioned owing to net loss of $ -968.00.
Yes, the business has generated a sufficient return for the years. Based on the estimation, it has shows a growth in 2020 return value. Hence, it can be determined that the company is failing to generate a satisfactory return [Refer Table 1].
Efficiency Analysis
The debtors and inventory turnover ratios are valued as 27.58 and 9.30, thereby depicting decent readings for debt collection and low reading for inventory holding. Thus, debt collection is facilitated after a span of nearly 13 days, while inventory is being held for approximately 40-41 days.
The inventory turnover value is mainly suggested as 9.30 times for the firm. Inventory is turning over efficiently as it is matched the aggregate value. Furthermore, it has found turnover value was increased from 2018 to 2019. It has dropped 2020 that has indicated as 9.30 as per the value.
Therefore, it can be ascertained that inventory holding is decreasing in 2020, while cash flow implications suggest adverse readings of 9.30 times in 2020 as compared to 11.41 times in 2019.
It can be considered that assets are not working as per their achievable capacity. The asset turnover ratio is mainly suggested a value of 0.78 that has evaluated a lower utilisation of asset. It is required to increase the asset value based on the liability provided. [Refer Table 4].
Liquidity Analysis
The liquidity analysis suggests that the company does not possess relevant financial credentials to pay bills, while debts are being collected in an inefficient manner. The identification of 0.34 is lower than ideal value that suggested a lower ability to pay its bills.
The identification of debtors, it has found that DNCPL is collecting its debt random that has increased the liability value. It has effected on total value of liquidity.
However, the creditor valuation is considerably lower in 2020 along with inventory holding valuations. Limited holding og creditor has been indentified in this case.
As per illustrations and explanations of Plesca (2018), the stipulated industry benchmark of current and quick ratios is considered to be 2:1 and 1:1 respectively [Refer Table 2].
Solvency Analysis
As per the solvency ratios, it can be ascertained that DNCPL has the ability to repay its long-term loans owing to lower proportion of debt as compared to equity, which determines a balance of 0.86:1 as the ratio.
The interest coverage ratio, however is deemed to be negatively positioned owing to lesser operating profit and higher interest expenses in 2020
The calculations indicates that the balance of equity to debt 0.86 in 2020. Previous year, the balance has indicated as 1.27 in 2019 that was lower in 2018 (i.e. 0.32).
[Refer Table 3].
6: Conclusion and Recommendations
6.1: Conclusion
This report has discussed the important aspects of the financial reporting and decision making with respect to the selected company DNCPL, where the ratio metrics are considered to be adversely positioned in comparison to industry benchmarks and its competitor. The vision and mission strategy of the company is considered to ensure harmonious progression of business across Australia and overseas countries including New Zealand.
6.2: Recommendation
In order to excel with regards to financial credibility and stability following recommendations are being proposed.
• It is recommended to ensure optimisation of financial and non-financial resources.
• It is recommended to identify additional sources of revenue generation.
• It is recommended to enable a streamlined organisational structure for ensuring higher profitability prospects.
References
My-ibisworld-com, 2022, Revenues [online], Retrieved from: https://my-ibisworld-com.ezproxy.angliss.edu.au/au/en/company-reports/5376/company-details [Retrieved on: 07th October, 2022]
Plesca, A., 2018. Temperature distribution of HBC fuses with asymmetric electric current ratios through fuselinks. Energies, 11(8), p.1990. https://doi.org/10.3390/en11081990
Xu, S., Sheng, C., & Tian, C. (2020). Changing soil carbon: influencing factors, sequestration strategy and research direction. Carbon balance and management, 15(1), 1-9. https://doi.org/10.1186/s13021-020-0137-5
FIN2SEV Investment Securities Assignment Sample
Assessment Brief
Guidelines:
You are to prepare a written research report on Cochlear Ltd (COH).
The report must:
• be no longer than 10 pages (not including the front over and contents page, if any). You may also include an appendix no longer than 10 pages. There is no minimum font size because that will depend on the font, but if the font size is too small you may lose marks
• be your team’s original work.
• be properly cited when applicable.
• include in the first page’s header the following information:
• Company name
• Ticker symbol, and exchange
• Sector/industry
• Current price (as of .......date)
• Recommendation (Buy/Hold/Sell)
• Target Price
Suggested structure for the report (you may also add additional headings if necessary):
• Investment Summary
• Business description
• Industry analysis and competitive positioning
• Financial analysis
• Valuation
• Investment risks
Investment summary
This section should include a brief description of the company, projected earnings estimates, valuation summary and the rationale for the recommended investment action.
There should be a clear and succinct explanation as to why the security should be bought, sold, or holds.
Business description - This section should detail the company’s products and markets. It should also provide a clear understanding of the company’s operations and its key drivers of revenues and expenses.
Industry analysis and competitive positioning - This section should include a competitive analysis of the industry. Key economic drivers, external factors and competitive forces should be addressed when relevant.
This section should also provide a group of peers operating in the same industry for the purpose of competitive analysis. Some insights regarding company’s competitive positioning should be included in this section.
Financial analysis - This section should include a thorough analysis of the company’s historical financial performance, and a forecast of future performance. The assumptions for forecasted figures should be clearly explained and strongly supported.
Valuation - This section should include a detailed valuation analysis using appropriate model and application. Absolute valuation (Discounted Dividend Model, Free Cash Flow Model or Residual Income Model) can be used in combination with Relative Valuation (P/E ratio, EV/EBITDA, etc.) as a way to check the validity of the final output.
Investment risks - This section should address potential adverse events that may affect industry’s and company’s performance. Risks can stem from operations or external factors such as regulation or environment.
Solution
Investment summary
Cochlear Limited delivers and manufactures cochlear implants to approximately more than twenty countries throughout Middle East, Africa, America, Asia Pacific, and Europe. The company provides three primary products that are Cochlear accessories that are wireless, implants of Baha bone conduction, and cochlear implants (Cochlear Ltd 2020).
Valuation date: 06/05/2022
Ticker: COH
Sector: Biotechnology
Stock exchange: ASX
Headquarters: Melbourne
Current price $190.22
Target price $222.27
Recommendation: BUY
Cochlear has established its products and surgeries after immense R&D and the current valuation of the share stands at $190.22 per share. However, with the optimized balance sheet and performance the recommended rating is $222.27. This is due to the fact that balance sheet is intact and total assets are sufficient to honour the liabilities. There is no shortage of cash and the company will not face any shortage of resources. The profit scenario of the company changed in 2020 followed by the aggregate investment of the company that increased at a positive rate from 2014-2020 signifying the company is vouching towards capturing of more market share. Thereby, a BUY recommendation has been allotted for Cochlear Ltd.
This recommendation is significantly driven for assignment help
Business description
Marketing situated at NSW (Macquarie University), the company every year expends around $180 million towards research and development initiatives. Apart from this, they are also indulged in around hundred collaborative segments. Further, the company is regarded as an international leader in ear implantations, and selling products in more than hundred nations and pursing offices throughout the globe with the usage of just 4000 employees (Cochlear Ltd 2020). The product is supplied to more than 100 countries. Over the past ten years growth has been significantly effective owing to enhanced awareness by people of older people who are basically the target audience, because they are likely to be encountering hearing loss. The company is trying hard to focus towards markets that are undeveloped.
Business summary
.png)
(Cochlear 2020)
This aforesaid chart highlights how cochlear firmly believe that they can continuously develop through penetration of increased nature of such underdeveloped markets especially children. Additionally, attempt to raise extra awareness in older markets of seniors, the company is focusing to look further into such markets providing sigfiying markets and develop as they only pursue a penetration of three percent. Grow share of markets towards children that have a present penetration of sixty percent and children emerging markets only pursue a penetration rate of ten percent.
With respect to Cochlear products, the company continues to bring newer products owing to its huge investments towards research and development every year. Moreover, this permits the company for going ahead of the curve whilst designing innovative items for consumers and attracting new consumers. Since, the company was first listed in the year 1996, around 1.9 billion has already been invested towards research and development and the same has been increased more than 10% from the financial year 2018-2020 (Cochlear 2020). The primary products of the company and around 88% of their revenues are the implants of cochlear and the remaining 12% of their revenues are from the acoustic implants.
Key drivers of Revenue
With respect to growth and revenues, the company has significantly increased its revenue up by seven percent sales every year with sales revenue of just 1.4 billion. Owing to their enhancing consumer base every year, the revenue from sales from servicing their items is enhancing. Moving up twenty percent betwixt financial year 2018 and financial year 2019, this is forecasted to keep enhancing due to their focus on additional penetration in the market. For the financial year 2020, the company provided a reported net profit of $290 million that is a nine to thirteen percent increment of underlying profits for financial year 2019 mainly due to growth and expansion of freshly released items at the end of financial year 2019. Moreover, capital expenditure is anticipated to enhance up to 180 million, including the regular establishment of the facility of China, bigger Denver office together with investments towards platforms in Information Technology to strengthen digital, connected health, and cyber security abilities (Cochlear 2020). Additionally, capital expenses are forecasted to decline by around million dollars in the financial year 2021. Targeting China appears as the primary goal of their relative population for other international powerhouse nations being targeted.
In relation to risk, the company presently attains supplies for its goods from third parties. Due to the influence of Covid-19 throughout the world, this has resulted in few suppliers closing and resulting in a significant influence of not being capable of pursuing crucial materials required for the goods. This is an issue as the company states that few materials that are only prevalent from particular sources and hence, are not substitutable in nature. Cochlear also comprises of five manufacturing abilities internationally and if any material disturbance to one of them, it would result deterioration of supply of goods to that particular locality as it is problematic to establish new plants. Further, there is a major risk in the segment of medical that a third party shall produce innovative item that can overpower coming to the overall market hence leading to the loss of market share (Yahoo finance 2021).
Marketing Strategy
When it comes to market analysis, the cochlear implant market is anticipated to enhance by 10.5% every year until 2026. The growth is linked with favourable scenarios of reimbursement, enhanced adoption of implants, and increasing awareness about hearing aids (Cohlear 2020). Recently, unilateral instruments have influenced the market but due to the enhanced knowledge and prevalence of markets for hearing, there is expected to be a transition towards devices of bilateral nature because there are most cost-effective when implanted in children and has the capability to enhance performance on a whole.
.png)
(Cochlear Ltd 2020)
Industry Analysis & Competitive positioning
In relation to competitive positioning and industry evaluation, the company is leading the market of health care and equipment. This can be proved by the fact that the international cochlear size of implant market reported at 1.5 billion USD in the year 2020 and is expected to rise at a CAGR of approximately 10.5% with due course of time. The top rivals of Cochlear Ltd include Pentax medical, Hearing Life, and Australian hearing. Revenue wise, the company has been outperforming its rivals with expected annual revenue of $1 billion in comparison to other players (Cochlear Ltd 2020). Further, entry restrictions in this industry are regarded maximum because there are various companies with same solutions and objectives like that of Cochlear (Yahoo finance 2021). However, as mentioned before, the company was founded in 1967 and have been significantly outperforming the rivals since then. Besides, the company is also listed on the Australian Stock Exchange that allows it to gain a strong base of consumers, which the other players like Hearing Life do not possess.
When it comes to external factors, these are such factors which influence the performance of business. Such factors comprise of government, technology, foreign, social, and demographic (Cazier et al 2015). However, not every external factor may influence the business and in various scenarios, few may impact the business more than the others. Technology is Cochlear’s largest external factor because as it is performing efficiently owing to its innovative new items, which have been introduced and developed since, the company was introduced in the year 1967. Nonetheless, the accessibility of the company’s items and traits are far more innovative than other companies (Cochlear Ltd 2020). Another external factor is the company’s demographic that is targeted towards any individual having a hearing issue. This implies that old people, children and other people with damaged hearing owing to an accident has been targeted in their demographic. Even though the company has been founded in Australia, it has been leading in other nations as well. In a recent survey, Europe was held accountable as the largest share of all other nations in the year 2018. The reason behind this was high number of implants, population, and instrumental medical techniques.
Social external factors comprise of what lifestyle variations may emerge in the upcoming years. In the present scenario companies are struggling to survive the market due to pandemic and people are not ready to obtain any implant. Such a scenario is a major hurdle to the company and this has led to the drop in sales and the price of stock. Moreover, pandemic has snatched people of their jobs which imply that people cannot afford to pay for this implant that is expensive and this allows them to switch to regular hearing aids temporarily. In addition to these, the company has another major issue in their books and that is how to depict to consumers the amount of sanitization and cleaning that is being done at many centres (Cochlear Ltd 2020). A change in lifestyle has been seen during the time of pandemic where people are cautious and resort to hygiene to curb the spread of pandemic.
In order to tackle such shift in lifestyle, the company has been accommodating for every consumer by putting more people in consumer services, thereby allowing them to be present to any consumer with questions, queries, or any other issues. This can even be related with the laws of government. New laws in terms of social distancing are introduced which has been introduced internationally and almost every nation is distinct with their rules and regulations (Cochlear Ltd 2020).
Bargaining power of suppliers
The company ensures reduced capacity through the process of enhanced operations. Moreover, the overall cost from the supplier enhanced. The substitutes are negligible that enhance the strong bargaining power of supplier. The operations of the company is highly influenced by the bargaining power of the supplier that is in link to materials, labour and energy cost.
Bargaining Power of Buyers
The buyer’s power of the company is moderate to low as the company is in a position to sustain any price increment due to the high demand and limited supply of the market natural resources. Moreover, the availability of lower substitutes leads to reduction of the buyer’s bargaining power
New entry of threat
The entry of new threat remains relatively low because of deficit of natural resources and limited capacity of resources when it comes to global market (Deegan 2016) Moreover, it contains higher infrastructure and latest technology thereby the threat from the new entrant is less. Since the availability of the substitutes are lower and Cochlear has a diversified portfolio, the substitute threat is encountered easily. The rivalry is high between the competing sellers and the natural resource companies are into cut throat competition for access to the natural resources
The operations of the company are even affected by the following:
Financial evaluation
Cochlear has reported a loss of -1.9 from 2015 to the year 2020 ($238.3m) and it has recorded an increasing profit that is ten time in the year 2020 when compared to 2016. This development depicts that the company will be profitable with due course of time and can be utilized in forecasting and other plans associated with its affairs. The second measure utilized is average equity that is computed by adding ownership of two scenarios and dividing the value by two.
The aggregate investment of the company has been increasing at a positive rate from 2014-2020 (Baristow 2020). Such increase can be a direct result of the company providing more equity shares to finance its affairs. Further, an additional enhancement in aggregate equity shares depict that the company has been attaining profits, thereby attracting the investors to invest more (Pucheta-Martiinez & Garcia-Meca 2019). This surge in aggregate equity depicts the investors’ forecasting of maximum income in future and higher dividends as a direct outcome. Another technique utilized is the return on equity, and return on investment that also witnessed a positive movement from 2016 to 2018. This is a signal that the company is attaining profits and will do more in the future.
Average assets of the company also witnessed an increment from 2014-2020 and such depiction shows that the company made a profit, and investors were keen on investing in more shares. The other technique utilized is the return on assets wherein the company reported an increasing return on assets from 2016-2020, which indicates that the company was utilizing its assets to generate additional income.
.png)
(Cochlear 2020)
Valuation
• Valuation of share using Dividend Discount Model
Calculation of value of equity by Dividend discount method in which we calculate we calculated value of share price as per Capital Asset Pricing Model(CAPM)
Value of equity share of BHP = Expected Dividend per share
Required rate of return- Growth
Going by the Capital Asset Pricing Model,
Rate of Return (expected)= Re
Risk-free rate of Return= Rf
Market Return= Rm
Beta= B
Expected Rate of Return (Re) = Risk-Free rate of return + (Market rate of return- Risk-free rate of Return) * Beta
Therefore, Re= Rf + (Rm-Rf) * B
a) Obtaining an estimation of Risk-free rate of return
risk-free interest Rate projected at 2.5% in year 2021
For DDM we have Rf at 2.5%
Step 2: Computation of Market rate of Return and market risk premium
.png)
Avg return in last 6 years = 11.94+18.73-8.95+25.51+6.99
5
=54.22/5=10.84%
(Rm)=10.84%
Market Risk premium= Rm-Rf
= 10.84%-2.5%
= 8.34%
Step 3: Beta
Beta of Cochlear= 0.92 (NYSE)
Step 4: calculation of Required rate of return
(Re)= Rf + Market risk premium *Beta
= 2.5 + 8.34 * 0.92
= 10.18%
Step 5: Computation of Intrinsic Value
Calculation of growth
Dividend in year 2020= $1.75 Dividend paid in 2021= $1.40.
assumption of Growth rate 6%
Dividend for next year= Dividend for current year * growth
Dividend for current year= USD 1.40
Dividend next year= 1.56*1.40
= 2.18
Intrinsic Value of share of Cochlear Ltd = Expected Dividend for next year
Required rate of return-Growth
=2.18
10.18%-1.40%
Intrinsic Value of share of Cochlear Company USD 0.24
• Valuation of equity share by Price to Earnings method
Cochlear is listed in the NYSE hence the closing price is undertaken that is $ 228.97 per share dated 6 May 2022
The EPS (basic) of $ 1.29 per share has been derived from the annual report of the company
Therefore, the value of Equity share is:
Value of share as per Price to Earning method= Market price per share = $228.97
Earnings per share= 1.29
Equity value per share = $ 177 per share
Value of Equity by both method comparisons
On the application of both these method, the valuation is different because of the assumption used in the valuation process. Both these valuation method is used but DDM mechanism is used because the company is paying the dividend to shareholder and PE method is used because the company earns profit (Anton 2015)
Cochlear PEER analysis
.png)
The competitors of Cochlear all around the world are compared. It is seen that market capitalization of Smith & Nehew plc remains the highest and a beta of less than 1. On the other hand the second best competitor is Cochlear with market capitalization of $9404 million and a beta of 0.92. With a beta of 0.92 it is more responsive to the market as compared to its peer (Morecroft 2015)..
Investment risk
With respect to operational risks, the company did not expend any dividend to its investors. However, the issue of not paying the bonus is that the investors must see value in their investments, and in this scenario, investors will more likely not invest. Such risk is called the risk of dividend payment.
As per Carlon (2019), market risks are the risks that are related with the factors influencing the market. First is the equity risk wherein the company is not able to perform and the prices of shares decline. The other market risk is the risk of interest rate. If Cochlear opts for investment in the alternate investment channel when the rate of interest is less, the company will lose resources. Lastly, currency risk is also related to the exchange rates. For instance, the company invests in various treasury bonds that are provided by the government of UK (Baristow 2020). Hence, if the value of pound shall increase, the bonds market value shall decline and vice-versa.
Liquidity risk is another risk that arises due to the incapability to sell investments at market prevailing rates in order to realize the initial expenses (Davydov 2016). Hence, when the company shall purchase bonds and when the offer for sale is lesser than the invested price, there arises the emergence of liquidity risk.
Credit risk is that risk wherein a government or firm issuing bonds will be incapable of paying interest or principal after their maturity (Ang & Weaver 2010). Hence, the company must focus while investing in bonds because some of them pursue high credit risk in comparison to others.
Concentration risk is the risk related to investment in one type of investment (Sherman 2015). Therefore, Cochlear must try to diversify its investment in various ways in order to prevent the failure associated to one stake. Besides, the company can also invest in both financial and commodity markets.
Foreign investment risk is the risk related to investment in varied geographical areas. Hence, the company must focus on economies that have stable rules and regulations so that risks are decreased on a whole (Laux 2014).
Inflation risk is directly related with the buying power of a currency and the company must try to invest in government bonds wherein inflation remains stable. Moreover, in the case of investment in economies with high rise in prices, it can result in losses to the company.
Overall, the analytic measures or strategies utilized are average equity, profitability ratio, current rate, return on assets, return on equity, debt to equity ratio, and sales evaluation. Further, investment risks like market risk, operation risk, foreign investment risks, credit risks, concentration risk, and inflation risk plays a key role in the generation of issues or dangers that are encountered by Cochlear Ltd.
References
.png)
HI5002 Finance for Business Assignment Sample
Assignment Brief
Word limit 3,000 words ± 500
Due Date Final Submission of Group Assignment: Week 10
ASSIGNMENT SPECIFICATIONS
I. Assignment Tasks
This assignment task is written reports that include 3 parts:
Part 1: Reflective journal of one assigned topic among 9 first topics of the course.
Part 2: Fact finding of securities market in Australia.
Part 3: Capital Budgeting and Project Evaluation.
II. Contribution of group members
Each group needs to ensure that members are equally contribute in group work (10% each for a four-member group). Non-responding and non-contributing members need to be reported by groups to Unit Coordinator for removal from the groups before week 10.
Percentage of contribution and tasks (for example: Part 1. Question 1 and 2) done by each group member must be agreed by all group members and specified clearly in the table of Information for HI5002 Group Assignment
III. Assignment structure and questions
The assignment should cover the structure and contents described below.
Introduction
A brief introduction of your group’s work: the purpose of assignment, key findings and structure of the assignment (not more than 150 words)
Part 1. Reflective journal of a selected topic among 9 first topics of the course (13 marks)
Your group is required to write a reflective journal of what you had learnt in a tutorial session that covers one assigned topic among 9 first topics of HI5002 course. Once your groups are formed on Black Board, you need to contact HI5002 Unit Coordinator to get the topic assigned to your groups.
The following requirements must be met for this Reflective Journal to be marked:
1) Correct name of the assigned topic as per syllabus, lectures and tutorials must be provided
2) Correct time, date and name of the lecturer who delivered the tutorial session should be provided.
3) Evidence of your discussion with HI5002 Unit Coordinator on the assigned topic for Part 1. Reflective Journal: screen shots of email exchanges submitted in an appendix to your assignment.
To complete the reflective journal, answer the following reflective questions:
Reflective questions:
Question 1: What are the financial concepts you have learnt in the session? Briefly explain the concepts? (please note that only list the financial concepts discussed in the interactive tutorial session, not all the financial concepts discussed in the recorded lecture) (3 marks)
Question 2: What are the important issues your lecturer reminded you to note down and pay your special attention to regarding the financial concepts/formulas/calculations/skills/techniques you have learnt in that session? (5 marks)
Question 3: How many practice questions did you work on the class with your lecturer? Briefly summarize the content of that questions and what you have done with your lecturer in practicing with those questions. What are the problems did you encounter when you worked on that practice questions? (3 marks)
Question 4: How can you potentially apply what you have learnt in that class in your real life? (2 marks)
Part 2. Fact finding of securities market in Australia (10 marks)
You are required to go to Online Portals of ASX and ASIC, explore the data and information in the portals and perform the following tasks:
Task 1. Search for guidance of ASX on securities listing and answer the questions assigned to your groups. Students are required to attend the tutorial session in week 9 to get the guidance from lecturers about which questions they need to answer in this Part. This information will not be available in tutorial solutions (3 marks).
Task 2: Search for guidance of ASX on ASX participants and answer two questions assigned to your group. Students are required to attend the tutorial session in week 9 to know what are the questions you need to answer in this Task. This information will not be available in tutorial solutions. (3marks).
Task 3: Search for information in the ASIC Portal for Finance Professional and answer the questions assigned to your group. Students are required to attend tutorial session in week 9 to get the guidance from lecturers about the questions your group will need to answer in this Task. This information will not be available in tutorial solutions. (2 marks)
Task 4: Search for information in the ASIC Portal for Consumers and answer the questions assigned to your group. Students are required to attend tutorial session in week 9 to get the guidance from lecturers about the questions your group will need to answer in this Task. This information will not be available in tutorial solutions. (2 marks)
Guidelines – Adapted Harvard Referencing
1. Reference sources in assignments are limited to sources which provide full text access to the source’s content for lecturers and markers.
2. The Reference list should be located on a separate page at the end of the assignment and titled: References.
3. It should include the details of all the in-text citations, arranged alphabetically A-Z by author surname. In addition, it MUST include a hyperlink to the full text of the cited reference source.
Solution
Introduction
In this report, there will be a discussion on topic 7 of the course. While discussing that topic, many things will be considered, such as the lessons learnt, essential points discussed, and many more. Apart from that, questions are being answered that were asked about ASX and its operations for finance assignment help.
Part 1: Reflective journal
Question 1
The two main topics discussed in the Interactive Tutorial Session Week 9 – topic 7 are incremental cash flow, value drivers, and scenario analysis. Incremental cash flow is the additional cash flow that a firm can generate from a new project (CHENG, 2021, p251(1)). Therefore, incremental cash flow is the difference between the cash flow of the firm with the project and the cash flow of the firm without the project. In the incremental cash flow, a number of things need to be ignored and considered. Sunk cost, overhead cost, and interest payment are the three things that are required to be missed.
On the other hand, working capital investment should be considered because it will lead to an increase or decrease in the cash flow of the company. The opportunity cost should be considered as well because there could be a difference in cash flow due to the different opportunities that the company has possessed (INDAH and KARPRIANA, 2021, p3(5)). The sunk cost is required to be ignored since it has been incurred already and will not be recovered. The value drivers assist the managers in refining the forecasts as well as making corrections to the project. For instance, variable cost per unit could be a value driver that could increase or decrease the cash flow depending on whether it has increased or decreased. Scenario analysis can be reframed to be stated as situational analysis, where changes in the value drivers of a project change the forecasted cash flow of the company. There can be worst-case or best-case scenarios. In the case of a worst-case scenario, the value drivers, such as cost, will increase, which will ultimately decrease the cash flow. On the other hand, in the best-case scenario, the cost could decrease, or the sales might increase, which would increase the cash flow. The worst-case and best-case scenarios will also consider the base case.
Question 2
The lecturer put an emphasis on the things that are required to be ignored and considered during the calculation of incremental cash flow. She had given important examples of sunk cost, which is market research cost. One of the important things that she had asked to focus on was an example of sunk cost based on Toyota company. She stated that suppose Toyota is trying to launch a new product. However, before launching the product, the company had conducted market research that cost the firm 200000 dollars. Therefore, this market research cost is a sunk cost since it cannot be recovered. This example is an important one because it will help us understand what sunk cost is in relation to the business world. While discussing the things that are required to be considered during the incremental cash flow, one of the things that she explained and asked us to pay attention to was opportunity cost. She emphasized the concept by examples of how there could be a different amount of cash generation due to the different decisions being taken by the company.
The lecturer also discussed the scenario analysis, where she discussed the worst-case and best-case scenarios. While discussing that segment, she also mentioned that during the sensitivity analysis, there is no requirement to calculate the base scenario again, thus making the calculation simpler. The lecturer had given the emphasis on the analysis of the worst case and best scenario. She explained that if, in the worst-case scenario, the NPV is 0, then the management will consider the project. It must be kept in mind that even though the NPV is 0, it is 0 in the worst case; therefore, it will definitely be high when the scenario is the base case or best case (ILLÉS, 2020, p41(1)). She asked us to pay attention to the fact that in the case of very low NPV, the company will be considering taking alternative actions that would reduce the probability of the worst case.
Question 3
There are a number of short questions being discussed in class. The quiz consisted of 10 questions, out of which there were five questions that were filled in the blank format, and the other five were true or false questions. For instance, question 7 of the quiz asked whether or not inventory turnover is one of the value drivers of a company. Question 10 asked whether or not the fixed or indirect cost varies with the increase or decrease in sales revenue. Similarly, there were other questions being asked. Apart from these small questions, there was a numerical question based on scenario analysis. In the scenario analysis, it was asked that there is a company that is considering a project where products will be sold at an average price of 25 dollars per unit. The company has assumed to sell 200000 units annually for the upcoming five years. Also, there is an estimate of the investment that the company would require to start the project has been stated. The total cost amounts to 1.5 million dollars. Other information about the residual value and working capital has been given as well. The depreciation method, variable cost per unit, fixed cost, rate of discount, and rate of tax have been disclosed as well. There are two scenarios that have been taken into consideration which are best case and worst case. In the worst-case scenario, the annual sales and price per unit have decreased, and the fixed cost and variable cost per unit have increased. In the best-case scenario, the sales and selling price have increased, and the variable cost and fixed cost have decreased. During the discussion of this question, the lecturer asked us first to calculate the NPV of the project based on the base case. After the base case results were found, she emphasized how the best- and worst-case scenarios should be taken care of. Firstly, the unit sales decreased to 150000, and the price per unit decreased to 23 dollars. The cost increased as per the given information. Then NPV in the worst case was calculated. After that, the best-case scenario had to be considered where the unit sales were increased to 250000, and the unit selling price was increased to 28 dollars. The NPV was calculated, and it was found that the NPV in the worst case is really low compared with the best case. One thing that the lecturer wanted us to focus on was that the discount rate and tax rate would remain the same. One of the problems that I encountered during the solving of the question was whether or not the fixed cost increased by 50000 dollars in the first year, and then it remained the same for the other years. Apart from that, the lecturer made us understand the question really well. Hence, I did not face any problems.
Question 4
In real life, I want to work in the finance department of an organization; therefore, this kind of knowledge about incremental cash flow or scenario analysis will help me strategize. For instance, in the future, when I get the opportunity to make a decision on behalf of the firm on whether or not the company should make an investment in a potential project. At that time, I will be calculating the NPV of the project, and in addition to that, the best case and worst case will be calculated as well. Therefore, I will have comprehensive data on the change in the NPV of the project based on the changes in the value drivers. Also, I will be better at identifying how different value drivers affect the NPV of the company. In doing so, if there will be any value driver that is required to be focussed more often by the company, then I will be considering that and make changes accordingly.
Part 2: Fact findings of the securities market in Australia
Task 1
Seven-step listing process
The seven steps for listing in the ASX are discussed below:
Step 1: Appointing advisers
A team of advisers who are experienced in the listing of stocks must be considered. The team of professionals will have a manager, lawyer, and accountant. The time required for this step is one week.
Step 2: Preparing for the IPO
This step will include drafting the prospectus, listing the application, and documents that are necessary. In some cases, the company can also have to apply to the ASX for the in-principle advice to gauge the company's suitability for listing in the ASX. The time required for this step is nine weeks.
Step 3: Commencing institutional marketing
As per the corporation's act, there is a limitation in the advertisement of IPO before the company can lodge the prospectus with the ASIC. The time required for this step is three weeks.
Step 4: Lodging the prospectus with the ASIC
From the date of lodgement, a seven-day period known as the exposure period starts. During that period, the prospectus of the company is being prepared. The prospectus becomes available to the public, and the firm will not have the right to accept any application under that offer. The exposure period can be extended to 14 days by the ASIC. The time required for this step is two weeks (Australian Securities Exchange, 2022).
Step 5: ASX will process the listing application
The company will have to lodge the formal listing application with ASX within seven days of lodging the prospectus with the ASIC. The time required for this step is six weeks.
Step 6: Offer starts, and the company will commence marketing to the retail investors
After the exposure period, the offer to the retail investors will be made. It is open for five weeks. This process takes 3 to 5 weeks.
Step 7: Offer closes, and the process of listing on ASX commences
The offer of the company closes, there is the allocation of shares, and the company is listed on the ASX (Australian Securities Exchange, 2022). After this, the trading of the company on the ASX commences. The estimated time required for this process is two weeks.
Task 2
(1) Securities lending
Securities lending is a way of loaning shares, derivatives, commodities, and many more to other investors or companies. Securities lending will require the borrowers to put up collateral in the form of shares or cash, or a credit letter. When the shares are being loaned, then the title and ownership of the shares are transferred to the borrowers as well. A fee for the loan, which is also known as the borrowing fee, is being charged to the company as well by the brokerage to the client who is borrowing the shares in addition to the interest charged for the loan.
(2) Non-settlement days
As per the ASX settlement rules, a business day implies a day apart from Saturday, Sunday, Good Friday, and any other day that the ASX Settlement has notified (Www2.asx.com.au, 2022). Therefore, the non-settlement days are the days when ASX will not be conducting any business. If ASX has declared that on 1st of October is an ASX Settlement Non-business day, then that day will become an ASX non-settlement day when it will not operate for the market.
Task 3
General obligations of Australian financial services licensees
Any Australian Financial Services Licensee need to follow some general obligations under s912A (1) of the Corporations Act 2001 (Corporations Act). Following are the obligations that are needed to be followed:
• Do all the necessary things that will ensure the efficiency, honesty and impartiality of all the financial services covered by the licence are provided to the licensee s912A(1)(a));
• Having a proper and sufficient amount of management in order for any sudden rise of conflict of interest in relation to the actions or activities followed in the provision of financial services by the licensee or their representative. (s912A(1)(aa));
• Acting according to the conditions given on the licence of a licensee (s912A(1)(b));
• Acting according to the laws of the financial services (s912A(1)(c));
• Taking proper measures that will ensure the compliance of the representative (insurance providers) with the financial service laws. (s912A(1)(ca)) (Www5.austlii.edu.au, 2022);
• Keeping in hand enough financial, technological and human resources, those will provide the financial services covered by the licence of the licensee and take responsibility for the supervision (s912A(1)(d)).
The following obligations will not be applicable if a person is supervised by the Australian Prudential Regulation Authority (APRA) unless the person is the holder of an ARPA license and they have been provided with the authority to operate managed investment schemes.
Task 4
Reverse mortgage
A reverse mortgage is basically a financial agreement that lets the older people of Australia hand over equity in their home in exchange for regular payments that can be considered retirement income (Asic.gov.au, 2022). The repayment of such a loan is not expected sooner until the person receiving the mortgage leaves the house or dies. A reverse mortgage is 2% more expensive than a general home loan, and the interest upon the amount is calculated as compound interest because the chances of repayment are almost none. According to ASIC, the rate of demand for Reverse mortgages has increased since the global crisis earlier, which was $1.3 billion in 2008, that increased to $ 2.5 billion by 2017. The people who were borrowing money as a loan have very less knowledge about the risks and the interest amount, they would have to pay in their future, and that would make them financially weak to lead their future needs. A reverse mortgage works opposite to that of a loan, where the borrower pays money to the homeowner. The owner gets an approximate amount of monthly income to live his life and meet his needs. The choice of payment option is made by the owner, and they need to repay the interest percentage amount in the principal amount provided by the money lender. Over time as time passes, the debt amount of the owner keeps on increasing, and the equity of the house goes down gradually.
Part 3: Capital budgeting and project evaluation
3.1. Capital budgeting decision making
Considering the given case scenario, it is identified that the company should adopt the net present value analysis to select the equipment that it should purchase. Based on the case study, no income-related information is provided there for the project, which has the minimum net present value regarding the expenses that should be selected by the organization if the income is indifferent in both cases. The reason behind the net present value analysis is based on the following aspect.
Pros:
? The net present value analysis considered the investor's earnings requirement for making the investment.
? Secondly, under the net present value analysis, the critical aspect regarding inflation, change in product output, sales price, variable cost, and other expenses are included in the decision-making process, which enhances the result (KIM et al., 2021, p47(2)).
? The net present value analysis provides a pivotal decision-making process because if the net present value of the project is not positive, then it should not be invested; on the other hand, the other capital budgeting techniques and tools depend on comparisons.
Cons:
? To calculate the net present value, the discounting rate is required to be calculated; however, there is no defined parameter to calculate the discount rate. Most organizations consider the cost of capital as the discount rate; however, the change in capital structure and the market environment will change the discounting rate applied at the time of selecting the project (CHUNDI and SHILPA, 2022, pp68(1).
? Secondly, under the net present value analysis, the investment size is not considered, which is conducted in the internal rate of return and the payback period to determine the preferability of a particular project.
Based on the calculation and the net present value analysis, it is identified that the cost of Project A is comparatively lower than the present value of the total cash flow of Project B. Hence the company should select Project A.
See Appendix 1:
3.2. Risk analysis and project evaluation
Base case scenario
Under the base-case scenario, if it is assumed that the company's assumptions are correct, then the project will generate a net present value of $19225678. Therefore, at a discounted rate of 12%, the company can easily select the project because it is delivering more than the investor's requirement.
.png)
.png)
Worst Case scenario
Under the worst-case scenario, the company has encountered a decrease in production units by 10% along with a decrease in sale price by 10%, whereas the variable cost and the fixed cost of production increased by 10%, which is impacting the contribution and the net profitability. Even after those adjustments, the proposed project has a positive net present value of $13445960.39. Therefore, the company can select the project for investment because it is delivering more than the required profit in different adverse scenarios.
.png)
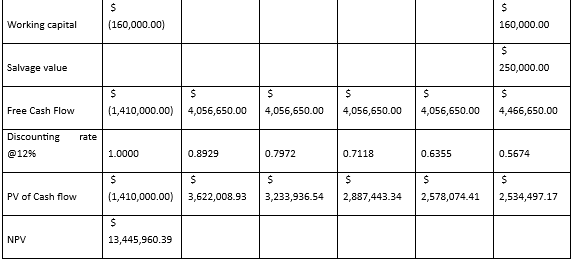
Best case scenario
In the best-case scenario, when all the preferred assumptions in terms of unit sales price, variable cost per unit, and the fixed cost per annum are in favor of the organization, the company's net profitability is expected to increase because even in the base case scenario the company has delivered a good amount of net present value. Dissimilar identification is made in the case of the best-case scenario where the company’s net present value has increased to $25835576.
.png)
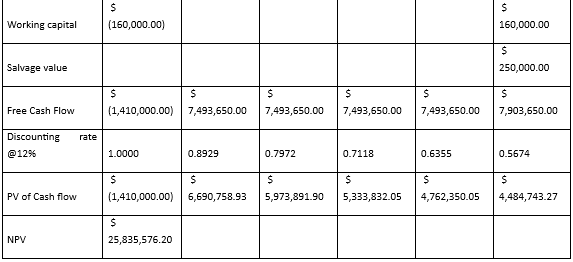
Based on the calculation and the discussion, it is identified that the potential project is sensitive to the business movement; however, even in adverse situations, it delivers a good amount of profit to the investors in comparison with its discounting requirement; therefore, the company can easily select this project for the investment purpose (FA, SHAO and LAN, 2021, pp 7(2)).
Conclusion
Based on the discussion above, it is evident that the things that were taught in topic 7 were extremely important in the practical life of a person. Learning about scenario analysis has made me realize that I can use this knowledge in my day-to-day life as well when I invest in anything. Apart from that, the discussion on the other questions is an indication that the steps taken to list a company in the ASX are simple if the team who is responsible behind is very efficient. Also, the discussion has helped me understand a number of concepts that can potentially help me in the future.
References
.png)
MBA403 Financial and Economic Interpretation and Communication Assignment Sample
Assessment Instructions
• Students will select an ASX listed company that has currently published financial statements which meet accepted standards of financial reporting.
• The report is limited to 2000 words (+/- 200 words), excluding the title page, bibliography and appendices.
• The report is to be formally written as per Resource A below.
• The report is to be submitted via Turnitin.
Resource A – Financial Management Report and Content
Executive Summary
• The executive summary provides an outline of: the company background, the stakeholder the report is aimed at and the purpose of the report. It also includes a brief statement of the recommendation(s).
• The executive summary should be approximately 10% of the total word count.
Key Performance Indicators
• Present and concisely discuss key financial results and trends.
• Calculate and present relevant financial ratios.
• Present and concisely discuss non-financial and sustainability indicators.
• Consider using an appendix for extensive data tables or calculations.
Interpretation and Insights
• Explain the causes of the changes in the company’s financial performance.
• Interpret your financial ratios.
• Analyse the non-financial indicators and the company’s sustainability and/or ethical performance.
• Consider the company’s strengths, weaknesses and opportunities. Alternatively, consider the company’s business strategy, competitors and outlook.
• Reach insights on which to base your recommendation(s).
Conclusion and Recommendation
• Present the significant outcomes from your analysis.
• Clearly state an actionable recommendation(s) for your stakeholder. For example, if the report is written for a potential shareholder, recommend a decision to invest or not invest in the company. Alternatively, if the report is written for an internal manager, make a specific recommendation in order to improve the financial performance of the company.
• Justify your recommendation(s).
• The Conclusion and Recommendation should be approximately 20% of total word count.
Bibliography and In-text Citations
• The Academic Integrity and Conduct Policy requires the appropriate use of in-text citations and a bibliography. You must correctly cite all references (information sources) and comply with the expectations for academic writing.
• The bibliography and citations are excluded from total word count.
Solution
Introduction:
The objective of this report for assignment help is to present a detailed understanding of BHP, which is one of the leading mining Companies listed on ASX. In this report, the key performance indicators of the company and changes in a recent financial year will be elaborated (bhp.com. 2022). At the same time, the financial performance of the organisation will be evaluated by applying an appropriate range of financial ratios, and the same would be compared with Rio Tinto for a better understanding of the financial position. The report will also analyse the non-financial and strategic factors which should be considered while making investment-related decision.
Key performance indicator
Financial results and trends:
In the recent financial year, the sales revenue of the company has significantly increased. The revenue of the company was 42931 in 2020, which increased to 60817 million in 2021. The EPS of the company has also improved from 157.3 to 223.5 US cents. However, there was a small increment in total assets and net assets. In the recent financial year, the company has significantly managed from 12044 in 2020 to 4121 million, which indicates the overall gearing position.
Calculation of the financial ratio
.png)
The summary table of calculation is provided above, the detailed calculation is provided in appendix.
Non-financial and sustainability indicator
Along with developing the existing businesses, the company is also investing heavily in the environmental and social programs, which is also increasing the performance of the company.
In addition to that, the company has identified their performance for the future, and the company has developed a business merger proposal to create a global top 10 independent Energy companies. At the same time, the company is willing to unify the corporate structure for flexibility to operate in the future.
Interpretation and Insight
Explanation of the causes of changes in the company's financial performance
Considering the business analysis for the company to identify BHP is one among the company that is willing to have an absolute market-leading strategy by investing in future businesses. Considering the energy and commodity needs of the business, the company has acquired various investments and areas of interest for their mining businesses. The company's performance for significantly impacted because of the covid-19 pandemic, with the Global economic work sustained because of the government restrictions and the Highly Effective covid-19 virus. However, in the next financial year, the company has identified significant growth in the recent financial year because of a substantial increase in the Global energy need. In addition to that, the company is investing heavily in the renewable energy business directly and indirectly. The company provides metal copper, Nickel and others, which is helping the renewable energy and electric vehicle business by supplying quality copper, Nickel and others.
Interpretation of financial Ratio
Profitability ratios:
Operating profit margin:
The operating profit margin of the company will speak about the operating profit-earning capacity in comparison with the revenue, which will indicate the earnings generated by the organisation from its business. The operating profit of BHP Billiton was 34% in 2020. However, with a significant increase in revenue by almost 42%, the operating profits of the company have increased to 43%. The increase in operating profit margin suggests that the overall profitability aspect of the organisation is providing a substantial value return against the revenue (Hushko, Temchenko and Kryshtopa, 2020).
.png)
Net profit margin:
When it comes to performance and profitability analysis for any organisation then, the net profitability of the business becomes the most influential factor. In the financial year 2020, the net profit margin of BHP Billiton was 20% which increased to 22%, suggesting an implement internet profitability by 9% compared to the previous financial year. Even though the operating profitability of the company has increased by almost 27% in the recent financial year, the increment in net profitability is comparatively low because of substantial payment of financial expenses and tax-related obligations.
Gearing:
Debt to Equity ratio:
The debt-to-equity ratio of the company will suggest a gearing position by comparing the total debt against the equity. As per the recent financial statement is identified that the long-term debt to equity ratio of the company was 0.12 in 2020, which is for the decrease to 0.07 in 2021 because of significant repayment of long-term borrowings.
.png)
Interest coverage:
The interest coverage ratio is and financial and solvency Indicator which will analyseanalyse the interest payment capacity of the organisation. To calculate the interest coverage ratio, the operating profits are compared with the financial expenses. In 2020 the interest coverage ratio of the 11.43 times which has increased to which has increased to 18.8 times Because of the substantial increase in operating profitability in comparison with the financial expenses (Kawani and Abdal, 2020).
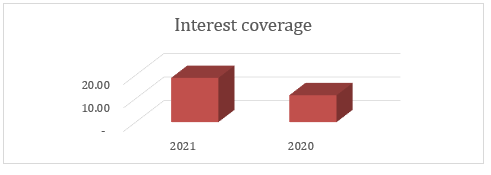
Liquidity:
Current ratio:
The current ratio is one of the important security measures for any Organisation in feature comparison between the current assets and current liabilities are recorded (Ikegawa, 2020). Under general preference, the current ratio of more than two is highly liquid in nature; however the current ratio to trend is expected to change based on the industry. In the financial year 2020 the current ratio of BHP Billiton was 1.45 :1. In 2021 because of the increase in current assets by 24% the overall current ratio of the company has increased to 1.63:1, resulting and improvement in the liquidity position.
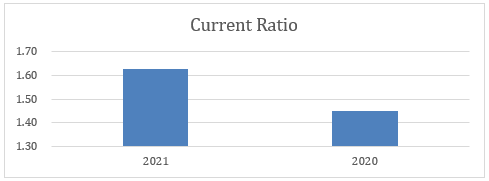
Quick ratio:
In the case of mining companies, a significant stop is remained in hand in the form of inventory there for the quick ratio is calculated to determine the real-time solvency status of the organisation by comparing the current assets after deducting the inventory with the current liabilities (Kusmayadi, Rahman and Abdullah, 2018). The quick ratio of the company was 1.37 :1 in 2020, Which has increased to 1.54:1 in the next financial year. The increase in the current ratio in the quick ratio indicates that the overall liquidity position of the company is a is preferable position.
.png)
Asset Management:
Trade receivable turnover:
The trade receivable turnover is a significant Asset Management ratio for the company which indicates the efficiency of the company in managing their credit sales and connecting the dues from the customers (Amanda, 2019). The trade receivable turnover for the company was 12.76 times in 2020 which has deteriorated to 10.04 times in 2021. The reason behind the decrease in interest receivable turnover for the company is because of the increase in account receivable outstanding balance which indicate that the company is extending their credit facility to their customers (Hertina and Saudi, 2019).
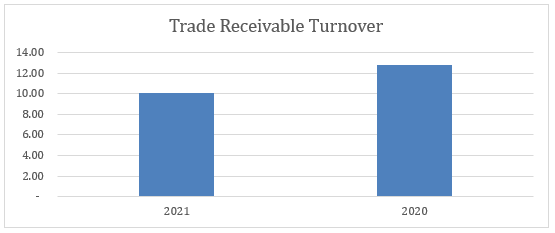
Return on assets
The return on Assets and other Asset Management ratio which indicates the efficiency of the organisation to generate revenue and profit against their total assets (Amanda, 2019). In the financial year 2020, the return on assets for the BHP Billiton was 8% only, which has increased to 12% because of the substantial increase in the net profitability by 54% against which the total assets have increased by 23%.
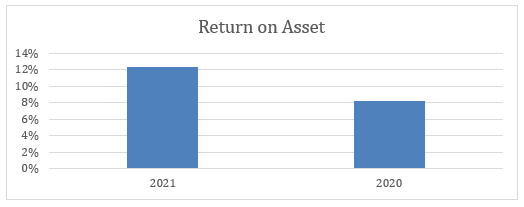
Analysis of the non-financial indicators for the company's sustainability
Beside The financial factors of the company then on financial factors which is impacting the sustainability of the company is also indicating greater efficiency and control of the business. For instance, the company has identified the material sustainability issues, namely the employee management, considering the environmental matters, the social and Human Rights obligations for the company, implementing anti-corruption and ant bribery matter and others. In all those expect the company has initiated significant policies and Standards which is enacting the code of conduct that the management should perform in all those matters. In the page 33 of recent annual report the company has also identify the principal risk related to the sustainability issues and it has indicated the non-financial key performance indicators for those risk which is improving the company’s understanding and managing the business affairs (Mulyadi and Sihabudin, 2020).
SWOT analysis for the BHP
In this section of the report the strength weakness opportunity and the critical risk factors will be discussed with the help of SWOT analysis Strength:
? The BHP Billiton is having access to the diversify portfolio of natural resources which is providing them stability in operating in this industry
? The constant from financial performance and increment in revenue is providing additional strength to the company and its shareholders
? The international presence of the company is another important factor which is working in favor of the organisation
? The minimum leverage position is providing the company a substantial growth opportunity without impacting its solvency status (Purnomo and Tjendrasa, 2020)
Weakness
? Even though the recent performances of the company are expanding rapidly but the previous performances and profitability of the company was more lucrative than it is earning today
? Most of the company's revenue is dependent on very few countries like China, therefore if there is volatility and a decrease in demand in those countries, the company's overall performance will be impacted.
Opportunity
? The company has initiated significant merger and acquisition strategies which is helping in expanding their operation.
? The company is also willing to invest in the innovation and Technology businesses to enhance their future performance
Threat
? The international political scenario specially between the west vs Russia and China is impacting the global economy.
? The fluctuation in foreign currency translation is impacting the company's profitability
Company's business strategy
The business strategy of BHP Billiton is that identification and Exploration of various area of interest and developing the areas from which the company can explore the mining or and reserve. In addition to its own Research and acquisition of the area of interest the company also acquire the small-scale companies who is having access to different mining assets at the same time the company is expanding their product portfolio to the items which can be used for the electric vehicle and renewable energy businesses.
Competitors and Industry Outlook
The current comparative performances of the companies engaged in the same sector is also having a substantial revenue growth for instance The Rio Tinto which is another recognise mining company in Australia and having operations across USA and the world, has recorded a revenue growth of 77% in 2021 and the company has generated 36% net profit against their revenue which indicates high profitability position (Riotinto.com. 2022). In addition to that after the covid-19 pandemic When the Economist are getting restore the demand for the energy and raw materials for the various Industries is keep on increasing which will be beneficial for the company (Hushko, Temchenko and Kryshtopa, 2020).
Insights on which the recommendations should be initiated
Even though the company's overall performance is substantial, and it is growth prosperous the company will have to work on the following aspects
? Net profitability
? Improvement in accounts receivable management
? Improving the product portfolio and diversification of the business.
Conclusion and Recommendation
After conducting the financial analysis for the BHP Billiton for the recent financial year and comparing it with the previous financial year it is identified the company's growth opportunity in terms of revenue and profitability is significant compared to the previous year. However, the competitor companies like the Rio Tinto are Providing more value returned to the investor in terms of higher net profitability and operating profitability. In addition to that, the accounts receivable turnover for the Rio Tinto has increased significantly in 2021 compared to the previous financial year which indicates that BHP Billiton is required to improve their accounts receivable management strategy. The non-financial indicators and the SWOT analysis for the company is indicating that the oval performance of the organisation is growth process however the concerns over the strategic objectives for the organisation is required to be initiated with efficiency otherwise it will have a significant consequence. As of now in the company will be recommended to improve their net profitability because the differences between the operating profit and net profit is substantial and which is because of the financial expenses and Taxes.
Reference:
FIN921 Impact of CSR on Corporate Performance Assignment Sample
Task requirements:
1. Must be completed as a group work (2 people) to produce one report.
2. You must build up your own argument from reading the relevant journal articles.
3. You should search for 8 key journal articles, which is relevant to the pre-assigned 4 journal articles provided above.
4. The maximum length of the report (including the title page, abstract, body text, in- text citation and reference list) is 2,000 words. Report outside the scope of word limit of +/- 5% will be penalised with 5% penalty.
5. An abstract of no more than 150 words is to preface thereport.
6. The report should follow the structure including Abstract, Introduction, Body text, Conclusion and the Reference List.
7. Referencing and in-text citation must follow an acceptable academic format using the Journal of Finance referencing style. Please follow the guidelines ("Referencing Guide - Journal of Finance") uploaded on the FIN 921 Moodle site. All sourced material, including direct quotations, must be appropriately acknowledged.
8. Use your own words. Reference wherever necessary. Do NOT plagiarise. 9. Each group makes ONE soft-copy TURNITIN submission only.
Solution
Introduction
Over the last decades, significant research has been conducted on the impacts and challenges of corporate social responsibility (CSR). A growing body of finance research shows that there are several social and economic benefits of conducting CSR activities such as gaining customer loyalty, increasing brand competitiveness and earning better social perception in front of their consumers. Although existing studies offer evidence to support these benefits, it fails to fully explain how these activities directly impact corporate performance in terms of financial stability. Thus, the underlying research question for this review is that is there a direct positive or negative impact of CSR on financial performance of a corporation.
Body
Economic benefits
Several studies find direct evidence of benefits of being engaged in corporate social responsibilities. One of them is that CSR inspires brand loyalty among customers. For example, in the study conducted by Moon et al. (2015), stated that earlier studies on consumers’ corporate association significantly influence the responses for consumer products. According to their findings, customers' perceptions of a company's corporate competence were favourably and substantially linked to their own personal self-concept. The following is their conceptual framework.
.png)
Figure 1: Conceptual framework of Moon et al. (2015)
According to the results of their survey for assignment help , there was a favourable and substantial correlation between consumer CSR affiliations and their social self-concept. In addition, research seems that customers' loyalty to a company's brand is favourably and strongly linked to their personal and social self-concepts. These findings are in accordance with earlier studies.
Similar research was conducted by Huang et al. (2017) which aimed to investigate how service quality and CSR has an impact on customer-company identification (CCI) and what consequences it has on customer loyalty. It is because, as per customer perception, the companies involved in CSR activities offer its customers a feeling of self-enhancement. This research studied how service quality and CSR affect CCI over time to assist managers enhance the efficacy of their efforts to improve CCI (figure 2). In this longitudinal research of restaurant consumers, the researchers used latent growth curve modelling and found that the predictions were supported by the data.
.png)
Figure 2: Conceptual framework developed by Huang et al. (2017)
An identical study by Ajina et al. (2019) identifies the gap in the literature of CSR. Ajina et al. (2019) mentioned that earlier studies on CSR were limited to the study of consumer behaviour; there are limited studies on the measure of consumers’ awareness level and perception on CSR. As stated by Ajina et al. (2019), previous studies majorly assumed that customers are well aware of CSR, however, the research discovered that the awareness among customers is quite low. According to their findings, even though CSR awareness and perception positively impacts CSR expectation, it does not impact loyalty positively. However, customer’s support is positively impacted by CSR expectations which in turn impacts loyalty positively (Figure 3).
.png)
Figure 3: Findings of Ajina et al. (2019)
On the other hand, the study conducted by Boulouta and Pitelis (2014), argues that companies are under growing pressure to adopt or enhance their socially responsible business practices (CSR). There is a moral as well as a strategic necessity to this pressure. According to the moral imperative, corporations have a responsibility to their shareholders, but also to various stakeholders, including the general public, and so they have a role to play in alleviating some of the "ills of globalisation." This idea has been extensively addressed in the literature. A claim that CSR may help companies be more competitive is at the heart of this strategic imperative. Their findings imply that national CSR performance may significantly contribute to increased national competitiveness, which is about equivalent to GDPC in the first instance. Even in nations with a modest level of innovation, it seems to have a greater influence on the economy and society. These nations may be able to make up for a lack of strong national innovation records by using CSR-based differentiating methods. Their findings seem to be in line with other studies in this field.
The research by Moon et al. (2015) used the primary data collection method, the researcher conducted a survey to collect data and to assess the relationship between consumer corporate association and corporate brand loyalty. However, the method was limited due to the fact the participants in the survey had to rely on their memory regarding products and the manufacturer of those products. Huang et al. (2017) research collected data from customers of reputed chain restaurants in Taiwan. Huang et al. (2017) justifies the selection of restaurants for the research by stating that customers can easily develop a personal identification with restaurants as they facilitate characteristics such as design, idiosyncrasy and atmosphere. Similarly, the findings of the investigation by Ajina et al. (2019) confirmed that customers’ awareness regarding CSR activities have a positive impact on the perception of CSR in the customers of Saudi Arabia.
Social benefits
Apart from economic benefits several authors have found evidence of social benefits to conduct CSR activities as well. According to Barnett et al. (2020), it is the obligation of businesses to contribute to the well-being of society as a whole, and this is what corporate social responsibility (CSR) is all about. Companies often take part in a wide range of CSR projects, many of which claim to have a positive impact on society as a whole. Companies, for example, help social change agents by providing them with technology and knowledge. He conducted a cluster analysis of studies conducted on CSR and firm performance and found out that major emphasis has been provided on topics of business ethics, challenges and government.
.png)
Figure 4: Cluster analysis conducted by Barnett et al. (2020)
On the other hand, Murshed et al. (2021) opines that academics and best practices place a high importance on CSR efforts. Its conceptual underpinning focuses on the processes and initial conditions that underlie how workers' knowledge and attitudes about a company's CSR activities impact their job satisfaction. The following are the tenets of their philosophy: (i) workers' opinions of a company's social responsibility activities and their job happiness, and (ii) procedural justice—how a person perceives the fairness of the methods by which choices are made or allocations are established. Procedural justice is a fairness-based approach that the authors believe will have a greater impact on the workers' views of CSR and CSR value to the employee. The study by Murshed et al. (2021) supports its assertions with a survey. The conceptual model was tested using a cross-sectional survey approach. One of their primary goals was to choose a broad group of employees from a variety of sectors, job titles and company sizes. This helps in justifying and substantiating their hypotheses.
In a separate context, it has been observed that gender representation has also impacted firms and it is considered as a significant CSR activity to promote diversity. In the study conducted by Cabeza?García et al. (2018), it was evidenced that only 23% of the board members of the top publicly listed firms are women, according to current statistics, and that number drops to 20% in Spain. There is still a long way to go, but since the European Commission first placed this problem on the political agenda in 2010, there has been a considerable gain of 11 percentage points.
Impact on firm performance
There is multiple evidence that show that there is a direct financial challenge for engaging with CSR activities. Consistent with the findings of the prior study, Rhou et al. (2016) argues that A growing number of businesses are concerned about corporate social responsibility (CSR) since they are judged not just on their financial success but also on their social impact. Consumers in the 20- to 35-year-old age bracket, known as "millennials," frequent restaurants in greater numbers than any other demographic. These diners base their choice of restaurant on more than just the quality of the food; rather, they base it on how they feel about the restaurant's social responsibility as well. The authors support their data with secondary sources such as restaurants’ annual reports and CSR statistics. According to their findings, CSR initiatives have a favourable financial impact on restaurants only if they are well publicised, according to the research. Positive CSR operations will not provide financial rewards if firms fail to interact with stakeholders. There are 0-10 levels of positive CSR, with a mean of 1.507, whereas there are 0-13 levels of negative CSR, with an average of 1.640. The number of articles that mention a company's CSR efforts positively has a mean value of 2.604, with a range of 0–41 (Figure 5).
.png)
Figure 5: Findings of Rhou et al. (2016)
In their study, Alikaj et al. (2017) state that CSR and financial success have not been conclusively linked. When it comes to financial success, for example, there is evidence that social responsibility might have an adverse effect. A study of the paper industry indicated that companies with pollution controls performed worse in terms of ROE and ROC than those who didn't apply pollution controls. Several studies have indicated a negative correlation between the two. The authors back up this argument by demonstrating that the additional costs associated with being socially responsible might place a company at a financial disadvantage when compared to companies that do not take such measures. KLD social responsibility metrics were shown in this study to be connected with greater ROE, ROA, and ROS for 469 of the Fortune 500 businesses analysed by the authors of this study.
In this aspect, it becomes essential to underline that providing profits to investors is imperative for any firm. Greenwood and Van Buren III (2010), argue that the moral treatment of stakeholders depends on the trustworthiness of the connection between the firm and its stakeholders. Once a stakeholder accepts a financial investment, the company has an obligation to do all in its power to maximise that shareholder's gains (or limit their losses). The phrase "investment" is used here to refer to everything that is useful to the company's operations, including personnel, financial resources, and a place to operate. Because the corporation has more power than the stakeholder, it can't be relied on to deliver the aforementioned advantage to that stakeholder consistently. The moral quality of trustworthiness has a direct correlation to the degree to which a company's actions may be relied upon. With the help of these findings, they develop a split trust continuum. According to the authors, there is a qualitative difference between the existence of mistrust and the lack of trust. In contrast to a single trust continuum, shown in Figure 6, a divided trust continuum is shown. This finding suggests that in order to calculate the "distrust-lack of distrust" scale, both the agent's behaviour predictability and the principal's degree of suspicion must be considered.
.png)
Figure 6: Split trust continuum developed by Greenwood and Van Buren III (2010)
Contrary to popular belief, the work of Pope and Lim (2017) suggest that the structure of CSR has a direct connection with firm performance. In their work, they suggest that the mobilising structures of international organisations impact the spread of knowledge and the subsequent perception of its performance. On the basis of empirical evidence, we concentrate on company engagement in international business organisations that promote corporate social responsibility (CSR). The authors speculate on how these global CSR organisations affect both corporate participation in CSR frameworks and public perceptions of the quality of CSR activities.
Su et al. (2020) has raised the question of whether CSR improves corporate financial performance (CFP) has significant effects on how a company decides to prioritise CSR. as stated by Su et al. (2020) academics and the business world are becoming more interested in CSR in growing economies like China. Su et al. (2020) mentioned that organisational behaviours differ across companies in developed markets and emerging nations. As a result, it may not be appropriate to mechanically extrapolate CSR findings from developed economies to emerging markets.
Conclusion
After conducting a thorough literature review and developing common themes such as social and economic benefits of CSR along with the impact of corporate performance, it can be concluded that there is no disagreement among the authors that CSR significantly influences the perception of not only consumers but also employees as they feel more motivated to work for a firm whose value and ethics are aligned with their personal ethical standpoint. However, there is still a significant gap in literature regarding the impact of CSR on firm performance and there is further scope of research in the area where financial ratio analysis can be done to identify the ROI and cost of CSR for an organisation.
References
.png)

- Assignment - Accounting
- Assignment - Auditing
- Assignment - Biology
- Assignment - Management
- Assignment - Law
- Assignment - Nursing
- Assignment - Finance
- Assignment - Economics
- Assignment - Computer Science and IT
- Assignment - Humanities
- Assignment - Statistics
- Assignment - Architecture
- Assignment - Engineering
- Assignment - cookery
- Assignment - Marketing
- Assignment - Child Care
- Assignment - Mathematics
- Case Study - Accounting
- Case Study - Law
- Case Study - Management
- Case Study - Nursing
- Case Study - Finance
- Case Study - Computer Science and IT
- Case Study - Engineering
- Case Study - Economics
- Case Study - Biology
- Case Study - Auditing
- Case Study - Marketing
- Case Study - Project Management
- Coursework - Accounting
- Coursework - Auditing
- Coursework - Biology
- Coursework - Management
- Coursework - Nursing
- Coursework - Finance
- Coursework - Computer Science and IT
- Coursework - Engineering
- Coursework - Humanities
- Coursework - Child Care
- Coursework - Project Management
- Coursework - Economics
- Coursework - Cookery
- Coursework - Law
- Coursework - Diploma
- Dissertation - Accounting
- Dissertation - Auditing
- Dissertation - Biology
- Dissertation - Law
- Dissertation - Management
- Dissertation - Nursing
- Dissertation - Finance
- Dissertation - Computer Science and IT
- Dissertation - Humanities
- Dissertation - Economics
- Essay - Accounting
- Essay - Biology
- Essay - Law
- Essay - Management
- Essay - Nursing
- Essay - Computer Science and IT
- Essay - Humanities
- Essay - Economics
- Essay - Auditing
- Essay - Engineering
- Essay - Architecture
- Essay - Finance
- Essay - Science
- Essay - Marketing
- Programming - Computer Science and IT
- Reports - Management
- Reports - Computer Science and IT
- Reports - Project Management
- Reports - Marketing
- Reports - Nursing
- Reports - Engineering
- Reports - Accounting
- Reports - Humanities
- Reports - Finance
- Research - Statistics
- Research - Accounting
- Research - Auditing
- Research - Biology
- Research - Law
- Research - Management
- Research - Nursing
- Research - Finance
- Research - Computer Science and IT
- Research - Science
- Research - Engineering
- Research - Humanities
- Research - Economics
- Research - Project Management
- Research - Architecture
- Research - Marketing
- Thesis Writing - Computer Science and IT
- Thesis Writing - Engineering
- Thesis Writing - Biology
- Thesis Writing - Finance
- Thesis Writing - Humanities
- Thesis Writing - Auditing
- Thesis Writing - Economics
- Thesis Writing - Law
- Thesis Writing - Nursing
- Thesis Writing - Accounting
- Thesis Writing - Architecture


.png)
~5.png)
.png)
~1.png)


.png)


