ECON1025 Prices and Markets Assignment Sample
Assignment Brief
The assessment is worth 50 marks and will be delivered as a question sheet on Canvas exactly two weeks before the submission deadline. Your submission will receive an automatic Turnitin similarity score that should not exceed 25%. You should check this score using the tool on Canvas before submitting. Exceeding this limit raises the risk of your submission being subject to an academic integrity process. As per University regulations late assignments receive a 10% penalty per day until the mark reaches zero. Marks will be given according to the rubrics on Canvas. You must attach a completed coversheet with your submission (template appended below). For the formatting requirements follow the advice given for assessment task 2 above.
Your submission should be a word-processed document not exceeding 2000 words. Any diagrams that you wish to use can be inserted into this document in any way you like, i.e. created in the word-processing software itself, or inserted as a photograph of a pencil drawing or from another software.
There is no discretionary margin above this limit. There is no minimum but you are advised to use all the words for assignment help allowed to allow for a more developed and detailed analysis.
Answer any FOUR of the following questions. Each question is worth a total of 12.5 marks. If more than four questions are answered, marks will be awarded for the first four answers only.
QUESTION 1
High-performance cars (HPCs) are automobiles with engines that generate great power relative to their weight. They boast high acceleration, speed, cornering and breaking performance. But they obviously come with a very high price tag. Some people even buy them to publicly display their wealth. The Singapore economy has grown rapidly between the 1960s and 2018 with rising incomes across the island. Examine the likely consequences of rising incomes on the Singapore HPC market and one or two related markets.
QUESTION 2
The speed limit on Singapore roads, even expressways, never exceeds 90 kmh, much less than the top speed of HPCs. But there is a road racing culture where individuals perform stunts and races on public roads, far exceeding speed limits. What, if anything should government do about the HPC market? Should such cars be banned outright? What would be the problems with such interventions?
QUESTION 3
The car industry is characterized by heavy research and development activity. This activity has a high fixed cost and can only be undertaken by large firms with significant monopoly power. Sometimes the innovations of the car industry spill over into other industries. There is also a great deal of product differentiation, with certain brands enjoying reputation and loyalty.
What are the likely effects of these aspects of the industry on the market structure for HPCs? Examine this industry using the theory and models of industry structure. Should government be worried about any aspect of how an industry with this market structure will perform?
QUESTION 4
BMW is one of the world’s best known HPC manufacturers. Developing new cars is a costly, uncertain and complex process. This company would need to consider which parts of the vertical chain to outsource and which to conduct in-house. Using the theory of the optimal boundary of the firm, discuss BMW’s make-or-buy decision for developing and producing a HPC. What stages of the vertical chain should BMW consider conducting in-house, and which should be outsourced? Provide reasons for your findings.
QUESTION 5
Consider the following hypothetical case. Only BMW and a competitor, Mazda, are considering launching a new, niche HPC in the Asian market. The issue is what price to charge. Both new cars are very similar in performance and production cost. Analyze the interaction between the two firms using game theory. Present a payoff matrix to model the situation and analyze it for Nash equilibrium. What can either of these firms do to make their best, most-preferred outcome more likely?
Solution
Question 1: likely consequences of rising incomes on the Singapore HPC market
High performance cars are considered a sign of wealth as rich people often showcase their status and flaunt their economic well-being. High prices of high performance cars imply that only a limited number of people are capable of buying those products in the market. High performance cars are considered to be a luxury commodity in the market as only a few people can afford to buy these products. However, rising economy of Singapore encourages its economic stakeholders to accumulate substantial wealth over the past few decades. Rapid growth from 1960 to 2018 has helped many people to change their fortune as they became wealthy during these periods. This has generated demand for high performance cars in the Singapore market as the capabilities of people buying similar kinds of cars has over this period. As per the studies done by Kern, Dossow & von Roon (2020), people tend to buy more expensive products with a rise in their income. Similar aspects could be observed in the Singapore market as demand for high performance cars would like to increase.
High performance cars apart from being a symbol of wealth possess high acceleration, speed, cornering along with breaking performance. The income elasticity of the high performance cars is positive as rising income enhances the affordability of those for the consumers. Rising market demand would cause the dealers to supply a higher volume in the Singapore market that would raise the overall supply of high performance cars. The market for high performance cars will see a boom as consistent growth of the Singapore market has established itself with a strong economy. The rapid growth of the Singapore economy has enabled the market players to infuse a huge amount of money that encouraged them to buy high performance cars in the market. According to the study of Ji et al. (2021), rising demand for any commodity would increase the price of that product in making it more experience. However, market equilibrium for high performance cars in Singapore would shift towards the right with further increases in the price in the market.
The price increase could be explained through comparative static models that compare different economic outcomes that can be observed after changes in exogenous parameters. In this scenario, demand for high performance cars is changed in the market through changes in income. Furthermore, the demand factor influences the price metric to change which raises the price of high performance cars in this case. The overall price of HPC will rise in the Singapore market although the growth of the economy would stimulate the demand in the market. This would raise the overall import items in the Singapore economy as car manufacturing companies would raise the supply in the market. As per the view of Sadiq et al. (2021), a rise in demand in a specific market often increases the demand in the related markets. Related markets such as customised parts or car paint would observe a growth in the market as the products are complementary.
Question 2: Government intervention in the HPC market and issues developed through intervention
High performance cars possess a high speed which is much higher than the restricted speed in the Singapore economy. Speed limit curbing the speed of vehicles does not allow the riders to enjoy the top speed of high speed cars as there remains racing culture among people. Individuals performing stunts or having a race on the public road could lead to fatal damages that may cause government intervention in the HPC market. As per the studies done by Basu & Ferreira (2020), government intervention allows a market to run properly as well helps in people getting benefits from the market. Restriction on sales of high performance cars could lower the chances of accidents on the road that would sufficiently help the people of that economy. Imposition on sale of high performance cars would discourage the wealthy population of the nation. The Government of Singapore further raised the speed limit in a specific time period along with special race tracks that would allow the cars to remain within a certain area.
High performance cars could be banned by the government of Singapore that would depress the HPC market. On the other hand, the banning of high performance cars would lead to the emergence of the black market in the country. According to the study of Adler, Peer & Sinozic (2019), market imposition of government often restricts the natural market composition that influences the shady market to grow. Furthermore, people of Singapore could buy high performance cars in different national markets and that could be imported into Singapore due to imposed market restrictions. These could lead to loss of taxes and other financial losses for the Singapore government arising due to government intervention in the market. However, banning cars would never solve the problems rather it would create further complications.
The emergence of a shady market is not helpful for the growth of the economy as the government does not get any financial benefits for transactions. The government will have no clue about the number of products sold in the market. As per the view of Bucsky (2018), market governance is necessary to have estimated about any specific market and transaction happening in that market. Furthermore, the government will be unaware of the shady deals that would occur in the parallel market. The parallel market assists in the growth and development of corruption that would cause a bigger issue for the government.
Market equilibrium in the high performance cars market would disrupt through the imposition of the Singapore government. It may lead to market failure as tough restrictions by the government could dry off the entire market. According to the study of Basu & Ferreira (2020), welfare loss happens due to the imposition of market restrictions as both producers and consumers waste their resources. High tax imposition could lower the sales of high performance cars that could help the government in lowering the number of cars in the market. The Singapore government could impose a higher import duty that would provide a similar effect as well.
Question 3: Market structure for HPC industry and governments worry on market performance
The global automobile industry is not that highly competitive as it is filled with various market producers. However, the market structure in the high performance car industry is oligopolistic markets as only a handful of market players dominate the industry. Target market of the high performance car industry always remained different as compared to the automobile industry. As per the studies done by Yin & Hamilton (2018), research and development is the crucial component behind the growth of high performance cars that can be managed through few market suppliers. Producers in the market are unable to carry the heavy research and developmental activities in the market in a regular manner. These aspects have implicated a few producers in the market who are the dominant force in the market.
The market producers have different brand valuations as they have some degrees of product differentiation. A certain amount of product differentiation causes a huge advantage in the market that allows some manufacturers to have a significant market advantage. According to the study of Minh (2020), brand valuation is another component that influences the market position of different car manufacturers. Furthermore, the brand valuation of a company comes through sufficient brand reputation that is acquired through proper servicing to consumers and efficient customer satisfaction. The car manufacturing companies with greater brand reputation allow a greater competitive advantage in the market that helps them in being a dominant force in the market.
Loyalty of the customers plays a crucial role in these aspects as car manufacturers with a higher brand reputation have a greater loyal customer base. As per the view of Horn et al. (2019), the customer retention rate of manufacturing companies depends on the loyal customer base that provides sufficient confidence to the companies in case launching new products in the market. Product differentiation allows car producers to develop different types of products in the market. High performance car industry possesses few manufacturers who have focused on the heavy research and development of their production system in a heavy manner. The car manufacturing companies possess a high fixed cost that provides a certain level of market entry barrier as very few producers are capable of sustaining the cost. This market entry barrier encourages the existing producers in the market to carry on the production activities as profitability remains higher.
The government must not worry about the existing market structure in the high performance car industry as few dominant producers are very competitive among themselves. However, the Singapore government must ensure that any single firm does not contain significant monopoly power in the market. According to the study of Horn et al. (2019), monopoly power could further disrupt the market as only one firm is capable of supplying products in the market which would result in loss of welfare in the market. Consumers could be exploited through the emergence of monopoly in the high performance car industry as a sole producer would satisfy the supply of the entire market. The government must ensure the car manufacturers do not form a cartel that would represent a monopoly manufacturing company itself.
Question 5: Market interaction between BMW and Mazda using Game theory
BMW and Mazda are two companies operating in the high performance car industry in the Asian market. Cars of both of the companies having similar features and providing the same performance lead to a case of no product differentiation in this scenario. Production cost of both the cars being the same implies the cost for these two vehicles will be identical. In this scenario, the application of game theory would be most useful helping to identify the market equilibrium. As per the studies done by Sun & Sun (2018), the payoff matrix model provides a visual representation of the best possible outcomes of strategic decisions for two different players.
The playoff model matrix for BMW and Mazda has been provided below,
Table 1: payoff Matrix Model for BMW and Mazda
(Source: MS Word)
From the above matrix model it can be observed that the pricing of BMW and Mazda cars could be of two different levels which are 100000$, and 200000$. Furthermore, within the matrix, the market share for each of the cars has been provided based on the level of price for each of the high performance car manufacturing companies. It can be observed from the above table that the prices of both of the cars would lead to equal market share in the luxury car industry. Furthermore, one of the cars having different prices would lead to complete market acquisition for one car manufacturing company. Both of the cars having same production cost and identical products would lead to identical product pricing in the market. Cars having different prices in the market would lead to greater market accumulation by the other company. The company with a higher pricing policy would lose a heavy market share as consumers will shift to that other brand with lower cost (Ajay et al. 2019).
In this scenario, BMW will consider market pricing of 100000 USD as the company is beneficial irrespective of policy adoption of Mazda. BMW will accumulate 50 percent and 100 percent of the market while adopting the price of 100000$ which is higher as compared to the other pricing strategy of the company. Similarly, from the playoff matrix, it can be observed that Mazda having products pricing 100000 USD could lead to higher market acquisition as compared to other pricing strategies. According to the study of Koryagin (2018), Nash equilibrium from a payoff matrix model leads to conjugal outcomes that satisfy both of the players. Mazda can acquire a higher market share in the high performance industry irrespective of the pricing strategy of BMW with a market price of 100000 USD. Hence, both the car manufacturer company BMW and Mazda will adopt a price of 100000$ and the Nash equilibrium is (50, 50) in this case.
Reference
Adler, M. W., Peer, S., & Sinozic, T. (2019). Autonomous, connected, electric shared vehicles (ACES) and public finance: An explorative analysis. Transportation Research Interdisciplinary Perspectives, 2, 100038. https://www.sciencedirect.com/science/article/pii/S2590198219300387
Ajay, M., Kannan, S., Narayan, P. P., & Kumar, R. D. S. (2019). A Glance Through History of Automobile Industry and Current Market Study of Some of the Legendry Models in India. In Advances in Manufacturing Technology (pp. 433-441). Springer, Singapore.https://www.researchgate.net/profile/Tamilselvam-Nallusamy/publication/332488514_Mechanical_Characterization_of_Glass_Fiber-Strengthened_Balsa-Depron_Composite/links/5f97e8c292851c14bceac820/Mechanical-Characterization-of-Glass-Fiber-Strengthened-Balsa-Depron-Composite.pdf#page=426
Basu, R., & Ferreira, J. (2020). Understanding household vehicle ownership in Singapore through a comparison of econometric and machine learning models. Transportation Research Procedia, 48, 1674-1693. https://www.sciencedirect.com/science/article/pii/S2352146520306244/pdf?md5=ce396baaa396abdbf25538b2104f72e0&pid=1-s2.0-S2352146520306244-main.pdf
Bucsky, P. (2018). Autonomous vehicles and freight traffic: towards better efficiency of road, rail or urban logistics? Urban Development Issues, 58(1), 41-52. https://sciendo.com/pdf/10.2478/udi-2018-0022
Horn, M., MacLeod, J., Liu, M., Webb, J., & Motta, N. (2019). Supercapacitors: A new source of power for electric cars?. Economic Analysis and Policy, 61, 93-103.https://eprints.qut.edu.au/121172/1/__qut.edu.au_Documents_StudentHome_Group77%24_n8844577_Documents_PhD_Misc_EVdocs_Supercapacitors%20A%20new%20power%20source%20for%20electric%20cars.pdf
Ji, X., Zhang, Y., Mirza, N., Umar, M., & Rizvi, S. K. A. (2021). The impact of carbon neutrality on the investment performance: evidence from the equity mutual funds in BRICS. Journal of Environmental Management, 297, 113228. https://www.researchgate.net/profile/Muhammad-Umar-150/publication/353257462_The_impact_of_carbon_neutrality_on_the_investment_performance_Evidence_from_the_equity_mutual_funds_in_BRICS/links/60f542869541032c6d4e25b7/The-impact-of-carbon-neutrality-on-the-investment-performance-Evidence-from-the-equity-mutual-funds-in-BRICS.pdf
Kern, T., Dossow, P., & von Roon, S. (2020). Integrating Bidirectional Chargeable Electric Vehicles into the Electricity Markets. Energies, 13(21), 5812. https://www.mdpi.com/1996-1073/13/21/5812/htm
Koryagin, M. (2018). Urban planning: A game theory application for the travel demand management. periodica polytechnic transportation engineering, 46(4), 171-178.https://152.66.114.10/tr/article/download/9410/7826
Minh, N. K. (2020, April). Features and prospects of the electric vehicle in the Vietnamese automobile market. In IOP Conference Series: Materials Science and Engineering (Vol. 819, No. 1, p. 012007). IOP Publishing.https://iopscience.iop.org/article/10.1088/1757-899X/819/1/012007/pdf
Sadiq, M., Hsu, C. C., Zhang, Y., & Chien, F. (2021). COVID-19 fear and volatility index movements: empirical insights from ASEAN stock markets. Environmental Science and Pollution Research, 1-18. https://link.springer.com/content/pdf/10.1007/s11356-021-15064-1.pdf
Sun, S., & Sun, N. (2018). Management Game Theory (pp. XI-129). Singapore: Springer.http://ndl.ethernet.edu.et/bitstream/123456789/67572/1/447.pdf
Yin, J. Z., & Hamilton, M. H. (2018). The conundrum of US-china trade relations through game theory modelling. Journal of Applied Business and Economics, 20(8), 133-150.https://www.researchgate.net/profile/Michael-Hamilton-25/publication/331994158_The_Conundrum_of_US-
China_Trade_Relations_Through_Game_Theory_Modelling/links/5c9a44b7a6fdccd4603cc3d2/The-Conundrum-of-US-China-Trade-Relations-Through-Game-Theory-Modelling.pdf
BUECO5903 Assignment Sample
Instructions:
This assignment contains four questions. You are required to answer all four questions for assignment help.
This is an individual piece of assessment. Make sure your submission is an original
Submission - this means it must be the creation of the person submitting it.
You are required to explain your reasoning and use diagrams where appropriate.
Assessment weight: This assessment task constitutes 15 percent of the total assessment for this course.
Due date: Your instructor will advise you of the submission date of this assessment task.
Assignment to be submitted electronically in the drop box in your Moodle shell.
Question 1
a) Give the definition of GDP and explain what items are not included in its calculation?
b) How is GDP calculated using the expenditure approach?
c) How is GDP calculated using the income approach?
d) Explain the problem of "double-counting" and how it can be avoided in calculating GDP
Question 2
Assume that an economy is initially operating at the natural rate of output (full employment output). Use the AD-AS model to illustrate graphically the effects on price and output of an increase in government spending and a decrease in the cash rate. Explain your assumptions with respect to the range of aggregate supply of your analysis.
Question 3
Explain in detail the process of Monetary Policy transmission of an increase in the cash interest rate. Use relevant graphs to describe how a Central Bank’s action on the interest cash rate ripple through the economy and lead to the target policy goal. (Three connected diagrams should be used: (1) money supply and demand (2) investment demand schedule (3) AS/AD diagram. Interest rates is the variable that connects the first and second diagram).
Question 4
Using the World Bank’s World Development Indicators database, https://databank.worldbank.org/home.aspx,
a) Complete the following table.
*or latest available year
b) Produce a plot for each variable (GDP, gdp growth, inflation) comparing the four countries.
c) What can be inferred with respect to economic growth and price control in each of these economies?
Solution
Answer 1:
A - In macroeconomics, GDP or Gross Domestic Product represents total value of entire economic activities that take place in a country in a specific period of time, for example, one year (Dynan and Sheiner 2018). In measuring GDP, total market prices of all final goods and services, which are produced in a specific geographic location in a particular year, are considered.
In measuring GDP, some items are not considered. These are:
i. Goods and services, manufactured in other countries and imported
ii. Goods and services produced in previous year
iii. Goods and services, which are resold
iv. Goods and services that are sold in illegal process
v. Transfer payments
vi. Intermediate goods that are used as input in producing another good
B - GDP can be measured with the help of expenditure method. This method considers expenditures of all groups, which conduct economic activities in a year. In other words, this method considers all the expenditures that are made on final goods and services (Magdalena and Suhatman 2020). In this measure, four components are considered and these are private consumption (C), government spending (G), investment (I) and net exports (NX) (total exports- total imports). Hence, the formula of GDP using expenditure method is written as:
GDP = C+I + G +NX
C. In measuring GDP of a country, the income approach can be applied. This approach considers income of all production factors, which are, labour, capital, land and entrepreneur. Those factors contribute in the production of final goods and services of the country in a year. Consequently, labour, capital, land and entrepreneur receive their income in the form of wage, interest, rent and profit, respectively (Aitken 2019). Income approach depends on the accounting reality where all expenditure made on economic activities within the country equates with total income of all factors that produce final goods and services.
D. One can face the problem of double-counting at the time of measuring GDP of a country in a particular year. Double-counting implies the process of adding a product value for two times in the GDP measurement (Fforde 2021). To avoiding this problem of multiple counting, the value of final goods and services are not considered. Instead, the value-added method is considered in which value added in each stage of production is taken.
Answer 2:
In the vertical range of the Aggregate supply curve, an economy can produces output at its full employment level. At this stage, the movement of aggregate demand can change the price level only while output level remains unchanged. As the government spending increases, it leads the aggregate demand curve to move upward (Lisi 2021). Moreover, a decrease in the cash rate leads the borrowers to borrow money for investment and consumer expenditure purpose. As a result, the aggregate demand curve can shift upward. The situation is shown below:
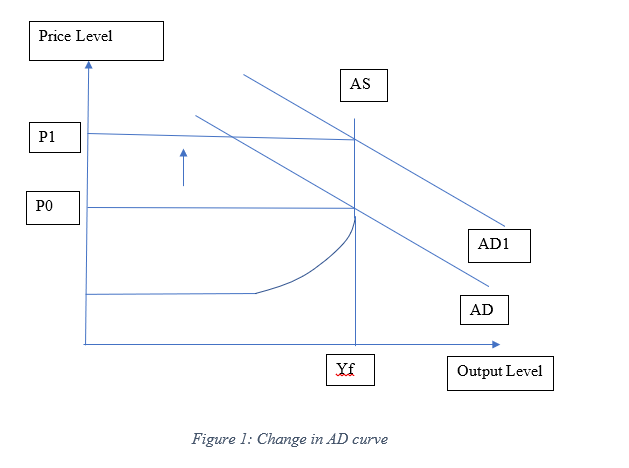
It is seen that as the AD curve shifts upward from AD to AD1, the price level will also increase from P0 to P1. On the other side, the output level will remain unchanged as it will be at the vertical segment or Classical range of the AS curve.
Answer 3:
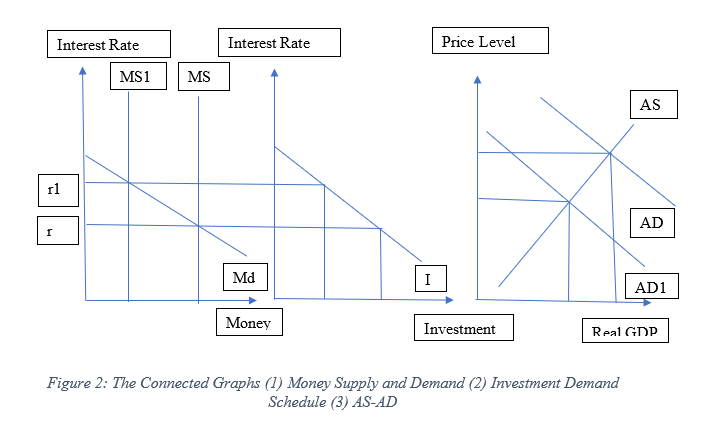
The Monetary Policy Transmission is a process of changing cash rate. The process influences both the economic activity and inflation in the economy. As cash rate rises, expenditure in the private sector declines and it further influences total productivity of the firms to decline. This in turn cause economic activity and total employment to decrease (Chatziantoniou, Gabauer and Stenfors 2021). The following diagram shows the activity of the Central bank on the interest cash rate ripple. Here, the interest rate is taken as variable in the first two diagrams. The first diagram represents money supply and money demand curves, the second diagram represents investment demand schedule and the third diagram represents aggregate demand and supply curves.
Answer 4:
a.
b.
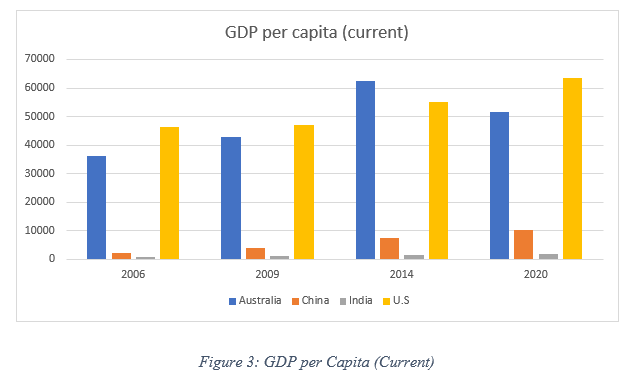
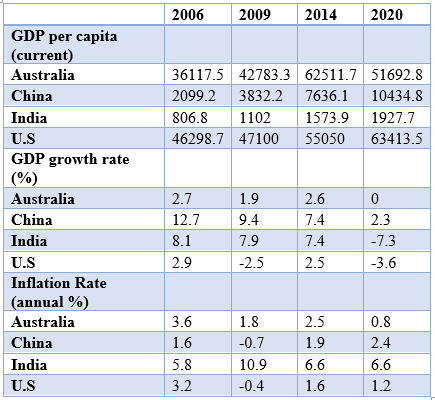
In figure 3, GDP per capita of Australia, China, India and US are compared for the years 2006, 2009, 2014 and 2020. In 2006, the GDP per capita of US was the highest followed by Australia. However, GDP per capita of China and India remained very low comparatively. The situation remained same in 2009. From figure, it is seen that GDP per capita of Australia and China increased in this year compared to that in 2006. In 2014, Australia’s GDP per capita increased considerably and it surpassed US. Moreover, China’s GDP per capita also increased in this year. In 2020, GDP per capita of the US, China and India increased while that of Australia declined.
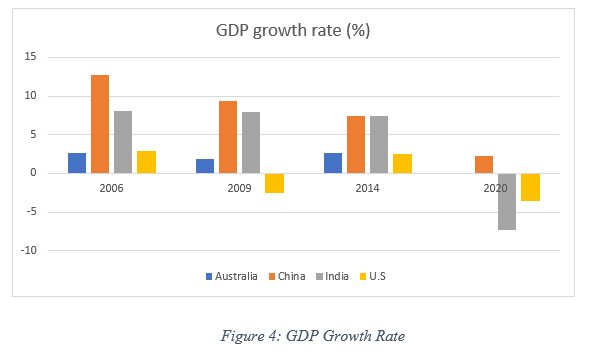
As per figure 4, GDP growth rate of China remained the highest in 2006 followed by Indian, US and Australia. In 2009, GDP growth rate of each country declined while that of US became negative. In 2014, US’s GDP growth rate was improved and became positive. In 2020, the GDP growth rate of Australia was nil while that of India and US were negative.
Inflation rate of India remained the highest in 2006, 2009, 2014 and 2020 compared to other countries. On the other side, Inflation rate of US and China became negative in 2009 which means these countries faced deflation.
c.
From the comparisons, it is understood that India needs to control its price for controlling inflation. China has gained significant economic growth over the years while Australia has also successfully maintained its economic growth.
References:
Aitken, A., 2019. Measuring welfare beyond GDP. National Institute economic review, 249, pp.R3-R16.
Chatziantoniou, I., Gabauer, D. and Stenfors, A., 2021. Interest rate swaps and the transmission mechanism of monetary policy: A quantile connectedness approach. Economics Letters, 204, p.109891.
Dynan, K. and Sheiner, L., 2018. GDP as a measure of economic well-being. Work. pap, 43.
Fforde, A., 2021. Measuring economic transformation–what to make of constant price sectoral GDP–evidence from Vietnam. real-world economics review, p.113.
Lisi, G., 2021. Can the AD-AS Model Explain the Presence and Persistence of the Underground Economy? Evidence from Italy. Economies, 9(4), p.170.
Magdalena, S. and Suhatman, R., 2020. The Effect of Government Expenditures, Domestic Invesment, Foreign Invesment to the Economic Growth of Primary Sector in Central Kalimantan. Budapest International Research and Critics Institute-Journal (BIRCI-Journal), 3(3), pp.1692-1703.
Worldbank 2022. World Development Indicators | DataBank. Available at: https://databank.worldbank.org/indicator/NY.GDP.MKTP.KD.ZG/1ff4a498/Popular-Indicators (Accessed: 22 January 2022).
ECO500 Economics for Business Assignment Sample
The Problem/Scenario
Suppose that a new strain of Covid 19, known as Kappa, has been detected in Australia. Kappa is known to be twice as infectious than the existing variants of Covid 19. Kappa has been found also to be immune to the existing Covid 19 vaccines such as Pfizer and Astrazeneca.
KC Pharma, a local startup company, has produced a unique nasal spray vaccine called KC1 that has been found to be 98 per cent effective against Kappa in clinical trials. Based on this information the Therapeutic Goods Administration (TGA) of Australia, Australia’s regulatory body, has approved the use of KC1 in Australia in the short run to combat Kappa. Based on the above scenario, provide a project report on market structures, market model(s), economic strategy(ies) and profitability scenarios. In your assignment writing, you shall include the following issues clearly and sufficiently with diagrams and illustrations where necessary for assignment help:
1. Identify the basic market structure and explain the type of market in which KC Pharma will be operating
2. Based on your answer to question 1 above, show a theoretical market model explaining the
equilibrium position (profit/loss situation) of KC Pharma in the short run.
3. Suppose you are the economic adviser to KC Pharma. Suggest a selling strategy to KC Pharma whereby it can further maximise its profit. Make sure you clearly illustrate the selling strategy to KC Pharma.
4. Critics of TGA argue that KC Pharma is charging a very high price for KC1 and is also unable to keep up with demand. They argue that more firms should contest the market to create efficiency in the market. TGA is convinced by the Critics’ arguments and allows a “large” number of firms to supply vaccines to combat Kappa. Assess and evaluate in which market structure(s) and the type of market(s) KC Pharma will be operating. In your demonstration, you must explain KC Pharma’s equilibrium position after the entry of large number of rivals in the market.
5. Analyse and evaluate economic profitability of KC Pharma in the long run.
Solution
Answer 1:
KC Pharma will operate in an oligopoly market, which is a form of imperfect market condition. In this market structure, few firms compete with each other and produce differentiated products. As per the given scenario, KC Pharma has produced a unique nasal spray vaccine, KC1. However, the company have close competitors like Pfizer and AstraZeneca which produce COVID-19 vaccines that are also safe for people. These companies have captured a large share of the market. This is because new firms cannot enter into the market easily due to legal restrictions the Therapeutic Goods Administration (TGA) of Australia, large amount of capital investment and low economies of scale.
Answer 2:
The oligopoly market is characterised by entry barriers and existence of limited firms. The main feature of the market is interaction as well as interdependency among existing firms. In other words, the action of one firm can influence the action of other firms in the market. Therefore, the oligopoly market often experiences strong competition between firms as each firm has the capability of making decisions on quantities, prices, and advertisement in order to maximise profits (Azar and Vives 2021). As the market is concentrated extremely with few companies, some firms can dominate the industry while other small firms can also perform their business. Likewise, Pfizer and AstraZeneca dominate the vaccine market while a start-up company like KC Pharma can also produce and sell its products. The start-up company can maximise its profit when its marginal revenue (MR) and marginal cost (MC) equate with each other. This situation creates an equilibrium condition where the firm produces equilibrium amount of vaccine at an equilibrium price. The start-up company, here, will experience a kinked-demand curve due to the competition of other oligopolistic firms. In Kinked demand curve model, two theories are seen, which are:
A. If a firm declines its price below the prevailing level then other rival firms will follow him
B. If the firm rises the price above the prevailing level then other rival firms will not follow him
The profit-making equilibrium condition of KC Pharma is presented in the figure below:
Figure 1: Short-run Profit maximisation condition of KC Pharma
The short-run profit maximisation condition of KC Pharma is shown with the help of kinked demand curve theory (Salehi and Makiyan 2021). As per the theory, each firm in the oligopoly market sells differentiated products and each of them experiences two market demand curves for its product. Thus, KC Pharma also faces two different demand curves where at high prices, the firm has comparatively elastic demand curve and at low price the firm has relatively inelastic demand curve. Corresponding to two demand curves, the firm has two marginal revenue curves accordingly. These two demand curves intersect at point k. Here, the MR and MC curves intersect at point E. Therefore, equilibrium quantity of KC Pharma is Q* and equilibrium price is P*. As per the assumption, if KC Pharma increases its price above P* then other vaccine producing firms will not follow the increase in price and hence the company will experience the more elastic market demand curve. If the company will decrease price below P* then it is assumed that other competing firms will follow the price. The main reason of these assumptions is that when KC Pharma will increase its price, it will face a substantial decrease in sales as consumers can purchase similar products from other companies. On the other side, if KC Pharma will reduce its price, other firms will follow it due to the fear of customer loss.
Answer 3:
To increase profit further, KC Pharma can make collusion with other companies. In collusive oligopoly, firms make agreement between each other to make an undifferentiated oligopolistic industry. Here, all vaccine producing firms come together and agree to set prices as well as outputs for maximising total industry profits which is known as cartel (Schlechtinger et al. 2021). Thus, the company along with its competitors can set price in a collective way by the leadership of one firm instead of taking prices from the market. In this situation, profit margin becomes higher compared to that in a competitive market. Sometimes, governments do not support collusion and price-fixing. However, in case of vaccination, the industry can get the permission of fixing price by making a cartel.
The kinked-demand theory has several limitations for which the industry can move to make a cartel for making higher profits. Firstly, the kinked model does not state the condition by following which a firm can find its kinked point in the market demand curve. Secondly, the theory does not consider the chances of collusion and setting a fixed price and output. Lastly, the kinked-demand model shows that price increase by one firm will not be followed by other firms. Hence, considering these obstacles, it can be said that a cartel is better for KC Pharma to make higher profits.
Now it is essential to discuss the selling strategy that KC Pharma will follow for maximising its profit. The company needs to make a formal agreement with other vaccine producing companies in order to control supply and to manipulate price. Therefore, collusion will form a group of independent business that will perform as a single seller at the fixed price for the vaccines they produce without any competition. In this context, it is essential to mention that a cartel gets less facility compared to that of a monopoly where only a single seller only owns certain products in the market. The cartel of vaccine producing companies will help to set a fixed price for vaccines in a legal way. After forming cartel, each company will select their combined output where their marginal revenue becomes equal with marginal cost. The fixed price of cartel, therefore, will be determined by market demand curve where the cartel selects its output level. By forming a cartel, the vaccine producing firms can charge higher prices together for certain quantity of vaccines like a monopolist. The figure below reflects the situation:

Figure 2: Collusion in the Oligopoly market
The above figure represents a cartel where each firm together set price P2 and produces Q2 quantity of output. At this output level, MR and MC become equal with other. Hence, each firm can earn supernormal profit by the area P1BA2. Therefore, by making a cartel, KC Pharma can successfully earn profit.
However, the company needs to follow some points that can breakdown a cartel. Sometimes, it is seen that other firms have cheating tendency on their quotas for getting higher benefits from higher output and price. Hence, the firm needs to make cartel with small number of firms so that it can easily observe behaviour of others. Moreover, penalties will be charged for each firm who will break quotas.
Answer 4:
As per the given situation, KC Pharma will operate in a monopolistically competitive market. This market structure lies between a monopoly market and a perfectly competitive market. In this type of market, large number of firms produces and sells almost similar type of products in the market to a large number of customers. In this market, each firm will produce products that are close substitutes and hence they can differentiate their products by applying different market strategies. Thus, firms can act as a monopolist as each of them has different brand name, price level and product quality. Like a monopoly market, firms can charge higher prices for selling lower quantity of output than a perfectly competitive market. Therefore, each firm acts like a price maker in this imperfect competition where change in price will not cause any price war that can be seen in the oligopoly market. A monopolistic competitive firm achieves higher profit only in the short-run when its marginal revenue and marginal cost become equal. Moreover, the firm can also incur loss in or gain normal profit during this time. The figure below represents a condition, where the firm gains supernormal profit in the short-run:
TGA allows a large number of firms to supply vaccines for combating Kappa, which is produced by KP Pharma. Therefore, the number of vaccine sellers will increase in the market. However, one type of vaccine cannot substitute another type of vaccine completely as they can be differentiated by their company name, branding, price level and quality. Therefore, each vaccine producing firm will act like a monopolist and can set vaccine price individually in the market for maximising profit (Bertoletti and Etro 2022). Though firms can act like a price maker, they cannot charge higher prices due to strong competition in the market. By charging higher price, a firm can loss its customers and this in turn can reduce profit-making condition of the firm. The diagram above showcases equilibrium position of KC Phrama here the demand curve is slightly elastic. This indicates that if the firm increases price of its vaccine then its demand for product can be declined.
Figure 3: Super Normal Profit of the Monopolistically Competitive Market in the Short-run
In figure 4, it is seen that the short-run equilibrium can be obtained at point E where marginal cost (MC) curve and marginal cost (MC) curve intersects. Hence, the corresponding equilibrium output and price level become Q* and P*. In short-run, the average cost (AC) curve is lower than average revenue (AR) curve. Average revenue curve which is also the demand curve of KC Pharma is elastic but not perfectly elastic as it has negative slope. Hence, the firm gains economic profit by the area CBAP*. In short-run, the monopolistic competitive firm can also face loss if its average cost becomes higher than average revenue.
However, it is essential to mention that a monopolistically competitive firm does not become allocatively efficient as the price does not equal to marginal cost. Moreover, production efficiency also cannot be seen in the market as firms can set higher price than their marginal costs, which means, P > MC. Therefore, the market cannot achieve efficiency level instead of facing competition.
Answer 5:
In long-run, the monopolistically competitive market has free entry and exit and this implies that the existing firm can make only normal profit in the long-run. In other words, when the market gains supernormal profit in the short-run, other firms will enter into the market. This will increase the number of firms and hence their profit making opportunity will decline until it will earn normal profit only.
The following figure showcases equilibrium position of KC Pharma when it will operate in the monopolistically competitive market.
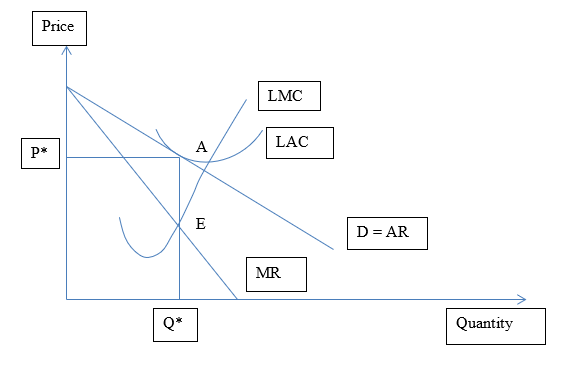
Figure 4: Monopolistically Competitive Market in the long run
As per figure 4, it is seen that the long-run equilibrium can be obtained at point E where long-run marginal cost (LMC) curve and marginal cost curve intersects. Hence, the corresponding equilibrium output and price level become Q* and P*. In long-run, the firm will operate somewhere to the left of the average cost (LAC) curve’s minimum point. Average revenue curve which is also the demand curve of KC Pharma is elastic but not perfectly elastic as it has negative slope. The left side of LAC curve becomes tangent with the AR curve and hence the firm only gets normal profit.
References:

ECO600 Economics and Finance for Business Assignment Sample
Instructions
1. Answer ALL four (4) sections. They contain short-answer questions. There are NO multiple-choice questions.
2. Keep your answers WITHIN 500 words per section.
Weighting 40%
Word Count Maximum 2,000 words
Section 1: Ethical enterprises in the modern economic system: the circular economy (10 marks; length: max. 500 words)
Background
You are hired as the sustainability manager of Manly Golf Club. It is in Sydney, not too far away from ICMS’s main campus.
Learn about the golf club, its facilities, and the services it provides here, in this website.
To distinguish itself from rival golf clubs in the area, this club is under pressure to demonstrate its circular economy credentials.
It has hired you to propose strategies that apply the circular economy principles to all aspects of its operations.
Question
1. Propose four (4) circular economy strategies, two for each of this golf club’s two services:
(i) Golfing
(ii) Weddings and functions
Where possible, demonstrate how each strategy could be good/profitable for the business.
Section 2: International trade and development (10 marks; length: max. 500 words)
Background
Papua New Guinea is a large island country north of Australia. It has a largely underdeveloped economy: it mostly exports raw materials such as timber and copper.
It does not have a large manufacturing base, relying instead on importing manufactured goods from abroad.
To learn about the country, go here. To learn about its economy, go here.
To see its low and high complexity exports, use Harvard University’s Atlas of Economic Complexity (click here):
- Enter the country’s name and click ‘start exploring’
- Find the section called ‘Export basket’ (the products it exports).
- Lastly, click on ‘Export complexity’ near the bottom.
Question
1. Select one (1) export item from this country whose complexity is low.
Then, follow these three steps:
First: propose how this item’s complexity could be improved using creativity, innovation or value-adding. Provide interesting detail. Argue why your proposals might be beneficial for this country’s economy.
Second: which country or region would be good target markets for this export, and why?
Third: suggest any trade-related policy that could help this country in this project.
Section 3: Macroeconomic fundamentals (10 marks; length: max. 500 words)
Background
Maldives is an archipelagic country made up 1,200 islands of which only around 200 are inhabited. It has a population of 540,000 people. It is located to the south of India, in the Arabian Sea.
The economy is heavily reliant on tourism, which is its largest ‘export’ industry by far, followed by seafood exports (fish, prawns etc.)
Macroeconomic situation
Since 2012, Australia’s inflation rate was around 2% and falling, before rising sharply in 2022 to almost 4% as COVID-19 restrictions were largely removed (go here, click on ‘10Y’ button to see the last 10 years’ trend).
In contrast, Maldives inflation in 2012 was almost 20%, fell to 5% in 2018, and was mostly negative (between 0% and -5%) since then. Analyse Maldives inflation rate since 2018, by going here and clicking on the ‘10Y’ button. See how it looks like, in contrast to Australia’s.
Analyse Maldives unemployment rate, here (click on the ‘50Y’ button for a long historical perspective. Analyse its balance of trade, here (click on the ‘25Y’ button).
Contrast that to Australia’s unemployment and balances of trade (see here and here, click the ‘25Y’ button). You may investigate these and other macroeconomic measures more on the Internet.
Question
1. By contrasting Maldives and Australia’s macroeconomic measures up to today in 2022, assess which phase of the business cycle Maldives is likely to be in (see here to learn about the business cycle). Justify your answer.
2. You are the general manager of the Four Seasons hotel chain in the Maldives. Given your analysis of the business cycle above:
(i) assess whether it might be a good idea for Four Seasons to invest in expanding its hotel operations in the Maldives
(ii) assess issues involved in hiring new hospitality managers and other workers for its hotels.
Section 4: Fiscal, monetary and supply-side policy (10 marks; max. 500 words)
Background
Country X is a developing country with a large government bureaucracy that is quite inefficient. The processing of applications to start new businesses are slow.
This country also has generous unemployment benefits: its unemployed citizens receive a generous payment that allows them to pay for rent and food such that there is little motivation for some of the unemployed to look for jobs.
The key macroeconomic measures of Country X over time– from two years ago to the present– are shown below. Examine them carefully. They are expressed in quarters (quarters means in chunks of three months):
(a) GDP growth: -2%, -1%, -2%, 14%, 5%, 3%, 2%, -1%
(b) Unemployment rate: 8%, 9%, 10%, 6%, 6%, 5%, 5%, 8%
(c) Inflation rate: 2%, 2%, 1%, 3%, 3%, 1%, 0.5%, 0.5%
(d) The purchasing managers’ index, PMI, in the manufacturing sector: 47, 48, 49, 49, 45, 48, 46, 45
The current official interest rate is 4%.
Question
Monetary policy
Given the macroeconomic information above about this country’s economy:
1. Would this country’s central bank be likely to increase or decrease its official interest rate or maintain it at the same level? Why do you say that?
Next, based on your answer above, assess how that action might affect or transmit to each of these, with sufficient detail and discussion:
(a) consumer spending (C) and business investment (I)
(b) the unemployment rate
(c) the inflation rate
(d) the currency’s exchange rate, assuming all other things being equal (will the currency’s value tend to appreciate or depreciate, and why?)
(e) the exchange rate’s effect on the country’s exports, assuming all other things being equal (could the trade balance move towards a surplus or a deficit?)
Solution
Section 1
Question 1
(i) Golfing
- With respect to Cao, L., 2020, the implementation of coordinating the circular value chains with the help of data which is a circular economic strategy supports the preparation of products for recycling for reusing the data. If the Manly golf club uses the data of different players and collects detailed information related to the style of playing the golf, creates an effective plan for the different golf games. The purpose of implementing this strategy helps the golf club to understand the gameplay of the players and create potential golf courses for adding challenges and providing a high level of satisfaction to the players or the customer of the golf club. Through this process, the Manly golf club increased the profitability of the business and also met the satisfaction requirements of the customers or the players.
Rethink: The principle of rethink is applicable in this strategy for creating an effective golf course for the player and also understanding the playing style of the player. It adds up value to the product and makes it a potential product for best assignment help.
.png)
Figure 1: Coordinating the circular value chains
(Source: https://www.boardofinnovation.com/circular-economy-business-models)
- Overview of the Kim, 2019, this strategy of circular product design of circular economic strategy helps for the preparation of different products to recycle for reusing the killed information of the players and game field. At any rate, the Manly golf club effectively uses the potential data of the different players and also it collects detailed information related to the different levels of players then it will create a potential golf course for the players. The purpose of implementing this strategy helps the golf club to understand the gameplay of the players and create potential golf courses for adding challenges and providing a high level of satisfaction to the players or the customer of the golf club.
Reduce: The above strategy helps to increase the efficiency level of the golf club and also provides various resources to the players. Providing a higher value of a product to the players creates a high level of satisfaction rate for the customers.
.png)
Figure 2: Circular product design
(Source: https://www.boardofinnovation.com/circular-economy-business-models)
(ii) Weddings and functions
- Based on the analysis of the Kimanzi, M.K. and Gamede, 2020, the strategy of collection and reserve logistics of the circular economic strategy creates a potential environment and complementary services for the customers. With the help of this strategy, the different occasions and wedding functions can be effectively operated in the hotel of the Manly golf club. It is based on the life cycle of the product and the method of reselling. This process implements appropriately in the function section of the golf club which helps to increase the value of reputation and profitability of the golf club.
Repurpose The strategy is based on the method of re-selling which is the main purpose of the concept. The repurposing of the different products can be helpful for the golf club.
- With respect to Klopotan, I., Zoroja, J. and Meško, 2018, the application of the sorting and the pre-processing with the help of data which is a circular economic strategy supports the preparation of products to recycle for reusing the data. This process helps to optically use any alternative products and services during the wedding function and occasions for the creation of different products.
Recover: With the help of the above strategy, the golf club can effectively reuse the data for better purposes in the upcoming course of time. It will help the business of the golf club to increase in the upcoming course time.
Section 2
Question 1
According to the website, the selected export item is timber from the country Papua New Guinea which is standing in the low category of the complexities. It is one of the large Islands on the Norton side of Australia. The economic level of the country is underdeveloped
- In respect to Lamperti, F., Monasterolo, I. and Roventini, 2019, improvement can be done by creating valuable exporting relationships with other countries by exporting the timber and also the products which are made out of the timber. At the time of harvesting the timber, the scrap material and waste timber materials can be used to create potential artefacts which increase the profitability of the country. The scrap or the waste timber which is going to be thrown away now creates valuable artefacts which have a higher rate than the value of timber in respect to the art. On the other hand, the country needs to create relationships with developed countries for exporting the timbers and artefacts. For instance, if the buyer country of the timbers and artefacts of the country is the USA then the underdeveloped country Papua New Guinea can sell the timbers and artefacts at a high price. This process will be highly beneficial to the country and help to increase the rate of GDP and profitability at the same time.
- Based on the analysis of the Mian, A. and Sufi, 2018, to increase the profitability and improve the business quality of the underdeveloped country Papua New Guinea, the selected country origin for effective targeting market will be the developed countries such as the US and UK. The purpose behind selling the product to the US or the UK is due to the higher rate of currency and also the quality market segment. If the buyer country of the timbers and artefacts of the country is the USA or the UK then the underdeveloped country Papua New Guinea can sell the timbers and artefacts at a high price. This process will be highly beneficial to the country and help to increase the rate of GDP and profitability at the same time. Therefore, the country will get a high level of benefits and also the potential market segment which increases the profitability of the country decently.
- Based on the overview of the Pillay, S., Rajaram, R. and Ramnanun, 2020, the multilateral trade policy will be helpful for the country Papua New Guinea to maintain an agreement of commerce between the two countries by signing the treaties for the import and export of timber and artefacts made out of the timber materials. It will help the country to maintain a decent level of trade with developed countries which increases the profitability and helps the country to grow and develop in the coming course of time.
Section 3
Question 1
- According to the abstraction of the Rusydiana, A., Sanrego, Y. and Rahayu, 2021, after the investigation process, it is found that the business cycle of the Maldives is going towards a recession period. The forecasting range of the unemployment rate in the Maldives is going to be increased in the upcoming course of time which refers to the business cycle of recession. On the other hand, the macroeconomics level of the country is also going to decrease in the coming course of time due to safety and health reasons. The factor of safety and health reasons impact the entire business cycle of the country because the main occupation of the country is based on tourism which is going to be restricted in the upcoming course of time. The output level of revenue and GDP of the country is going to decrease due to the increasing unemployment rate in the country. It is also observed that the inflation rate of the country has been increasing for consecutive years which also impacts the profitability and the ability to generate revenue by tourism. Therefore, it is clear that the country is going forward into a recession period in the upcoming course of time.
Question 2
- According to the analysis of the Rusydiana, A.S., Sanrego, Y.D. and Pratomo, 2021, after evaluating the financial business cycle of the country, it is not the appropriate time to invest in the expansion of the operations of the hotel in the country because of the decision period in which the inflation did become higher than the normal level and also the rate of unemployment increased. If the value of unemployment rate increases it will create a flood of working employees in the hotel and after the decision period most of the working employees are going to leave the hotel which creates an operational gap in the business. It also negatively impacts the growth and development prospect of the hotel. Therefore, the four-season hotel in the Maldives does not need to increase the expansion of the operation factor of the business.
- With respect to the overview of the Vogel, H.A., 2019, if the four-season hotel appoints a new manager for operating the hospitality operation then it will be beneficial for the entire hotel. The hotel needs to understand the purpose and perspective behind hiring anywhere manager for the hospitality section. The hiding of a new hospitality section of the hotel is beneficial but on the other hand, the hiring of various workers will negatively impact the overall productivity and profitability of the hotel. Therefore, the hotel can hire a new manager for the hospital section but the hiding of new workers will create conflict in the financial activities and transactions of the hotel.
Section 4
Question 1
Based on the analysis of Lamperti, 2019, the central bank of the country needs to increase the current official interest rate because of the negative rate of the GDP and the inflation rate. The country to maintain years’ financial value concerning the GDP rate. Therefore, the country needs to increase the interest rate for combating the financial environment. The central bank of the country needs money in their account rather than into the account of the customer.
(a) If the central bank of the country increases the interest rate then the consumer spending will become less because the citizens of the country will deposit their money into the bank and through this, the central bank will be able to fluctuate the level of inflation in the country. On the other hand, the business investment will remain the same or slightly decrease due to the increase in the interest rate which is comparatively safer than an investment in any other business organisation. Therefore, it helps to maintain the level of inflation in the country.
(b) The rate of unemployment in the country will decrease due to the higher interest value which provides courage to the people for finding a job and depositing their salary into the bank account through which the rate of interest is higher compared to the current situation of the time.
(c) If the central bank of the country increases the interest rate then it motivates the citizens of the country to deposit their money into the bank and through this, the central bank will be able to fluctuate the level of inflation in the country. Similarly, if the rate of inflation in the country is managed then the purchasing and consumption power of the citizens of the country increases. As the purchasing and consumption power of the customer increases in the country, it will provide a sustainable and lower inflation rate for the country.
(d) As it is discussed in the above section if the rate of interest of the country increases then the value of the currency of the country will also increase. This factor is the impact of the rate of interest if the citizens of the country deposit their money into the bank accounts which helps the country to manage the value of the currency. The exchange rate of the currency will also increase due to the sound base of the company.
(e) If the value of the currency of the country increases then it also impacts the process of import and export of the country. As the value of the currency of the country increases then it will provide a positive impact on the exporting of the products and goods to the different countries. The increased rate of interest provides a circular during the time of export of the goods and services to the different countries. This process will positively impact the process of export in the country in the appropriate method.
Reference
.png)
BUECO5903 Business Economics Assignment Part A Sample
Instructions:
This assignment contains five questions. You are required to answer all five questions. This is an individual piece of assessment. Make sure your submission is an original submission; this means it must be the creation of the person submitting it. You are required to explain your reasoning and use diagrams where appropriate.
Due date: Your instructor will advise you of the submission date of this assessment task. Assignment to be submitted electronically in the drop box in your Moodle shell.
Question 1
Using a production possibilities frontier (PPF) diagram, determine how does the PPF change in response to the events describe below. Make sure to explicitly indicate what sectors you are representing, and what sort of assumptions each event implies (i.e., a neutral effect vs a sector-biased effect). The latter follows from your assumptions on the factor intensity of the sector you are representing.
a) A relaxation of policies allowing more foreign direct investment into the country.
b) Increasing the minimum wage level.
c) A decrease in expenditure on research and development.
d) An increase in the retirement age.
e) Government policies supporting the provision of services, without affecting manufacturing.
Question 2
For each of the events describe below, you are required to explain:
1. The market you are evaluating (e.g., labour market, automotive market, etc).
2. Does the event act on the demand side, supply side, or both sides of the market?
3. Does the event lead to a quantity or price change? Or does the event lead to a shift in demand, supply, or both?
Make sure to explain what sort of assumptions you are making on the elasticities of demand and supply (when plotting your demand and supply, describe whether you are assuming an elastic or inelastic demand/supply).
a) A concerted reduction in the total production level in oil markets.
b) The implementation of a minimum wage.
c) The implementation of subsidies to agricultural production in Australia
d) The implementation of a Carbon tax in the resources exploitation sector. A Carbon tax is charged according to the level of emissions of greenhouse gases in an economy.
e) The implementation of a new loan program to university students in the education sector
Question 3
Compare the impact of a recession that reduces consumer income by 10 percent on the consumption of durable goods and house rentals. Suppose that the income elasticity of demand for durable goods is 1.5 and the income elasticity of demand for house rentals is 0.3. Based on your response, make a policy argument to support through government funding either businesses or house rentals.
Question 4
Using a supply and demand analysis show first the labour market in equilibrium, and then show
a) the effect of a reduction in the demand for labour as a consequence of a pandemic.
b) The effect of a government subsidy to producers to restore the employment of labour.
Provide a diagram with clear axis details. Make sure to explain what sort of assumptions you are making on the elasticities of demand and supply.
Solution
Answer 1:
a.
Here, agricultural and service sectors are represented. Assume the economy produces good X which is capital-intensive in service sector and good Y which is labor-intensive in agricultural sector. Hence, more foreign direct investment will create sector-biased effect as the production of good X will increase keeping the production of good Y unchanged. This situation is drawn in the figure below:
.png)
Figure 1: Production Possibility Frontier: Sector-Biased Effect
b.
Again consider good X in the agricultural and good Y in the manufacturing industry. Good X is capital intensive and Good Y is labour intensive. For Assignment Help, Increasing the minimum wage level will help the industry to get more labourers for producing good Y while the production of good X will also increase but by a smaller rate (Arnold, Arnold and Arnold 2022). Hence, the situation implies sector-biased effect.
.png)
Figure 2: Production Possibility Frontier: Sector-Biased Effect
C.
Consider two industries, service and manufacturing industries are operating in the economy. As expenditure on research and development (R&D) declines, the service sector can increase its total production by conducting more research work. Furthermore, manufacturing sector can also increase its total production due to increasing R&D. Hence, the economy will experience a neutral effect on the PPF.
.png)
Figure 3: Production Possibility Frontier: Neutral Effect
d.
Suppose the economy has manufacturing sector and service sector. An increase in the retirement age will help both sectors to get a large number of skilled and experienced labour force. Hence, production in both sectors will increase and a neutral effect can be seen on the PPF.
.png)
Figure 4: Production Possibility Frontier: Neutral Effect
e.
The economy has both service sector and manufacturing sector. Government policies are implemented to support the provision of services though these do not influence manufacturing process. Hence, production in the service sector will increase keeping total production in manufacturing sector unchanged. Thus, a sector-biased effect can be seen on the PPF.
.png)
Figure 5: Production Possibility Frontier: Sector-Biased Effect
Answer 2:
A.
.png)
Figure 6: Change in supply in the oil market
The condition is based on the oil market. The concerted reduction in total production of oil will affect the supply side. Oil market has inelastic demand and supply. This is because, supply of oil cannot be increased suddenly and demand for oil does not change significantly with its price change. Figure 6 depicts the situation from where it is observed that equilibrium price will increase to P1 and equilibrium quantity will decrease to Q1.
b.
.png)
Figure 7: Change in supply in the labour market
The condition is based on the labour market. The implementation of a minimum wage will affect the supply side of labour if the wage rate will impose above the market wage rate. Labour market has elastic demand and supply. This is because, demand and supply of labour can be changed significantly by a small change in its wage. The condition of implementing minimum wage is shown in Figure 7. Here Wm is the minimum wage which is higher than market wage W0. Hence, an increase in labour supply by N1N2 are can be seen in the economy.
c.
.png)
Figure 8: Change in supply in the agricultural market
The condition is based on the agricultural market. The implementation of subsidies on Australian agricultural product will affect supply side. Agricultural market has elastic demand and supply. The implementation of subsidy will encourage farmers to produce more amount of agricultural products. Figure 8 depicts the situation where supply curve increases from S0 to S1. Thus, equilibrium price declines to P1 and equilibrium quantity increases to Q1.
d.
.png)
Figure 9: Change in supply in the Energy market
The condition is based on the energy producing market. The implementation of a carbon tax as per the level of greenhouse gas emission will affect the supply side of energy production. Energy market has inelastic supply due to the limited resource. The condition of decreasing supply of energy resource is shown in Figure 9. Here market price of energy increase to P1 from P0 and energy supply will decline to Q1 from Q0 due to imposition of carbon tax.
e.
.png)
Figure 10: Change in supply in the Energy market
The condition is based on the energy education market. The implementation of a new loan program will increase demand for education among university students. Education has inelastic demand as it is necessary for everyone. The condition of increasing demand for education is shown in Figure 10. Here market price of education increases to P1 from P0 and equilibrium quantity declines to Q1 from Q0.
Answer 3:
When income elasticity of demand becomes greater than 1 then it implies that the good is luxury item. On the other hand, income elasticity of demand less than 1 implies that the good is necessary item. For durable goods, the income elasticity of demand is 1.5 and income elasticity of house rental is 0.3. Hence, as per the given condition, durable goods are luxury items and house rentals are necessary items (El Shagi, Sawyer and Tochkov 2022). Thus, government needs to implement funding policy on house rents so that people can afford it easily.
Answer 4:
Labour demand curve has a negative slope showing an inverse relationship between real wage of workers and amount of labour. Labour supply curve is upward rising as it shows a positive relationship between real wage and amount of labour. The supply curve expresses a tradeoff between labour and leisure and hence it bends slightly at the upper portion.
.png)
Figure 11: Labour Market Equilibrium
a.
The impact of decreasing labour demand due to pandemic is shown in figure below:
.png)
Figure 12: Decrease in Demand for labour
Due to decrease in demand for labour, the real wage will also fall to W1 from We while amount of labour in the market will also fall to N1 from Ne.
b.
Impact of a government subsidy to producers for restoring the labour employment:
.png)
Figure 13: Increase in labour supply
Due to increase in labour, the real wage will also fall to W1 from We while amount of labour in the market will increase to N1 from Ne.
Answer 5:
a.
.png)
b.
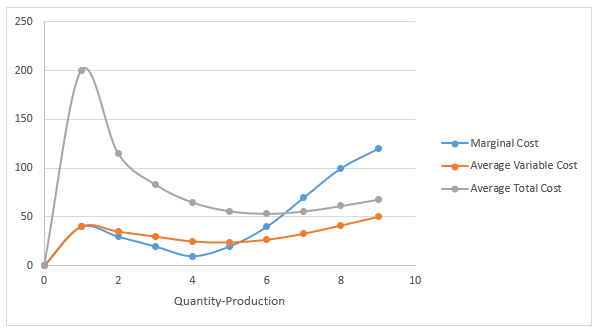
Figure 13: MC, AVC and ATC Curves
References:
.png)

- Assignment - Child Care
- Assignment - Mathematics
- Assignment - Accounting
- Assignment - Auditing
- Assignment - Biology
- Assignment - Law
- Assignment - Management
- Assignment - Nursing
- Assignment - Finance
- Assignment - Computer Science and IT
- Assignment - Humanities
- Assignment - Economics
- Assignment - Statistics
- Assignment - Architecture
- Assignment - Engineering
- Assignment - cookery
- Assignment - Marketing
- Case Study - Chemistry
- Case Study - Accounting
- Case Study - Law
- Case Study - Management
- Case Study - Nursing
- Case Study - Finance
- Case Study - Computer Science and IT
- Case Study - Engineering
- Case Study - Economics
- Case Study - Biology
- Case Study - Auditing
- Case Study - Marketing
- Case Study - Project Management
- Coursework - Diploma
- Coursework - Accounting
- Coursework - Auditing
- Coursework - Biology
- Coursework - Management
- Coursework - Nursing
- Coursework - Finance
- Coursework - Computer Science and IT
- Coursework - Engineering
- Coursework - Humanities
- Coursework - Child Care
- Coursework - Project Management
- Coursework - Economics
- Coursework - Cookery
- Coursework - Law
- Dissertation - Accounting
- Dissertation - Auditing
- Dissertation - Biology
- Dissertation - Law
- Dissertation - Management
- Dissertation - Nursing
- Dissertation - Finance
- Dissertation - Computer Science and IT
- Dissertation - Humanities
- Dissertation - Economics
- Essay - Politics
- Essay - Childcare
- Essay - Accounting
- Essay - Biology
- Essay - Law
- Essay - Management
- Essay - Nursing
- Essay - Computer Science and IT
- Essay - Humanities
- Essay - Economics
- Essay - Auditing
- Essay - Engineering
- Essay - Architecture
- Essay - Finance
- Essay - Science
- Essay - Marketing
- Programming - Computer Science and IT
- Reports - Management
- Reports - Computer Science and IT
- Reports - Project Management
- Reports - Marketing
- Reports - Nursing
- Reports - Engineering
- Reports - Accounting
- Reports - Humanities
- Reports - Finance
- Reports - Architecture
- Reports - Biology
- Reports - Economics
- Reports - Childcare
- Reports - Law
- Research - Accounting
- Research - Auditing
- Research - Biology
- Research - Law
- Research - Management
- Research - Nursing
- Research - Finance
- Research - Computer Science and IT
- Research - Science
- Research - Engineering
- Research - Humanities
- Research - Economics
- Research - Project Management
- Research - Statistics
- Research - Architecture
- Research - Marketing
- Thesis Writing - Computer Science and IT
- Thesis Writing - Engineering
- Thesis Writing - Biology
- Thesis Writing - Finance
- Thesis Writing - Humanities
- Thesis Writing - Auditing
- Thesis Writing - Economics
- Thesis Writing - Law
- Thesis Writing - Nursing
- Thesis Writing - Accounting
- Thesis Writing - Architecture


.png)
~5.png)
.png)
~1.png)


.png)


