SBM1203 Business Finance Assignment Sample
Assessment Brief
Due date: Week 11
Group/individual: Individual
Word count/Time provided: 2500 to 3000 words
Weighting: 30%
Unit Learning Outcomes: ULO1; ULO2; ULO3; ULO4
Assessment 3 Detail
Context
As an project manager you will need funding to complete your project/venture. A corporate decisionhas been made that all funding is internal. You may, however, argue that alternate sources may beappropriate (i.e. banks, angel investors, micro-finance organisations, crowd funding, etc.).You will need to present you rideasin a succinct, coherent and persuasive report, to assess the viabilityof your project. This assessment simulates this professional practice, where you present the key analysis to persuade your potential key stakeholders to invest in your project in a safe environment.
You should consider the following and write case study for me .
• Identify the stakeholders you are presenting to in this assessment. In this case assume that the lecturer is the manager of the company.
• Introduce the project idea. Include what the idea is and why it matters to the business. You are free to make any assumptions about the business as needed – provided they are logical.
• Provide details of your financial analysis and assessment of the project viability. Ensure that you consider the key risks and the results of sensitivity analyses.
• Close the deal. Why should the manager approve the project. Be persuasive.
Solution
Introduction
A business organization needs to have certain funds to complete their projects and also to achieve organisational success. Hence the first duty of the board management is to fix the goal of their organisation. After fixing their goal they have to create the financial budget to complete the goal. If they can create the budget for their organisation, then they can understand how much funds be needed to assess the scale of operation. After fixing the quantity of fund needed to finance the project, they have to choose the right sources through which they can collect all the amount. There are two different sources the internal and external sources. Both the sources have their different advantages and disadvantages. Hence, they have to fix their source of funds practically that will reduce the level of risk.
In this particular case, the management has decided to introduce a project venture through which they will utilise flower wastage and will produce lather from it. The business idea indicates that there will be diverse stakeholder group starting from supplier of flower wastage, logistic department, who will collect those wastages and will bring to the production centre, the labours working at the production centre as well as the management itself. Hence, a succinct stakeholder management plan is also essential. This study will provide detailed stakeholder management plan, the financial aspect of this project that includes source of funds, viability of the project etc.
Stakeholders Analysis
The stakeholders are those who have a large interest in the organisation and who have affected or be affected by the organization’s operation and performance. There are two types of stakeholders in any company, which are internal and external. The internal stakeholders directly related to the company’s performance and operation the example of these are, employees, management, investors or owners of the company. Since, the project is to produce leather from flower wastage, the role of internal stakeholder, specially the logistic and supply chain management people are key to attain the success. This specific stakeholder group needs to work efficiently to maintain the flow of flower wastage. The external stakeholders are those who have less affected by the business operation, such as the Government, regulatory authority, customers and suppliers of the company. Here, the project required permission from regulatory authority as they business will utilise wastages and will produce leather from it. For successfully running a business for a longer period any company must understand its stakeholders. As the stakeholders of the company indirectly played a significant role in the business decision. The main problem arises in the stakeholders is that company has various stakeholders and the interest of each stakeholder are different. Hence,sometimes it is not possible to meet all stakeholder’s interests at a time (Bottenberg, Tuschke&Flickinger, 2017). As an example, this difference can be understood. The primary goal of the company to profit maximisation to increase the value of its shareholders. Therefore, it controls its costs including employee’s salaries and wages of the workers. Moreover, the interest of these two stakeholders is to earn more from the company. Here, the interest of the employees and workers directly conflicts with the investor's interests. This type of issue in the company is very common but the efficient management of the companies can manage all the interests of all stakeholders (Heikkinen, 2017).
All through the word, stakeholders and shareholders seem similar but there are large differences that shareholders are also stakeholders of the company. The interest of shareholder sislimited they have only financialinterests whereas the stakeholders have vested inters in the company for a long period (Schneider & Sachs, 2017).
External sources of capital
Similar to the internal sources of capital there are several sources through which a company can maintain their capital. In the case of an external source, a company must have to take high risk as the capital needs to pay a higher amount of interest. Rhus. It is too much risky. However, there are several advantages also available of this source. Hence before fixing the right sources of capital, they have to understand the level of risk.
Family and friends
A business organisation can get their required amount of capital from their family and friends. This type of loan is generally taken based on vocal consideration and sometimes in a written measure. The amount of loan must be given back to the party after some time. Hence the percentage of risk in this type of loan is zero.
Overdrafts
This is also a type of external source of capital through which a business organisation gets their loan amount or the amount of capital. Here the person can take the amount of capital greater than the deposited amount. Here the company or the business houses must have to pay some interest to the excess amount of capital withdrawn from the bank (Belanova, 2018). This type of capital source has a little level of risk. Banks have charged a very less amount of interest for the overdrawn. Thus, it can be a reliable source.
Venture capital and the business angles
Venture capital is the source of capital. This type of capital is generally external. Different companies want to invest in different new companies and existing companies. They provide the loan based on the percentage of profit to be given to them at the end of the year. They used to keep an eye on the business component and the business prospects of the company where they have invested. This type of loan is also risky but the level of risk is comparatively low (Damanpour, Sanchez?Henriquez & Chiu, 2018).
Share issue
This is also a type of external source of capital. This type of capital can be earned by the company by selling some of the percentages of shares. The buyer if the share is generally getting some percentage of the ownership of the company. At the end of the year, the company must have to give some of the percentages of profits as dividend to those shareholders. This is the popular method of capital acquisition. Sometimes companies do not prefer this type of capital as they have the ownership of the company and also the voting right. Hence the companies like to use debenture capital as the preferred one. This type of loan holder has not any right of voting as they are not the owner of their company.
Issue of debenture
This is also a very popular source of capital. This is the long-term capital source. Here the company issues the legal stamp paper of the company that generally uses some of the assets as underlying for the sake of the registered and sealed paper of the company. Using this type of lean paper, they can get a higher amount of loan or capital for long-term use. The company has to pay some fixed rate of interest in the borrowed capital. This type of capital is too risky. As the owners, if the bondholder has the right to take the assets of the company if the company cannot pay the amount of interest on the debt capital. However, there is an advantage of using this type of capital, the amount of the interest taken as the expenses of the company. Therefore, the company get a deduction at the time of paying the tax to the government.
New partners
Supposed if an individual is trying to enter a business but they can face the risk of low capital. Here they can take any individual and any other company as a partner of their company. They are taken as a partner to the company for some percentage of the state and they also have to pay some amount of capital. They will agree on themselves to share the profit within them in an agreed percentage. All the responsibilities are also to be discussed at the time of joining any other persons in the partnership. This is also a very popular method for getting the amount of capital for a company (Vinczeova&Kascakova, 2017).
Leasing
It is also an external source of capital. Here the company can lease one of the other assets to a company or a party who needs the machine or the services very much. Here the company that has taken the services or the product must have to pay a semi-monthly instalment to the assets and services. This is how the company can maintain liquid capital.
Government grant
This is not that popular tool for capital sourcing. Governments generally give some amount of capital to the company for completing some of the criteria. This too if capital is not refundable and also the company does not have to pay any kind of interest. Instead, they have to fill the employment gap. If they can provide higher employment opportunities then the government can pay some of the capital as a subsidy. Thus, companies can avail this type of source by providing higher job opportunities to society (Anebo, 2019).
Hire purchase
This is also an external source of capital. This type of capital is the capital source. Here a company is thinking to purchase any machinery or equipment from a company then by paying some of the instalment the company can use the machinery or the equipment for business. However, at the time the company has paid their final instalment for the machinery, they will get the ownership of the machinery. Therefore, it is a kind of financial benefit that is given by the owner company to the purchasing company.
The internal funding for a company
The funding is the collection of money for capital. There are two types of funding available to any company one is internal funding another is external funding. Internal funding is the company’s seed money means the money that company-owned is called internal funding. Here the company needs to funding a project and now discussing if the internal funding will be worth it to the company or not. As the internal fund is raising within the firm hence the funds came from the net profit after adjusting the interest and taxes and the reserves that available to the company (Fikasari&Bernawati, 2021).
The advantages of internal funding
1. Allows full control to the project:
The internal financing is free from any repayment and time-bound of the project, therefore the management has full control over the project and they can set the strategy and set the time of completion of the project. This type of financing also free from any external tern ad condition of the financer.
2. It improves the process of planning:
Companies tend to be more concerned and careful when financing any project internally compare to external financing. The company used the excess profit in the project financing thatis assured of extra income than the current income amount. Therefore, t can say that internal financing is increasing the level of planning (Madra-Sawicka, 2018).
3. Decreases the cost of the projects:
The internal financing is free from the external borrowing cost such as the cost of the interest and the processing cost of borrowing. Therefore, the cost of the projects will be less than the externally funded projects.
4. Maintain capital structure and risk of financing:
The increasing debt in a company is a bad sign for its investors as the cost of the debt financing is effected the profit of the company and also affected the capital structure of the certain company. Too much debt on the balance sheet indicates the risk associated with the company in the long term if the debt is too high then it is considered as a high risk of financing. To maintain a stable market performance and ensures the interest of the shareholders the company needs to avoid external financing (He, Chen & Hu, 2019).
5. It limits the external influence:
Debt financing or external financing is influenced by macroeconomic factors such as inflation, exchange rate, interest rate and market risk. However, internal financing does not influence these. Therefore, it can say that internal funding limits the external influence.
The disadvantage s of the internal funding
Although there are several advantages of internal funding alongit, some disadvantage s also exist. The disadvantages of internal financing discussed below:
1. Low cash availability:
As the money is taken from the internal source of the company. Therefore, the company can see low cash within it. If the expense of the project is huge then the company can be out of cash and the financing affected the working capital of the company. Sometimes the internal financing affected the operation of the company (Bellavitis et al., 2017).
2. Required accurate estimation:
When the project is financing from the internal funds then the management needs to estimate the accurate cost of the projects as the cost is incurred from the company’s capital there for any excess cost in the future will impact the operation of the company. Any mistake in the estimation can harm the interest of the company (Baker, Kumar & Rao, 2020).
3. It requires control over the spending:
As this type of financing reduced the working capital of the company, hence the management needs more control over the spending of the company to avoid the out-of-cash situation and short-term insolvency. In addition, the company needs to control the spending of the project as these also impact the company’s operation (Mashayekh&Morshedi, 2020).
4. It takes more time to complete:
In this type of financing, the project has not any time-binding. The external sources of funding have time commitments involves and for avoiding the extra cost of interest they started as soon as possible but the internal source company has not faced any time issue that slowed the completion time of the project(De Massis etal., 2018).
Risk included in the funding
Whether the source of financing is internal or external the risk of funding is in both cases. The risk associated with the founding is major as it can dissolute the business. The main concern in the funding is the project completion. This means if the project will be completed or not that is not sure as the external factor matter. The risk of internal sourcing is mainly capital-related as it influences the cash flow and the working capital of the company also this funding affected the position of the company. On the other hand, external financing hasa larger risk as it is influenced by macroeconomic factors. Any changes in the economy impacted the project costing and also the cost of the funding. Therefore, the risk of uncertainty is associated with external sources of funding (St?Pierre &Lacoursière, 2017).
The debt financing from the project increases the risk of the company in the longer period as it changes the capital structure of the company. High debt in the capital structure means high interest or finance cost in the income statement which is decreased the income of the company. In the end, it can say that internal financing impacts the operation management of the company but external debt impact both operational management and in profit of the company (Goldstein & Kearney, 2020).
Evaluation of funding and judging the economic viability
The following table is showing the economic viability of the chosen project return that has undertaken by the company management. NPV (Net present Value) analysis is the capital budgeting tool that is generally used by the different business analyst to check the financial viability of any investment project (Setiawan&Fahrurrozi, 2017).
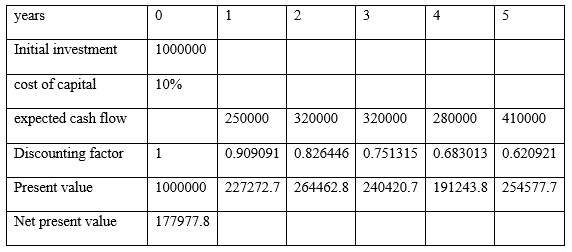
Here are some assumptions has taken. It is assumed that the company has an initial investment of 1000000 and they’re investing in the project for the next 5 years. This initial investment includes, purchase of machinery to produce leather from flower wastage, installation, site preparation etc. Also, the cost of capital is 10%. After the calculation of the NPV, it can be seen that the company has a net present value of 177977.8. As the initial investment is giving a positive net present value then it can be understood that the project investment will be done and the project will be accepted as per the economic viability.
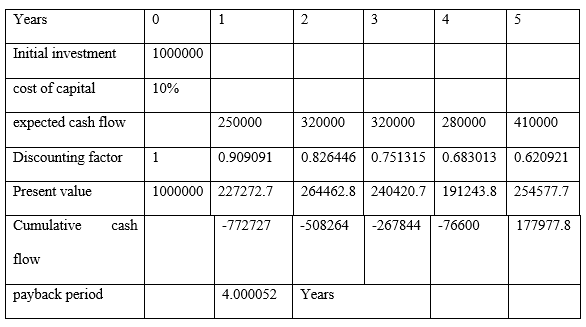
The payback period is also a capital budgeting that is used to find the viability of the return (Shaban, Al-Zubi& Abdallah, 2017). Keeping all the assumption the same as above, the value of the payback period is 4.000052 years, which is less than the life time of this project. Then it can be said that the project will be accepted.
Conclusion
From the above discussion and analysing here it can be concluded very easily the best financing sources for the projects. The project as discussed above has some benefits towards the society by removing flower wastage and converting it into leather which can be used any several ways. Not only has that the solution indicates that the project would be a financially beneficial project. Hence, the chosen project must be funded. The discussion on source of funding indicates that in this specific case, the internal financing option would be beneficial.From the advantages of internal financing, it is found that internal funding has more leverage in project financing than finance from external sources. Also, the risk of the financing represents that the external funding has a larger risk area as these are influenced by external factors such as inflation, interest and government policies. After critically analysing the advantages and disadvantages of internal-external resources of financing it can conclude that the internal sources of financing are the best option to choose.
Reference list
Anebo, L.N., (2019). Debenture as Alternate Scheme of Raising Investment Fund and Its Prospects under Ethiopian Company Law. Mizan Law Review, vol. 13 no. 3, pp.333-362.
Baker, H.K., Kumar, S. & Rao, P., (2020). Financing preferences and practices of Indian SMEs. Global finance journal, vol. 43, p.100388.
Belanova, K., (2018). AVAILABILITY OF EXTERNAL SOURCES OF FINANCE FOR SMALL AND MEDIUM-SIZED ENTERPRISES IN THE SLOVAK REPUBLIC. In 5th International Multidisciplinary Scientific Conference on social sciences and arts SGEM 2018 (pp. 421-428).
Bellavitis, C., Filatotchev, I., Kamuriwo, D.S. &Vanacker, T., (2017). Entrepreneurial finance: new frontiers of research and practice: Editorial for the special issue Embracing entrepreneurial funding innovations.
Bottenberg, K., Tuschke, A. &Flickinger, M., (2017). Corporate governance between shareholder and stakeholder orientation: Lessons from Germany. Journal of Management Inquiry, vol. 26 no. 2, pp.165-180.
Damanpour, F., Sanchez?Henriquez, F. & Chiu, H.H., (2018). Internal and external sources and the adoption of innovations in organizations. British Journal of Management, vol. 29 no. 4, pp.712-730
De Massis, A., Audretsch, D., Uhlaner, L. &Kammerlander, N., (2018). Innovation with Limited Resources: Management Lessons from the German Mittelstadt.
Fikasari, R. &Bernawati, Y., (2021). Internal or External Financing: New Evidence on Investor Reaction in Indonesian Manufacturing Firms. Journal of Accounting and Investment, vol. 22 no.2, pp.242-253.
Goldstein, A.P. & Kearney, M., (2020). Know when to fold ‘em: An empirical description of risk management in public research funding. Research Policy, vol. 49 no.1, p.103873.
He, Y., Chen, C. & Hu, Y., (2019). Managerial overconfidence, internal financing, and investment efficiency: Evidence from China. Research in International Business and Finance, vol. 47, pp.501-510.
Heikkinen, A., (2017). Business climate change engagement: Stakeholder collaboration in multi-stakeholder networks. In Stakeholder engagement: Clinical research cases (pp. 231-253). Springer, Cham.
Madra-Sawicka, M., (2018). The key role of internal financing among enterprises from the food industry–case of Poland, Latvia and Lithuania. ECONOMIC SCIENCE FOR RURAL DEVELOPMENT 2018, p.138.
Mashayekh, S. &Morshedi, F., (2020). Managerial overconfidence, internal financing and investment. Iranian Journal of Finance, vol. 4 no. 4, pp.102-125.
Schneider, T. & Sachs, S., (2017). The impact of stakeholder identities on value creation in issue-based stakeholder networks. Journal of Business Ethics, vol. 144 no.1, pp.41-57.
Setiawan, D. &Fahrurrozi, N.R., (2017), November. Feasibility analysis with capital budgeting backbone network fibre optic cable west palapa ring. In 2017 International Conference on Broadband Communication, Wireless Sensors and Powering (BCWSP) (pp. 1-4). IEEE
Shaban, O.S., Al-Zubi, Z. & Abdallah, A.A., (2017). The extent of using capital budgeting techniques in evaluating manager’s investments projects decisions (a case study on Jordanian industrial companies). International Journal of Economics and Finance, vol. 9 no.12, pp.175-179.
St?Pierre, J. &Lacoursière, R., (2017). Proactive Management of Operating Risks: A Lever to Improve External Funding for SMEs?. Risk Management: Lever for SME Development and Stakeholder Value Creation, pp.85-106.
Vinczeova, M. &Kascakova, A., (2017). How do Slovak small and medium-sized enterprises decide on sources of finance? Ekonomicko-manazerske spektrum, vol. 11 no.2, pp.111-121.
FIN201 Business Finance Case Study Sample
Assessment Task
The assessment is hinged on evaluating the student’s ability to calculate risk and return metrics of two listed companies from the Appendix, compare financial and stock market performance, determine their capital structures and weighted average cost of capital (WACC). It also allows a comparative discussion of the use of Net Present Value (NPV) and Payback Period as capital budgeting techniques in OECD countries using journal articles published in the last 10 years.
Please refer to the Instructions for details on how to complete this task.
You are expected to apply yourself fully on this assessment in order to produce a draft that should be handed in for marking at the end of Week 9. It is viewed necessary to have this assessment in order to encourage students to commence early on Assessment 4 since the requirements of these two assessments are the same. The students will receive feedback from the Facilitator and should incorporate this in Assessment 4 if it applies.
Instructions
You are assigned a pair of companies: one listed on the Australian Securities Exchange (ASX) and another on the New Zealand Stock Exchange (NZX) in order to address parts (a) to (f) below. The table of companies is in the Appendix.
(a) Using the companies’ annual reports in the last two years, compute the following measures: Changes in Revenue, Return on Assets, Return on Equity, Earnings Per Share and Dividends Per Share.
(b) Using daily stock market prices and S&P/ASX50 (the stock market index for the top 50 companies on the ASX), and S&P/NZX50 (the stock market index for the top 50 companies on the NZX), determine the daily stock returns, daily market index returns, arithmetic mean and geometric mean of the daily stock returns and index returns using data for the period 1 August 2022 to 31 July 2023.
(c) Using the Constant Growth Dividend Valuation model, determine the cost of equity of the two companies allocated to you. (10 marks)
(d) Using the latest Balance Sheets of the two companies, determine the capital structures of the companies and make a well-reasoned argument for similarities or differences in the capital structures of the two companies. In your discussion you are expected to refer to the industries that they belong to and also to other factors that influence capital structures.
(e) Having determined the capital structure of the two companies and using other relevant information, calculate the weighted average cost of capital (WACC) of the two companies and explain why the two companies have different WACCs.
(f) Based on the calculations in Part (a) and Part (b), provide reasons why there could have been differences in financial and stock market performance between the two companies. You are expected to refer to company and industry factors.
(g) Using two articles from peer reviewed journals, published in the last 10 years, perform a comparative analysis of the use of NPV and Payback period as capital budgeting techniques in any two of the following countries: Poland. Portugal, South Korea, Netherlands, Turkiye, Hungary, Finland, Ireland, Norway, Spain, Mexico and New Zealand. Highlight similarities and differences in use between the two countries.
Consider the following as you work on this assignment:
• Data sources are annual reports, yahoo finance (au.finance.yahoo.com) especially for companies listed on the ASX, www.investing.com for companies listed on the NZX, and any other relevant sources
• You are expected to do calculations on an EXCEL Spreadsheet but the Assessment will be presented in a report format in a Word document. (See instructions below of how to embed an EXCEL file into a WORD document). Should you fail to embed the EXCEL document into the WORD document, you can upload the EXCEL document separately.
• Remember to cite, inside the text, the sources of information used. Also put the list of references at the bottom of the report.
• You will be assessed on how well you address the key questions in the assessments and how well you write the report.
• Ensure you strictly follow the Report Format and ensure you include an Executive Summary, Introduction and Conclusion that are properly written.
Solutions
Introduction
Business finance involves the credit and funds involved in the business as finance is considered the foundation of business. For Assignment Help, Interpretation of formalising the models of financial management of combinatorial effect areas helps to determine the need for actualising the process of assessing the proportionality of financial resources(Zaytsev et al., 2021).In this study, the financial evaluation of Origin Limited Company on the Australian Stock Exchange and Oceania Healthcare on the New Zealand Stock Exchange are being evaluated. Evaluating the stock market price of the two companies is conducted. For comparative evaluation, NPV and payback period as capital budgeting techniques are also analysed.
Task A: Financial Performance Analysis
.png)
Fig 1: Annual Report of Origin Limited Company
(Source:Originenergy, 2023)
Origin Limited is a listed company which is considered a major integrated electricity generator and natural gas retailer. It provides electricity and natural gas plans, commercial solar systems and LPG for business needs. The financial performance of Origin in the financial year 2022 has reflected the strength of the integrated performance with stronger commodity prices and generating higher earnings (Annualreports, 2023). The revenue for the years 2022 and 2021 was 8231 million USD and 7136 million USD. For the years 2021 and 2022, the return on equity came at .11 and,26. The return on Assets came at .047 and .011. The earnings per share came at 11.96 and 7.61. The dividend per share came at 1.49 and 1.84. Return on Assets helps in measuring the ability of the cabinet to generate income based on ratios to show how capable the company is of using existing assets(Saputra, 2022).
.png)
Fig 2: Annual Report of Oceania Healthcare
(Source: Oceaniahealthcare, 2023)
The total revenue of Oceania Healthcare for 2022 and 2021 was 231140 and 175417(Oceania Healthcare, 2023). The revenue of Oceania Healthcare for the years 2022 and 2021 came at 231140 and 175417(Oceania Healthcare, 2023). Oceania healthcare limited is considered a limited liability company which is incorporated in New Zealand. For the years 2021 and 2022, the return on equity came at .20 and .12. The return on Assets came at .089 and .05. The earnings per share came at .27 and .16. The dividend per share came at .14 and .11.The mean of the daily stock return for Origin Limited and Oceania Healthcare for 1st August 2022 and 31 July 2023 are evaluated (Refer to Appendix 1 and 2).
Task B: Stock market Price evaluation
Dividend Valuation Model
The dividend growth valuation model is considered an effective way of valuing the stock of the company without considering any effect of the market conditions. It leaves out certain values like company reputation or brand value and focuses on dividend payments which shareholders will receive.Dividend growth valuation model has helped in determining a reasonable fair value for the stock of Oceania Healthcare and Origin Limited. Dividend valuation is considered a simple way of measuring the stock value. It is considered the most widely used for valuing equity. It will allow investors to compare the value of both Origin Limited and Oceania in different industries. Conducting Valuation with the Dividend Discount model involves using several assumptions which reflect the shared values and the number of dividend payments in the future as the fair value of shares represents the number of dividend payments with a particular rate of return(Sutjipto, Setiawan, Ghozali, 2020). Stock performance refers to the percentage increase in the value of the common stock of the company and an Index peer company for measurement boards. The mean of origin limited came at 5 to 5.5 and while the mean of Oceania healthcare ranged from 1 to 1.5.
Task C: Determining Capital Structure
Capital structures refer to the particular combination of quality and which are used by a company for financing its growth and overall operations. Weighted Average cost of capital is considered as the average rate which a business pays for financing its assets. It will help in calculating the value of Oceania Healthcare and Origin Limited. It will help to evaluate opportunities which will help in representing the firm's opportunity cost of capital.It will provide investors with a detailed overview of investment opportunities for providing opportunities for the firms. It will help Origin Limited and Ocean Healthcare perform economic value-added calculations. The Weighted average capital of Origin Limited and Oceania Healthcare came at 6.48 and .42. After conducting an analysis of the balance sheets of Origin Limited and Oceania Healthcare it is found that Origin Limited has an equity capital cost structure and Oceania Healthcare has a debt capital cost structure. Weighted Average cost of capital is considered the single most important input parameter and it is considered the nominal weighted average cost of capital per annum(Vartiainen et al., 2020). Origin Limited and Oceania Healthcare have different WACC as their risk and investments are considered to be different and lower WACC implies safer companies.
Task D: Industry Factors Which Affect Stock Prices
Inflation and interest rates
The market price of the value of stock rates is proportional to the inflation rate as the inflation rate rises stock performance tends to get better. As interest rates rise, share prices tend to fall. In Dec 2023 the stock value of Origin Limited experienced a .67 % decline. Since May 2022 interest rates in Australia have risen by 4.25 percentage points (Janda, 2023).In December Oceania Healthcare also experienced a decrease in stock prices by .03 NZD. The Reserve Bank of New Zealand has maintained the official cash rate at 5.5%( Reuters, 2023).Emergence of COVID 19 has led to the social and economic crisis which have affected the stock markets similar to what happened in the 2008 global financial crisis(Anh and Gan, 2021). The current stock price of Origin energy is7.84 AUD(Finance, 2023).The current stock price of Oceania Healthcare is .66AUD(Investing, 2023).The stock prices of both Origin Limited and Oceania Healthcare have experienced significant decline over the year due to rise in interest rates in Australia and New Zealand.
Economic Indicators
A stronger GDP growth rate tends to indicate that the economy is on solid footing so the stock market is likely to perform in a good manner while the real GDP growth rate will indicate the economy is slowing down and the stock market will be at risk of a downturn. The GDP growth of the Australian economy has been less than what was expected a year ago. The GDP growth rate of New Zealand is expected to ease at a rate of 1% in 2023 as private consumption is supposed to be weakening due to rising mortgage servicing costs and power employment growth(Oecd, 2023).As the GDP forecast for Australia and New Zealand are lower investors are wary of investing their money in companies from these countries as a result the stock prices are declining.
Task E: Capital Budgeting techniques
NPV
NPV is used for calculating the current values and future stream of payments from a project and company.NPV is used for conducting capital budgeting as an investment planning for analysing the profitability of the project as it considers both the risk and time variables.NPV is involved in conducting discounted cash flow analysis which tends to make the NPV more processed rather than any capital budgeting methods which are considered as risk and time variables. While conducting capital budgeting NPV considers decision-making for making judicious decisions which help to understand the cash flow in future and will have less value than cash flow in the present. It will help in comparing similar projects and making informed decisions. Net present Value approximates the challenge of decision-making in project appraisal by creating project portfolios which offer the maximum net present value(Chrysafis, & Papadopoulos et al., 2021).
Payback Period
The payback period is considered as the length of time which is required to recover the cost of investment as an investor will need to reach a breaking point. It implies the length of time required for any investment to recover its initial outlays in terms of savings and profits. The payback period in capital budgeting helps in evaluating the number of years for recovering the cost of investment.A simple payback period is assessed prior to adoption(Kessler, 2017).
Capital Budgeting in Poland and South Korea
Similarities
In Poland and South Korea NPV analysis is conducted by identifying the relevant cash flow , calculating the corporation tax liability and forecasting the future Exchange rates.In Poland and South Korea Capital budgeting is calculated By dividing the initial diving the cash outlay of the project by the amount of net cash inflow that the project will generate each year.
Differences
In Poland, NPV is calculated by measuring the profitability from the financial analysis and calculation of older analysis. In South Korea, NPV is calculated by analysing the features of the production capacity of the company which helps in differentiating the benefits and costs over the entire lifespan of the project which are estimated from the beginning of the project.
In Poland Payback is calculated by conducting research on profitability, and economic analysis of payback period in Poland after analyzing the cost and financial issues to assess the profitability of investments. In South Korea Payback period models are being deployed to assess how worthy the investment will be and if it is viable or not and the payback period is faster if the investment cost is more than 20 years.
Conclusion
Financial analysis has helped in evaluating the financial condition of Origin Limited and Oceanic Healthcare for determining its creditworthiness, ability to generate wealth and profitability. It helps companies determine the risk. Payback in capital budgeting helps in providing the number of years that will be required to recover the investment cost. The analysis of Origin Limited and Oceania Healthcare to determine the return on assets, return on equity, earnings per share and dividend per share for the financial year 2021 and 2022. The weighted average cost of Capital of Origin Limited and Oceanic Healthcare are also evaluated.
References
.png)
.png)
FIN600 Financial Management Case Study 2 Sample
Context
The purpose of the assignment is to provide you with the opportunity to apply the knowledge and skills acquired in FIN600 Financial Management, to a practical task, involving the use of ‘real world’ accounting information. This is intended to consolidate your accounting knowledge and skills.
Instructions
The basic requirement is to undertake a general financial analysis, comparing financial position and performance over the two most recent financial years, of an ASX listed company. Your Learning Facilitator will provide the details of the ASX listed company. The annual report for the chosen company should be available on the company website and/or will be provided by your Learning Facilitator.
Note: Assessment 2 submissions based on the incorrect company or a company not chosen by the Facilitator will be regarded as a Non-Submission and no grade will be allocated.
Non-Submissions of Assessment 2 will prohibit a Supplementary assessment for the student.
The analysis should consider each of the following financial ratios:
- Profitability and market performance
- Efficiency
- Liquidity
- Capital structure
Note: Please use the ‘consolidated’ data in conducting your analysis. You are only required to look at the most recent financial report. For those ratios which involve averages, you will calculate an average for the most recent year only, the prior year ratio calculation will NOT consider average calculations.
Points to consider
i. You are encouraged to seek and use additional public information about the company from sources, other than the annual report (for example, the internet, journal articles, newspapers, and business magazines).
ii. However, it is NOT envisaged that you will be engaged in extensive research of this nature and it is expected that the annual report will be the primary resource relied upon, in completing the assignment.
iii. You are asked NOT to try and make direct personal contact with the company or its officers (for example by telephone, fax, letter or email), in an attempt to gather further information.
iv. It is important to note that you must NOT reproduce company promotional material from the annual report or company website and represent it as critical analysis.
v. You will be provided relevant share price data for the company by your facilitator so that investment ratios (such as a price earnings ratio) can be calculated.
vi. You may find it useful to consult accounting references, in addition to the prescribed text, which deals with the analysis and interpretation of company financial reports.
vii. As this is a Masters-level subject, students are expected to engage with high quality credible resources (eg. academic journal articles) to support and
develop arguments and position statements, using the Torrens University Library: http://library.laureate.net.au. References to ‘Wikipedia’ or similar unsubstantiated sources will not be accepted.
viii. It is essential that you use the appropriate APA 6th referencing style, for citing and referencing research. The assignment is to include in-text citations and a reference list following the appropriate APA 6th referencing style. Please see more information on referencing here: https://library.torrens.edu.au/academicskills/apa/tool
Solutions
1 Introduction
1.1 Background and Business
Orica Limited is a multinational company that is engaged in the business of providing commercial explosives and blasting equipment to the mining, oil and gas, construction companies. The company is based in Australia and is listed on the Australian stock exchange. For Assignment Help, The company has a workforce of more than 15,000 employees and is providing services to customers in more than 100 countries (Orica Limited, 2020).
The market and industries in which the company deals are:
1. Oil and gas
2. Quarrying
3. Underground mining
4. Surface coal and metal
The company deals in supply of various kinds of products and provide different types of services as well and have multiple business segments which help the company to earn desired revenue to run their business. Some of these business segments are specified below:
1. Blasting: The company is one of the largest companies that provide blasting equipment to different mining and explosive companies. This includes supplying products like boosters, data analytics and reporting, explosives that are packaged, etc.
2. The company also supplies sodium cyanide for the extraction of gold. The product and services include providing training, involvement of analyzers etc.
2 Company Analysis
2.1 Current Financial performance, Key financial highlights,Economic outlook
*Summary of financial performance for the reporting year
The financial performance of the company is being average in the current financial year as compare to previous financial year. company has lower profitability ratio as compare to past years. It also disclosed that company has compete the industry benchmark but still require the efforts o put so that better performance can be achieved.
Financial highlights/events of YYYY
• The financial year 2020 has been a rather challenging year for the company and it is because of the pandemic, and supply chain management of the company to supply products and services to customers in different countries.
• However, the balance sheet of the company is strong and discloses strong earnings. The total dividend discharged by the company in 2020 is 33 cents which are lower than the dividend discharged in earlier years (Ojala,2021, p.34, para3).
• Amid the pandemic, the company has reported its liquidity of $2.4 billion which is decent and showcases that company has sufficient assets to carry its daily operations. This is because of the strong supply chain of the company which has enabled the company to keep providing products and services to their customers (BHP, Annual report, 2020).
Economic Outlook
• The company has reported that EBIT for 2021 cannot be predicted and depends on the recovery of a pandemic. However, the company is focused on making its strategies strong, which will move the organization towards a growth structure.
• However, there are various customers and suppliers which are returning to their original level and it can be predicted that if the same continues the company will be able to earn effective EBIDTA.
• The company has estimated that capital expenditure for FY 2021 will be around $380 million to $400 million and the focus of the company will be to grow capital and increase the reliability of the plant (Orica Group, Annual report, 2020).
• Hence, it can be seen from the above analysis that Orica Limited has been able to showcase resilient performance amid pandemic as well.
3. Ratio Analysis
3.1 Profitability and Market ratios
.png)
Source ; Figure 1: Table 1.1. (Annual report,2020)
Profitability and market ratios are calculated to analyze the efficiency of the company towards generating profit and cash flows for the shareholders of the company. The higher the profitability ratios are, the better the performance of the company and the more favourable will be the results. However, the analysis becomes more impactful when the comparison is drawn between two or more years. In this case, different profitability and market ratios have been analyzed, and are very important from a shareholders and investors point of view. This is because shareholders are more inclined towards companies that are generating high cash flows because it helps them to earn a higher dividend. On the other hand, market ratios help the investor to decide whether investing in a company will be beneficial or not(Cashwell, et al, 2019, p43, para4).
In the following case, on an analysis of profitability and market ratios, it can be seen that the performance of the company has declined. All the profitability and market ratios of the company have seen a decline in FY 2020 in comparison to the previous year FY 2019. This decline reflects that the company has not earned enough profits in comparison to the previous year.
For instance, the expense ratio of the company has increased in 2020. This reflects that the operating expenses of the company other than tax have increased. This is also because of the additional cost and because the sales have not increased much in comparison to expense. Also, the gross profit ratio of the company has increased, while there is a decline in the net profit ratio. This is because of the increase in expenses, which has declined the profitability of the company.
When the discussion is done about market ratios, they also see a decline. For instance, the dividend per share distributed by the company has declined and is 33 cents per share in FY 2020 in comparison to 55 cents in FY 2019. This is because of a decline in the availability of profit with the company due to pandemic and due to a decline in the financial performance of the company(Han, et al, 2020, p.65, para2).
Due to this, the share price reported by the company is also low, which is impacting the price-earnings ratio. In this case, the PE ratio of the company has increased which means the investors will be required to pay a higher amount for each share purchased by them.
Hence, it can be said, that these ratios are reflecting a negative view and are unfavourable in nature. This is because a low-profit ratio means that the company is not utilizing the resources and their expenses are exceeding the income capacity of the company. Hence, this lays a negative impact on the performance of the company. However, low ratios do not always mean that company might not perform well in the future as well.
3.3 Efficiency ratios
.png)
Figure 2: Table:1.2 (Annual report, 2020)
Efficiency ratios are calculated by the companies to evaluate the efficiency of the company to generate cash flows or profit for the company using the current assets of the companies. There are various efficiency ratios that are calculated to analyze whether the company is efficient in using the funds of the shareholders to generate profit for the company. Some of the most used efficiency ratios are accounts receivable turnover ratio, inventory turnover ratio, assets turnover ratio. These ratios help in analyzing the time taken by the company to receive cash from receivables, or whether the holding period of inventory is too long(Bunker, et al, 2019, p.54, para7).
In this case, the efficiency ratios of the company have decreased. This reflects that the capacity of the company to generate cash or profit from current assets like receivables, the stock has decreased. This decrease in efficiency ratios reflects that company is not effectively using its resources to generate cash and the policies and management of the company are poor.
The ratio which needs attention is the receivable and inventory turnover ratio. Both the ratios have declined, due to which time taken by the company to realize cash from these assets have increased. for instance, earlier the company used to sell its inventory in 47 days and now it takes the company 57 days to sell its inventory. This is also increasing the current assets of the company, which will reflect that the liquidity of the company is strong. While the cash flows from operating activities will decline(Utomo, et al, 2019, p.32, para8).
It can be seen that the ratios do not show stability because there has been a decline in the efficiency of the company. And this is major because of the pandemic in 2020 which has disrupted the supply chain of the company and the company had to hold its inventory for a longer period of time. Also, the increase in receivables reflects that the credit policy of the company is poor and the company is allowing more time to the customers to make their payments.
Hence, the above situation has a negative impact on the performance of the company and the ratios are moving in an unfavourable direction. This is because a decline in these ratios clearly reflects that the company is not performing its duties effectively which is also declining the cash flows of the company while the current assets in the balance sheet are looking strong, but, it is holding the cash of the company.
So, this unfavourable change in ratios put a negative impact on the performance of the company, and measures should be taken by the company to improve their efficiency ratios. This can be done, by investing more assets in strategies that will generate more cash in the long term. Also, measures should be taken by the company to reduce their time. This will ensure that accounts receivable and inventory of the company decreases, which will eventually increase the efficiency ratios of the company (Fuhrer, et al, 2017, p.65, para.23).
3.3 Liquidity Ratios
.png)
Figure 3: Table 1.3(Annual report,2020)
From the above calculation, it can be seen that the current ratio of the company is more than 1 which reflects that for every 1x of liability, the company has current assets of 1.23x. Also, the current ratio of the company has increased in FY 2020 in comparison to FY 2019. This reflects that the liquidity of the company has increased in comparison to the previous year. However, when the quick ratio of the company is seen it is low than the current ratio because it does not consider inventory as a quick asset. Also, the cash flow ratio of the company has decreased which reflects that profit has decreased or current assets have increased.
This change has come because the investment of the company in current assets has increased, likewise, the amount of the current liabilities of the company has also increased because the company has taken interest-bearing securities. However, the cash flow ratio has declined, because as current assets will increase, the cash flow from operating activities will decrease. This is because the cash of the company is stuck in accounts receivable, stock etc.(Annisa, 2019, p89, para43).
Hence, it can be said that when the comparison is done for two years the ratios do not show stability because the ratios have increased and decreased. While the current ratio and quick ratio have become better, the cash flow ratio has decreased, and it attracts special attention. This is because it reflects that the company does not have sufficient cash to run the business in terms of operating profit earned by the company.
So, the current ratio and quick ratio can be said to be favourable in comparison to the cash flow ratio. But, the company should take steps to reduce its reliance on outside debt, and also analyze the efficiency of the company to generate profit from the assets held by the company. Liquidity ratios are considered as one of the most important ratios because they determine the capacity of the company to discharge its short-term obligation. Also, the quick ratio is more efficient because it does not consider the stock as a current asset which is very logical(Zhao,2017, p12, para32).
Hence, the low cash flow ratio and increase in current and quick ratio determines, that while the current ratio of the company is improving the cash-generating power of the company is decreasing. This is because the company can have a positive net income while having low operating cash flows. The decline in ratio is also because of an increase in current assets. For instance, as inventory will increase, current assets will increase but, operating cash flow will decrease because as inventory increases, the cash flow generation will decrease. Likewise, as the current liability of the company will increase, it will reflect that company gets more time to discharge its liabilities and cash flow will increase. So, it is important to analyze that the assets are not unnecessarily increasing, and this can also be due to the poor collection policy of the company in terms of receivable or inventory management (Shin, et al, 2018, p87, para12).
3.4 Capital structure ratios:
Capital structure ratio help to understand the fund utilization for the business. If the debt capital is higher than equity capital then it will indicate the higher capital risk for the company. following are the various capital structure ratio has been provided in the file.
.png)
Figure 4: Table 1.4 (Annual report,2020)
Gearing ratios are the ratios that are used to compare the capital structure of the company i.e. comparison of the form of debt with some form of equity. The ratios are calculated to analyze the financial leverage of the company which reflects how the activities of the company are financed i.e. the capital structure of the company and whether they are funded by equity or debt. Gearing ratios are important for the company because when companies have high financial leverage the returns are also high, but, if the market is not performing well, then the chances of the company losing returns are also high, hence, the risk involved is high(Naseem, et al, 2017, p54, para90).
In the following case, the gearing ratios of the company have increased in FY 2020. This reflects that the reliance of the company on an outside debt has increased. Likewise, the interest coverage ratio of the company has decreased, and it reflects that the EBIT of the company is not sufficient to cover the interest expense of the company.
There are various gearing ratios that have been calculated here, is the debt coverage ratio. The debt coverage ratio of a company reflects that the company is capable of debt, hence, if the debt coverage ratio is high, it is a reflection that the company has the capacity to take high debt. In this case, the debt coverage ratio of the company has increased drastically and it reflects that company has the capacity to take high debt. This generally reflects that the operating income of the company is more than the debt liability of the company. However, in this case, the operating cash flows of the company has decreased drastically(Mathur, et al, 2021, p90, para12).
This change has majorly happened because of the debt that the company has taken. Due to the pandemic the operations of the company has suffered and to manage the liquidity levels, the company was required to take fresh debt which is increased the financial leverage of the company. However, the equity and total assets of the company have also increased, which has laid a positive impact and the company had been able to manage its liquidity levels which have ensured that the company has the capacity to discharge its outside obligation.
However, the liabilities and debt ratio of the company have increased, the gearing ratios of the company will be said to be unfavourable. This is because the operating income of the company is declining, and the interest coverage ratio of the company is also very low. This reflects that the operating income of the company is not sufficient to cover the increased interest expense of the company.
This situation reflects that though the liquidity of the company is strong, measures must be taken by the company to ensure that they decrease their reliance on outside debt because it is increasing the risk of the company. If the company lacks sufficient resources or funds to cover its interest and principal then it will bring a bad name to the affairs of the company. Hence, measures should be taken by the company to reduce its reliance on debt, and increase some of its reliance on equity(Pontoh, 2017, p20, para21).
4 Recommendations and Overall Assessment
Has the reporting year been better than the prior reporting year for the company?
The decline in ratios does not show stability in performance, because the ratios have not remained the same but, has declined. From the above analysis, it can be said that the financial performance of the company has declined in FY 2020 in comparison to the previous year FY 2019. This conclusion has been drawn on the basis of the ratios calculated above.
Will the company succeed in the future?
Yes, the company will succeed in the future, This can be said on the basis of the strong balance sheet and liquidity of the company. Also, the company did not suffer a heavy impact due to the pandemic.
Hence, based on the data available it can be said that the company will succeed in future.
The likelihood of a merger or acquisitionof the company?
Right now, the performance of the company is declining a little bit. However, the PE ratio of the company is high, which reflects that the share is overpriced. However, the company can look for acquiring another company because it will boost the ratio analysis of the company.
This merger with another small company will give the company what they are lacking and will improve their performance as well.
Suggest what should the company be doing help it succeed
In this case, the company should work to improve the net profit ratio. This can be done by the company by cutting down their expenses. As the company works in multi-product they can conduct analysis of products that are not adding to the profit.
Also, the company should work on gearing ratios. Right now, the financial leverage of the company is quite high, and measures should be taken to reduce the leverage by repaying the debt.
External impacts that need to be taken into consideration
The impact of government on the business
External impacts that need attention is the impact of a pandemic on the company, and the government restrictions on trade and commerce. Also, the company should work to improve their sustainability because customers are becoming more aware of a sustainable process.
Hence, in this case, measures should be taken to give more rights and analyze the impact of change in policies on the affairs of the company.
Would you invest in this company?
From, the above analysis it can be said that investing in the company will be beneficial because the prospects of the company are strong and the company will bounce back once, the effect of a pandemic will start lowering.
5 References/Bibliography
Reference:
.png)

- Assignment - Child Care
- Assignment - Mathematics
- Assignment - Accounting
- Assignment - Auditing
- Assignment - Biology
- Assignment - Law
- Assignment - Management
- Assignment - Nursing
- Assignment - Finance
- Assignment - Computer Science and IT
- Assignment - Humanities
- Assignment - Economics
- Assignment - Statistics
- Assignment - Architecture
- Assignment - Engineering
- Assignment - cookery
- Assignment - Marketing
- Case Study - Chemistry
- Case Study - Accounting
- Case Study - Law
- Case Study - Management
- Case Study - Nursing
- Case Study - Finance
- Case Study - Computer Science and IT
- Case Study - Engineering
- Case Study - Economics
- Case Study - Biology
- Case Study - Auditing
- Case Study - Marketing
- Case Study - Project Management
- Coursework - Diploma
- Coursework - Accounting
- Coursework - Auditing
- Coursework - Biology
- Coursework - Management
- Coursework - Nursing
- Coursework - Finance
- Coursework - Computer Science and IT
- Coursework - Engineering
- Coursework - Humanities
- Coursework - Child Care
- Coursework - Project Management
- Coursework - Economics
- Coursework - Cookery
- Coursework - Law
- Dissertation - Accounting
- Dissertation - Auditing
- Dissertation - Biology
- Dissertation - Law
- Dissertation - Management
- Dissertation - Nursing
- Dissertation - Finance
- Dissertation - Computer Science and IT
- Dissertation - Humanities
- Dissertation - Economics
- Essay - Politics
- Essay - Childcare
- Essay - Accounting
- Essay - Biology
- Essay - Law
- Essay - Management
- Essay - Nursing
- Essay - Computer Science and IT
- Essay - Humanities
- Essay - Economics
- Essay - Auditing
- Essay - Engineering
- Essay - Architecture
- Essay - Finance
- Essay - Science
- Essay - Marketing
- Programming - Computer Science and IT
- Reports - Management
- Reports - Computer Science and IT
- Reports - Project Management
- Reports - Marketing
- Reports - Nursing
- Reports - Engineering
- Reports - Accounting
- Reports - Humanities
- Reports - Finance
- Reports - Architecture
- Reports - Biology
- Reports - Economics
- Reports - Childcare
- Reports - Law
- Research - Accounting
- Research - Auditing
- Research - Biology
- Research - Law
- Research - Management
- Research - Nursing
- Research - Finance
- Research - Computer Science and IT
- Research - Science
- Research - Engineering
- Research - Humanities
- Research - Economics
- Research - Project Management
- Research - Statistics
- Research - Architecture
- Research - Marketing
- Thesis Writing - Computer Science and IT
- Thesis Writing - Engineering
- Thesis Writing - Biology
- Thesis Writing - Finance
- Thesis Writing - Humanities
- Thesis Writing - Auditing
- Thesis Writing - Economics
- Thesis Writing - Law
- Thesis Writing - Nursing
- Thesis Writing - Accounting
- Thesis Writing - Architecture


.png)
~5.png)
.png)
~1.png)


.png)


