BMG704 International Finance Assignment Sample
Assignment Brief
Aim & Learning Outcomes
Module Rationale
Businesses now operate in a highly globalized and competitive market where access to, and control of, finances are necessary for survival. This module focuses on the international financial management techniques essential throughout the business life cycle. The module provides a broad overview of international financial management theory and practices which are imperative to creating and sustaining a successful international business venture. The module probes the financial landscape in which modern day international businesses operate.
Overall Aim of the Module
The module provides students with and introduction to financial management theory and techniques required for entrepreneurship and managerial decision-making within an international business context.
Learning Outcomes
Successful participants will be able to:
Learning Outcome 1
Demonstrate a comprehensive knowledge and critical appreciation of the key concepts and topical issues of International Finance.
Learning Outcome 2
Act autonomously in the analysis of new and/or abstract data using a range of techniques appropriate to the discipline of International Finance, synthesizing evidence and critically evaluating complex problems in International Finance.
Learning Outcome 3
Be proactive in leadership, work effectively within a team or group as appropriate, make and sustain arguments/alternative points of view related to the discipline of International Finance.
Learning Outcome 4
Demonstrate confidence and flexibility in critically evaluating complex problems and the application of appropriate knowledge, tools or methods to their solutions in the context of International Finance. Be confident in the application of their own judgement.
Coursework 1
Assessment Task
Choose a Multinational Enterprise (MNE) listed on an internationally recognized Stock Exchange (including for example, London, Dublin, New York or Paris).
You are required to:
a. Critically discuss two recent developments in the international financial environment which appear to have impacted on your chosen company’s recent performance and development. Analyze how these two developments are likely to impact on the company in the near future. (14 marks)
b. Discuss the following key elements of the MNE’s international financial and/or risk management strategy (and how they appear to have affected the financial performance of your chosen company):
• Sources of finance
• Dividend policy (14 marks)
c. With reference to your chosen Multinational Enterprise (and using the most recent annual report published), analyses the financial performance (in terms of profitability, liquidity, efficiency and investment) of the company in the two most recent consecutive financial periods (e.g. 2018/19 or 2019/20,) using 8 different accounting ratios (prior year comparative figures will be available in the annual report).
Notes:
(i) You must advise your tutor of your chosen multinational enterprise to ensure suitability for use and avoid duplication;
What you need to do to demonstrate achievement of learning.
(ii) It is advisable to choose your multinational enterprise and download the most recent annual report by the end of week 1 – this will facilitate your preparation and allow you to effectively participate in weekly class activities;
Assessment Guidelines
1) Detailed guidance will be given in the tutorials in weeks 1 and 6 to explore the factors for your chosen case study and provide advice on the use of mediums/technologies for this assessment exercise.
2) This element of coursework accounts for 60% of the overall assessment. Students should refer to the marking criteria attached to provide them with fuller details of marking criteria a for each classification band.
3) Completed assignments must be submitted via Turnitin by 12.00 noon on Sunday of week 9 in semester 1. This date and time is final, and a late submission will be penalized by the deduction of marks.
4) All submitted assignments should have the file name:
BMG704 (86968) Student B00xxxxxx
6) View additional ‘Standard Assessment Guidance,’ for further guidance applicable to all
coursework elements.
Coursework 1 FEEDBACK for assignment help
Feedback on the assessment will be provided via Blackboard within three weeks of the submission date.
Solution
Introduction
Woolworths is a multinational supermarket and grocery stores having headquarters in New South Wales, Australia. Company is specialised in selling groceries such as packaged foods, meat, vegetables and fruit and also sell beauty products, stationery, magazines, DVD’s, baby supplies and health products. Company is listed on Australia stock exchange currently trading at the rate of $39.20AUD. Company generated revenue of $42.151 billion in 2020. This report aims to discuss the recent development and risk management strategy in the international financial environment and its impact on Woolworths. Furthermore, the report will also conduct an analysis of financial performance with the help of accounting ratios for the most recent consecutive years (2019/2020).
Two recent financial developments of Woolworths
According to annual report of the Woolworths (2020), Company has issued Australian Medium term notes amounted to $1.0 billion which include tranche of $400 million maturing in May, 2025 and other tranche of $600 million maturing in the month of May, 2030 (Woolworths Group, 2020). The purpose of issuing medium term notes is to refinance the group senior US notes which were maturing in month of September, 2020 and also for European medium term notes maturing in November, 2020. The aim of the Company is to lower the effective interest rates and lengthening the weighted average maturity of the period of the notes.
According to annual report of Woolworths (2020), Woolworths launched 131 products in the range of fresh made easy range, to offer more comfortable alternatives to shelves as more customers are demanding for delicious and fresh meals. Company also opened new distribution centres to increase its supply chain network and provide a semi-automated national distribution for growth and increasing efficiencies and deliver better experiences to customers.
Impact of financial developments on Woolworths
The debt refinancing is a decision of Companies to retire their existing debts, reduce coupon rate reflecting the market rate of interest and is a part of renegotiation of debt obligations. Debt refinancing will create a cash inflow and enhance credit rating of Woolworths (Woolworths Group, 2020). However, if a Woolworths get the best rate on the refinancing of medium term notes then it will increase the cash flow which can be reinvested in equipment, new locations, inventory, and meeting other monthly payments to especially fight with this pandemic condition which will further help in maintaining better performance and increasing profitability (Robinson, 2020). Refinancing debt may dissuade the potential investors and also acquirers.
The second financial development is increase in product range and supply chain network which will increase sale and thus the profitability of the Company. Opening of new distribution centres will increase the cash flow for the Company and improve the liquidity. There will be increment in the stock options and Company could meet the excessive demand of customers through better supply chain. There will be increase in competitiveness in the market which will further increase the value of share in the market. However, Woolworths will suffer shortage of cash at initial stage which may also lead to need of borrowing more cash from the market (Moyer, et al. 2014). There will be need of more workforce, more equipment and facilities and therefore, more capital needs. Company will have to manage the cost of business and finance in such a way that it can retained some profits for future uncertainties such as pandemic situation, expansion of business or setting off debts also distribute some profits to shareholders which can appear as finance distress for Company in future.
Source of finance and dividend as key elements of international finance and/or risk management strategy
Multinational Companies arrange finance mostly from raising from issue of shares, debentures or bonds or approaching to banks, retained earnings and financial institution to meet its long term obligations. Short term source of finance is obtained through commercial banks as working capital, trade credit and receiving of advance. When capital is altered then there is impact on net income of the Company, cost of capital, leverage ratio and also the liabilities. Equity financing dilutes the existing shareholding. However, Company’s cash flow from financing activity becomes positive due to increase in funds with the Company from issue of shares or bonds (Jacque, 2014). Debt financing of the Company increases the liabilities of Company and also cash flow from financing activity. Debt financing increase the finance cost as Company is required to pay regular interest and repay the principal amount on future date to bondholder or lender. However, debt financing does not dilute the ownership. There is decrease in net income for shareholders and debt holders hold senior position at the time liquidation of Company. Company gets tax benefit through lower rate of tax.
During the financial year 2020, the unprecedented pandemic due to Coronavirus has impacted Woolworths both positively and negatively. Company dedicated to invest in safety and addressed risks out of pandemic. Company increased its distribution centres to meet the demand of daily needs by customer, employed many new workers to response to the changing customer behaviour (Lumby and Jones, 2015). For the purpose of above initiatives, Company raised borrowings which are doubled from prior year and increased cash flow. Company has refinanced its existing loan and also paying $700 as interest on lease which is a regular financial burden on Company.
Woolworths Company might face liquidity problems due to constant receiving of capital from borrowings in order to pay debts and invest in operations. Company is required to be more cautious for its excessive debts at constant rate which is giving profits in short run but can create great financial trouble in long run. Company has incurred another long term obligation by Dividend policy.
Dividend is the distribution of proportion of profits to shareholders after tax from surplus remained. Company either choose to use the profits to reinvest in the business or disseminate to shareholders in form of dividend. Dividend policy of any Company creates positive impact on performance of Company (Moyer, et al. 2014). There is improvement in return on equity and also enhance the corporate image in the market. Woolworths have been constantly paying dividend to its shareholders. In the year 2020, Company declared the dividend of 48 cents per share which is around $606 million (Woolworths Group, 2020). Company also give option to shareholders to convert their dividend into shares under dividend reinvestment plan which will provide better rate of return to shareholders and increased the number of outstanding shares for Company. The payment of dividend has decreased the retained earnings of the Company and resulted in negative cash flow from financing activities and the cash decreased from hands of Company.
Woolworths might approach for no dividend payment policy for one year to manage its liquidity positions which seems to be delicate and can invest that amount in widening its range of products, renew of its existing process of supply of goods or repay its long term obligations (Hill, 2017). This will automatically improve the profitability, leverage position and shareholder value of the Company.
Analysis of financial performance of Woolworths
Liquidity Ratio
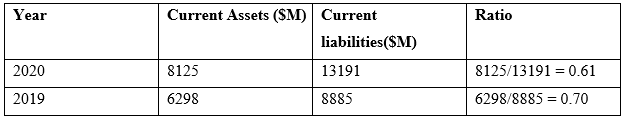
Liquidity ratio is financial metrics which help in ascertaining to pay current debts without going for external capital. Current and quick ratio gives an idea on ability of Company to meet its short term liabilities which fall due in coming 12 months from its short term assets (Palepu et al. 2020). The ideal current ratio is 2:1 and quick ratio is 1:1.
Current ratio
Current ratio = Current assets/Current liabilities
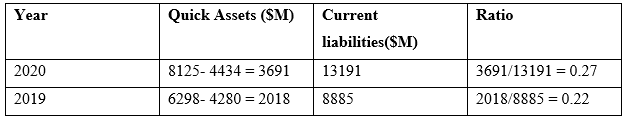
Quick ratio
Quick ratio = Quick assets/current liabilities
Quick Assets = Current Assets-Inventory
Analysis
The current ratio of Woolworths is less than 2 in 2019 and 2020 which is reflecting that Company might face difficulty to set off its current obligations when it will become due. Quick assets are highly liquid assets excluding inventory (Easton, et al. 2018). The quick ratio of Company from previous year is implying that Company is short of liquid assets to pay current liabilities and also current assets are dependent on inventories. Moreover, current ratio also gives a sign of effective operating cycle of Company to convert its product into cash. It is ascertain that Woolworths have trouble in receiving its debtor payment timely which can result in liquidity problems.
Profitability Ratio
Profitability ratio ascertains the ability of a Company to earn profit out of operational costs and revenue and also related to shareholder equity and balance sheet assets.
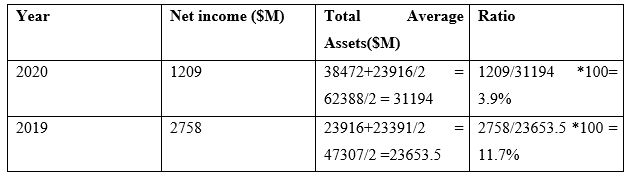
Return on Assets
Return on Assets = Net income/Average total assets
Total assets for 2020= $38472m
Total assets for 2019= $23916m
Total assets for 2018= $23391m
Analysis
Return on assets ratio present the Company’s earning of Company on asset. Higher return on assets will signify that the Company is efficiently using its assets. Company return on assets has been decreasing from prior year which is depicting the inefficient of management of Woolworths to manage its assets and generate earnings from its assets on balance sheet (Alexander and Britton, 2017). In other words, Company is unable to generate more profits per dollar of its assets in 2020.
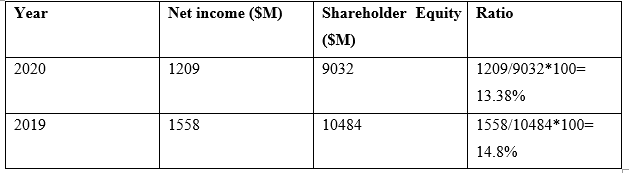
Return on Equity
Return on Equity = Net income/ Shareholder Equity (Total Equity)
Analysis
Return on equity is a generation of return on the money invested by shareholders. High return on equity denotes the ability of management to utilise the capital invested by shareholders in an efficient manner (Easton et al. 2018). Return on equity of Woolworths is decreased from the previous year which is signifying that management is not utilising the equity finance efficiently.
Gross Profit Margin
= Revenue-Cost of goods sold/Revenue
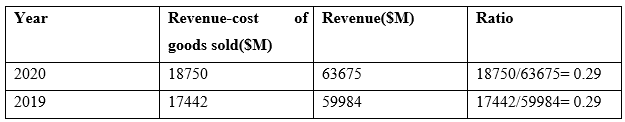
Analysis
Gross profit margin is to measure the profitability and financial health of Company by calculating the left over money from sale of product after deducting cost. The gross profit margin of Woolworths has been stable which is implying that Company needs to be more efficient in generating profit by considering the costs involved in selling goods.
Debt to Equity
= Total liabilities (Current liabilities + long term liabilities)/Total Shareholders’ equity
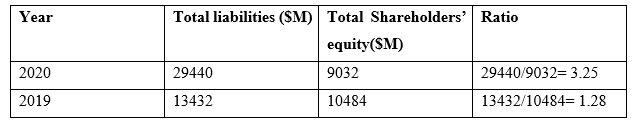
Analysis
Debt to equity evaluates the financial leverage of Company and help in measuring the ratio of wholly owned funds versus outside funds. This shows that how much does a Company is using leverage and also reflects the shareholder equity in terms of covering the outstanding debts if business slumps (Bekaert and Hodrick, 2014). The debt to equity ratio of Woolworths has spiked with double rate from 2019 which is demonstrating the aggressive nature in financing the growth of Company with debt and has resulted in excessive finance cost in terms of interest expenses.
Cash flow margin
= Cash flow from operating activities/Sales
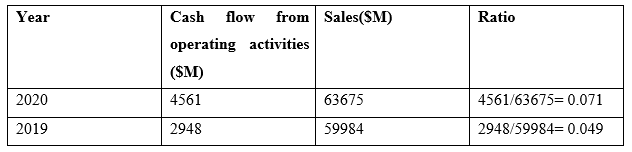
Analysis
Cash flow margin is a profitability ratio measure the earning quality of Company and efficiency. There is increase in cash flow margin from prior year which is showing that Company is able to convert sales into cash better from 2019.
Efficiency ratio
The ratio measures the ability of Company to use assets efficiently which can generate more income (Jacque, 2014). The ratio looks at the time to convert stock into cash and collect cash from customers etc.
Asset turnover ratio
=Total sales/Beginning assets (assets at start of year) + Ending assets (assets at end of year)/2
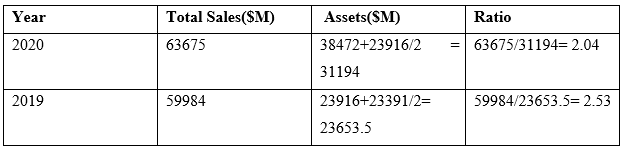
Analysis
The ratio ascertains the effectiveness of Companies to utilise assets and generate sales. Company is performing better if the ratio is high and vice versa (Alexander and Nobes, 2016). Asset turnover ratio of Woolworths has been reduced from previous year which implying that the Company is generating less revenue on assets or assets are not being utilised up to its capacity.
Inventory turnover ratio
=Cost of Goods sold/opening stock (inventory at start of year) + closing stock (inventory at end of year)/2

Analysis
Inventory turnover ratio indicates the number of times Company turn over its stock or inventory during a year. In other words, it measures the number of times the inventory is used or sold in a time period such as for one year (Eiteman, 2016). There is improvement in the ratio from previous year and now Company now replace its stock for 10 times in a year which shows the demand of goods of Company.
Day Sales outstanding
= Accounts receivable/Revenue* Days in period
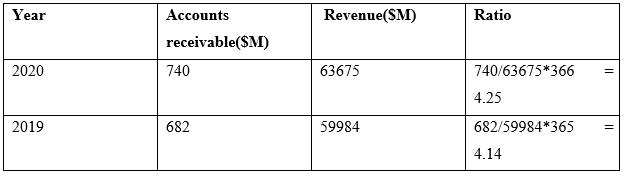
Analysis
Days Company required collecting the revenue from sales of goods on credit. The ratio shows the capability of Company to manage accounts receivables. There is increase in average number of days from previous year which indicates that Company takes long time to collect its outstanding receivables.
Investment ratio
Investment ratio helps in assessing the performance of shares of Company such as price earnings ratio and earning per share (A trill and Mc Laney, 2017). Investment ratio is more beneficial for investors in addition to the interest of ordinary shareholders.
Earnings per share
= Net income- dividend on preference shares/Weighted Average common shares outstanding
= 1165-0/1257.9 = 0.92
Analysis
Earnings per share indicate the amount of money earned by Company for each share. According to annual report of Woolworths (2020), the earnings per share of Company are decreased from previous year which was 2.06. This reflects that there is less profit or money earned on each share of Woolworths during 2020. High EPS is also good for Company as investors will show interest in investing in the Company.
Price earnings ratio
= Market price per share/ Earnings per share
Market price per share= $39.20AUD
Earnings per share = $0.92 AUD
=39.20/0.92=$42.60
Analysis
Price earnings ratio ascertains the relative value of shares value in the market. The ratio assesses the current value of share with the earnings per share (Alexander and Nobes, 2016). A share having high PE ratio is more attractive to investors and helps in valuing the value of share.
Conclusion
It can be concluded, that Woolworths is required to become more efficient by improving its ability to use the assets up to its capacity, reduce the burden of debts, find out the ways to control its cost to generate more profits. Company is also insufficient in managing its cost of sales which has decreased the revenue and degraded the performance of Company from last year. Company has adopted various plans to face the pandemic in opportunistic manner but Company capacity to meet out its short term obligations is shrinking which may downturn the financial position of business. Company is required to increase its inventory turnover and decrease its credit sales to manage the liquidity position. Furthermore, Company is cautiously required to focus on its investments and utilise the capital obtained either from borrowings or issue of shares efficiently.
References
Alexander, D. and Britton, A. 2017. International financial reporting and analysis. 7th ed. London: Cengage.
Alexander, D., and Nobes, C. 2016. Financial accounting –an international introduction. 6th edition. Harlow: Pearson Education.
Atrill, P., and Mc Laney E. 2017. Accounting and finance for non-specialists. 10th Edition.
Eiteman, D.K. 2016. Multinational Business Finance, 14th Ed., Pearson.
Bekaert, G. J., and Hodrick, R.J., 2014. International Financial Management, 2nd Ed., Pearson.
Easton, P.D., McAnally, M.L., Sommers, G.A. and Zhang, X.J., 2018. Financial statement analysis & valuation. Boston, MA: Cambridge Business Publishers.
Hill, C. W. L. 2017. International business. 11th ed. New York: Pearson.
Jacque, L. 2014. International corporate finance. London: Wiley.
Lumby, S. and Jones, C. 2015. Corporate finance: theory and practice. 9th ed., London: Cengage
Moyer, R.C., McGoogan, J.R. and Rao, R.P., 2014. Contemporary financial management. Cengage Learning.
Palepu, K.G., Healy, P.M., Wright, S., Bradbury, M. and Coulton, J., 2020. Business analysis and valuation: Using financial statements. Cengage AU.
Robinson, T.R., 2020. International financial statement analysis. John Wiley & Sons.
Watson, D. and Head, A. 2016. Corporate finance 7th ed. New York: Pearson.
Woolworths Group, 2019. Annual Report. Available at https://www.woolworthsgroup.com.au/icms_docs/195582_annual-report-2019.pdf. Accessed on 18.07.2021
Woolworths Group, 2020. Annual report. Available at https://www.woolworthsgroup.com.au/icms_docs/195794_annual-report-2020.pdf. Accessed on 18.07.2020
Finance Coursework Assignment Sample
Important note: Coursework is marked on the understanding that it is the student’s own work on the module and that it has not, in whole or part, been presented elsewhere for assessment. Where material has been used from other sources, this must be properly acknowledged in accordance with the University’s Regulations regarding Academic Misconduct.
COMPANY ANALYSIS - (100% OF OVERALL COURSE GRADE)
A company of interest must be chosen, relevant company-level data collected from Orbis, an analysis made by using quantitative (with Microsoft Excel) and qualitative techniques, interpret the results and discuss these with reference to economic concepts and theories covered in the course, and in relation to recent business and financial economic events that have affected the company you have chosen. In-text references should be included throughout the coursework, and, at the end of your coursework, a bibliography section with full references must be presented. Both in-text and full references must follow the Harvard Referencing Style as per University referencing guidelines.
Company Analysis
The goal of this assessment is to look at the different specified financial aspects related to a UK firm you have chosen, and which should be listed on the London Stock Exchange (LSE). Most of the firms listed on the LSE operate both in the UK and abroad. Therefore, they are international in the way they operate their business. An understanding of the financial side of this firm is very important as stakeholders and potential investors constantly scrutinize listed firms in order to assess if management is running the business properly. To cover the main financial aspects of this firm you should address each part as indicated below by using articles, textbooks, databases and any other reliable source of information for assignment help.
Part 1 – (1,400 words). The goal of this part is to provide a summary of the company you have chosen. Resources you need for this task include: Textbooks, Orbis database, website Yahoo finance, company’s annual reports, and any other relevant resources you may find.
- Select a firm listed on the London Stock Exchange (you must use the Excel containing companies listed on the Board of the London Stock Exchange that I uploaded on Moodle, named ‘Companies on London Stock Exchange’ to find a firm you are interested in) and highlight any specific reasons for selecting this particular company.
- Look at the Annual reports of this firm and describe the company's activities;
- Find the revenues of this firm over the last 5 years (i.e. 2016-2020) and report these revenues in a table. Comment on whether revenues either increased or decreased.
Identify any relevant elements that could have had an impact on the firm’s revenue (i.e. either an external shock such as a financial crisis or an internal impact such as the mismanagement of the company).
- What sector does the company you have chosen belong to? Identify the sector and by using the database Orbis address the following points:
Who are the main competitors of the company you have chosen?
By looking at the revenues of your company as well as the revenues of its main competitors during the year 2020, identify the market share of your company as well as the market share of each of your company’s main competitors. Either tabulate the market share of each or put it a pie chart form. Comment on the market share of your company as well as the market shares of its main competitors.
- By using either the Orbis database or the internet website Yahoo finance compile a table where you report on the year-end stock price of your company from 2016 to 2020. Did management maximize the price of this common stock throughout this period? If this has not happened, try to find out the reasons for this (i.e. look atpossible external or internal factors).
- Has your chosen company made any long-term investment decisions over the last five years? (tips: look at the annual reports produced by your chosen company during years 2016, 2017, 2018, 2019, and 2020).
- Did your company generate revenue from foreign markets over the last five years? (Tips: look at the annual reports of the year, 2016, 2017, 2018, 2019, and 2020, and try to find the breakdown of revenue in terms of domestic and foreign markets) Report your finding in a table and comment the trend of foreign revenues over the last five years.
- By using the Orbis database or other relevant sources of information, look at the composition of the Board of Directors in your firm of interest. Is there an equal distribution of gender of people on the Board? Is there any scientific evidence that gender has an effect on decisions made by Boards of Directors of public-listed companies? Address this last question by using 3-5 relevant academic articles.
Part 2 –The objective of this part is to identify how well your company did financially over the last five years (i.e., 2016, 2017, 2018, 2019, and 2020). Resources you need for this task include: Textbooks, Orbis database, Yahoo finance website, the company’s annual reports and any other resources you may find. In particular you should address the following points:
- Look at the Balance sheet of your firm and report in separate tables the following information:
Current and Fixed assets over the last five years (i.e. 2016, 2017, 2018, 2019, and 2020) and write a short comment related to their trend. Look at the annual report of your company for the last year of your analysis looking for keywords such as ‘current assets’ and ‘fixed assets’. What do you learn about the company from its annual report in relation to the two afore mentioned aspects (i.e. current assets and fixed assets)?
Non-current liabilities and current liabilities over the last five years (i.e. 2016, 2017, 2018, 2019, and 2020) and write a short comment related to their trends. Look at the annual report of your company for the last year of your analysis looking for keywords such as ‘non-current liabilities’ and ‘current liabilities’. What do you learn about the company from its annual report in relation to the two afore mentioned terms?
Working capital over the last five years (i.e. 2016, 2017, 2018, 2019, and 2020) and write a short comment related to their trends. Look at the annual report of your company for the last year of your analysis looking for keywords such as ‘working capital’. What do you learn about the company from its annual report in relation to this item?
Calculate the debt-to-asset ratio of your company over the last five years (i.e. 2016, 2017, 2018, 2019, and 2020) and comment on the extent to which your company’s total assets have been financed with debt and write a short comment related to its trend. Look at the annual report of your company for the last year of your analysis looking for keywords such as ‘debt-ratio’. What do you learn about the company from its annual report in relation to this term?
Calculate the working capital turnover ratio of your company over the last five years (i.e. 2016, 2017, 2018, 2019, and 2020) and comment on the extent to which your company has efficiently used its working capital to generate revenues and write a short comment related to its trend. Look at the annual report of your company for the last year of your analysis looking for keywords such as ‘working capital turnover ratio’. What do you learn about the company from its annual report in relation to this term?
Calculate the return on equity (i.e. ROE) of your company over the last five years (i.e. 2016, 2017, 2018, 2019, and 2020) and comment on the extent to which your company has been profitable in using its owners capital and write a short comment related to its trend. Look at the annual report of your company for the last year of your analysis looking for keywords such as ‘ROE’. What do you learn about the company from its annual report in relation to this term?
- Look at the profit and loss account of your firm and report the following information in separate tables:
Operating revenue, costs of goods sold and gross profits over the last five years (i.e. 2016, 2017, 2018, 2019 and 2020) and write a short comment related to the trend for each of those aspects. Look at the annual report of your company for the last year of your analysis looking for keyword such as ‘Operating revenue’, ‘costs of goods sold’, and ‘gross profits’. What do you learn about the company from its annual report in relation to these terms?
Net Profit over the last five years (i.e. 2016, 2017, 2018, 2019 and 2020) and write a short comment related to the trend of this item. Look at the annual report of your company for the last year of your analysis looking for keywords such as ‘Net Profit’. What do you learn about the company from its annual report in relation to this term?
Calculate the Net Profit Margin ratio of your company over the last five years (i.e. 2016, 2017, 2018, 2019, and 2020) and comment on the extent to which your company’s revenues have generated profits and write a short comment related to this trend. Look at the annual report of your company for the last year of your analysis looking for keywords such as ‘Net Profit Margin’. What do you learn about the company from its annual report in relation to this term?
Part 3 – (200 words)
- Describe how you went about selecting a specific company, collecting and analyzing relevant data. Giving your own personal assessment as to how effectively you went about completing this task. Please note that in evaluating the coursework, attention will be placed on your ability to incorporate finance and business concepts and theories covered in class in the various parts of the assessment. The use of appropriate financial and business terminology, the ability to clearly and concisely explain these aspects and the use of referencing (according to Harvard referencing style) will also form part of the evaluation, as well as your ability to stay within the topic parameters and exhaustively answer the question within the set word limits. Note that tables, figures, and references are not included in the word count. In preparing your assignment, you must follow the order of tasks as listed in Part 1, Part 2, and Part 3. Do not include in any Part, answers that are related to other parts as this will make your assignment less readworthy and create confusion. You must include a Word Count at the end of your coursework (Tables, Graphs/Figures, and Bibliography section does not count towards the overall word count). Make sure each Table / Graph you provide in your coursework has a progressive number and a title. Finally, you must write your coursework using Microsoft Word editor, whereas for Graphs you are advised to use Microsoft Excel. You cannot provide handwritten answers that are scanned, these will not be accepted. Please do not copy and paste images / graphs from annual reports.
Important note: Coursework is marked on the understanding that it is the student’s own work on the module and that it has not, in whole or part, been presented elsewhere for assessment. Where material has been used from other sources, this must be properly acknowledged in accordance with the University’s Regulations regarding Academic Misconduct.
Solution
Introduction
Financial assessment is one of the significant concepts in the current environment that directly linked with the performance evaluation of the firm. With the help of the financial; assessment, current stability and working capital management of an organization can be identify more effectively. Purpose of this assignment is to measure the financial performance of a LSE listed UK based company for over 5 years in order to determine the financial performance trends. This report has divided in three parts where in first part a summary of the selected company has been described. In the second part, financial performance trends for five years have been recognized and third part discuss about selection process of company data.
Part 1: Summarization of the selected organization
Organizational background
Barclays Plc has been taken under consideration in this report as the sleeted organization to analyses the financial performance of the company over last five years. Current stability of the business and operational efficiency of the firm can be evaluated through the financial assessment of Barclays Plc more significantly. Barclays Plc has been selected in this report because it is a LSE listed company and comes under the FTSE 100 components (Home.barclays, 2021). Additionally, the company operates internationally which provide an upper hand to select this organization to measure the financial trends. During the Covid19, financial effect can be seen in the operational process of the financial institution. Because Barclays a financial institution, it is effective to determine the current financial trends of the business more effectively. Due to this reason, Barclays Plc has been selected for the financial analyses in this report.
Barclays Plc is a UK based multinational bank that operates as two divisions such as Barclays International and Barclays UK. It is one of the oldest banks in the UK which was established in 1690 and headquarter situated in London, UK. Service range of the business are including retail banking, commercial banking, investment banking, wealth management, financial service, private banking and wholesale banking (Home.barclays, 2021). As per the annual report of 2021, current numbers of employee in the organizational operation is 83500. It is a public limited company that operates in financial service and banking industries.
Organizational activity
Barclays Plc currently linked with different business units and activity which directly impact on the performance parameter of the business. According to the report of the 2011, Barclays was the most powerful transactional corporation from the perspective of the ownership that directly impact on the financial stability of the business. Barclays has different business division which actively worked in international financial market and banking sector. Barclays UK, Barclays Corporate bank, Barclay’s payment, Barclays Private bank, Barclays US consumer Bank and Barclays Investment bank are the major division that operates by the group of the company (Home.barclays, 2020). The company has seven activity units in the operational process that assist in the growth of the business operation. As per the annual report 2020, Barclays established with one business unit as corporate bank in 1690. Hence, in the current environment, the company used to increase its numbers of activity unit and enhanced the profitability. Current activity units of Barclays are including Retail Banking Activity, Corporate banking Activity, Insurance banking Activity, Investment banking Activity, Wealth management, Wholesale banking Activity and Financial Service activity. The company used to generate highest percentage of revenue from the Investment banking Activity where Wholesale banking activity unit provides lower revenue consultation in the organizational operation.
Revenue trends over five years
Performance of the highly depends on the revenue generating capability of the business in the current environment. Considering the financial assessment it can be identified that Total income of the business has increased over the year for Barclays Plc. In the following section, a table has been made in order to show the trends of the revenue for Barclays Plc over last five years.
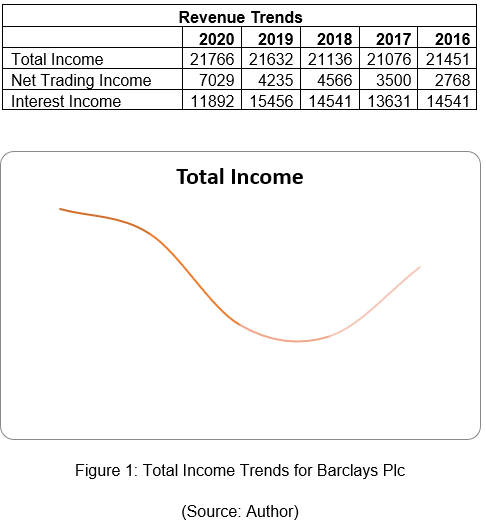
Considering the financial trends of the business revenue, it is identified that the revenue of Barclays has increased in last four years due to increase in trading income (Home.barclays, 2017). Higher growth in the financial market over last five years has positively impact on the trading income of Barclays Plc which has directly effect on the profitability of the business. However, reduction in the interest rate in the UK market has negatively impact on the total income of the business which reduces the growth of the revenue for Barclays.
Sector and competitive analyses
Barclays Plc belongs to Banking and financial service sector in the current environment. The company provides banking and financial services to the consumer of the UK and international market. The company used to provides investment opportunity to entrepreneurs and assist them to develop their business more effectively. In the financial performance analyses, competitive environment analyses are important that allow recognizing the current performance trends of the firm more effectively. Key competitors of Barclays Plc are including HSBC bank, National Westminster bank and Deutsche bank.
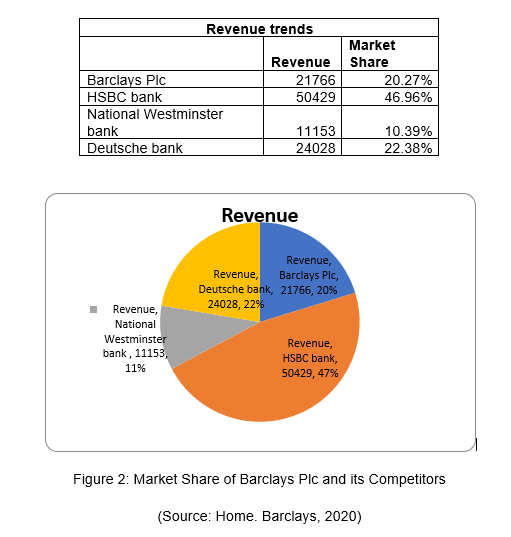
Considering the revenue generation in 2020, it can be identified that Barclays Plc posses 20% of the market share from the perspective of the revenue. On the other hand, following the revenue, it is identified that HSBC Bank possesses highest numbers of market share in the current environment from the perspective of revenue with 47% of market share (Orbis, 2021). Other competitors of Barclays Plc are including Deutsche Bank have 22% of market share and National Westminster bank have 11% of market share in the current environment (Home.barclays, 2020). This data indicates that market base is higher for the HSBC bank in the current banking industry where it is lower for National Westminster bank in banking sector. Based on the data, it can also stated that Barclays Plc current holds a good position in the banking industry from the perspective of revenue to enhanced its profitability and grow in future.
Stock price management
Historical data for Barclays Plc has been used in this section in order to determine the year end stock price for the business over last five years. Growth of the share price can be evaluate through the identification of the historical share price for the Barclay Plc. Following table has been used to show the closing price of share for each year over last five years for Barclay Plc.
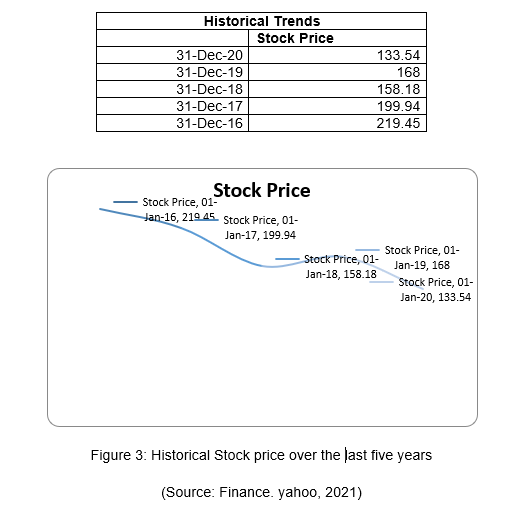
Considering the data it can be identified that there has reducing trends in the historical stock price for Barclay Plc in the current environment. It is identified that the stock price of the share was 219.45 in December 2016 and reduced to 133.54 in December 2020. Here, continues reduction in the share price can be identified for Barclays Plc in the current environment (Finance.yahoo, 2021). Changes in the interest rates and management strategy towards the activity reduction can be the reason behind this decrease. Covid19 has massively impact on the economic stability of the country and reduce the GDP rate of the UK. Due to government fiscal policy and unstable economic situation, share price has reduced dramatically in 2020 compared to 2019.
The company has taken the long term investment decision in 2020 for the sustainable development strategy. As the long term investment decision, the company used to make a vision for net zero bank within 2050 and align with the franchise activity to meet the goal of Paris Climate Agreement (Home.barclays, 2020). The company also strategy to tacking the climate changes through the acceleration of the changes in low carbon economy.
Barclays used to operate in the foreign market which makes it Multination Corporation. The company has generated large volume of revenue from the foreign market. Considering the annual report of the business, it is identified that the company generate 31.71% of the total revenue from the domestic market in 2020 (Home.barclays, 2020). This data indicates that the company generates large volume of revenue from foreign market.
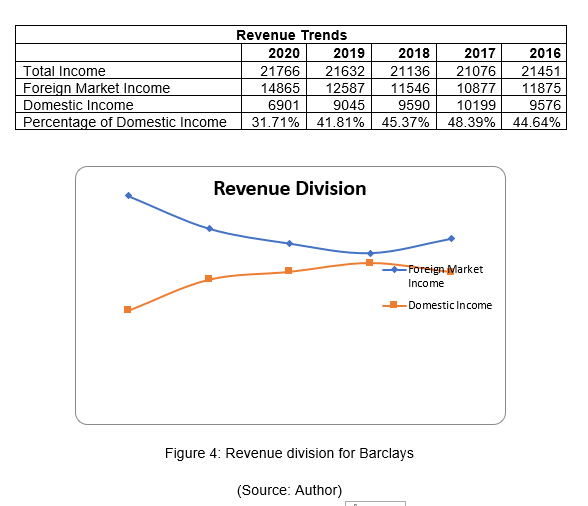
Considering the trends analyses, it is identified that there has an increasing trends for foreign revenue. The company able to increased its foreign revenue in the business operation over last five years.
Composition of Board of director
Considering Board Composition of the annual report of Barclays Plc, it is identified that numbers of non-executive director is 9, Chairman is 1 and Executive director is 2. Following the gender balance it is seen that Numbers of male director is 9 and Female director is 3. Here, 3:1 ratio can be seen in the gender distribution on the board of director for Barclays Plc in 2020 (Home.barclays, 2020). According to Abad et al. (2017), gender has no impact on the decision making process in board of director of public listed company that the decision making skills are same for both gender. Argue with the above statement, Martinez-Jimenez et al. (2020) stated that Leadership capability and critical thinking perspective is higher among the male director than female director which allow to get effective judgment in the decision making process. In accordance with the above statement, Nielsen and Huse (2010) told that board decision making depends on the professional experience rather than gender diversity.
Part 2: Financial performance for the company over last five years
Current assets and fixed assets
Current assets and fixed assets are the two different elements of total assets for an organization. Current assets consider as the short term assets that the company planned to sold within 1 years of period (Rafay et al. 2019). Fixed assets are considered as the long term assets that the company purchased for the production and service operation.
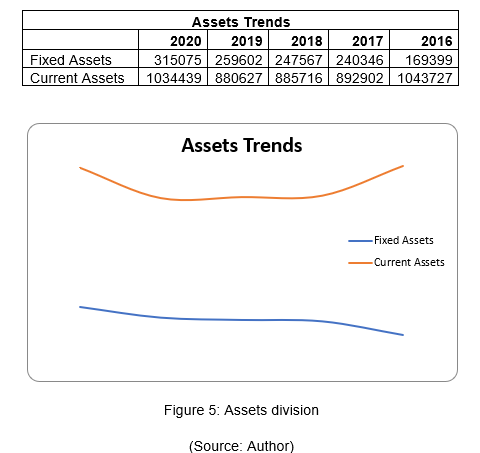
Based on the assets trends it can be identified that total assets of Barclays Plc have increased in 2020 compared to 2019 due to additional investment. Trend analyses shows that current assets of the company have increased effectively in 2020 compared to 2019 and 2018. On the other hand, fixed assets of the company have increased in 2020 compared to 2019 and 2018 for Barclays Plc. As it is a banking corporation, current assets are higher than the fixed assets of the business. This data indicates towards the large volume of regular transaction for the firm.
Total liability of an organization can be identified through the identification of the non-current liability value and current liability value (Laurens and Tampang, 2018). Current liability defines as the debt of the business that the company must pay within one year time period. On the other hand, non-current liability define as the long term liability that the company taken for the benefit of the business.
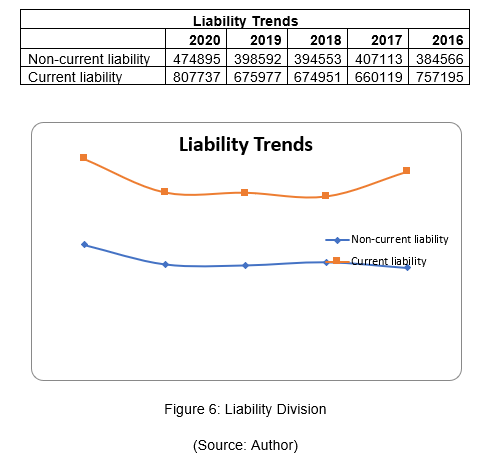
Based on the financial trends analyses it is identified that current liability of Barclays Plc has increased in 2020 compared to 2019 and 2018. On the other hand, Non-current liability of the business has increased over last five years for the business. Trend analyses showed that non-current liability of the company has increased due to increase in customers’ accounts in the business operation.
Working capital trends
Working capital management is necessary for the business in order to improve the overall operational efficiency of the firm more effectively (Boisjoly et al. 2020). Working capital management directly indicates towards the financial stability of the business in the current environment. In order to detect the working capital of an organization, it is necessary to deduct the current liability from the current assets of the business. Working capital trends for Barclays Plc has been identified in the following section of the report.
Working capital = Current Assets – Current liability
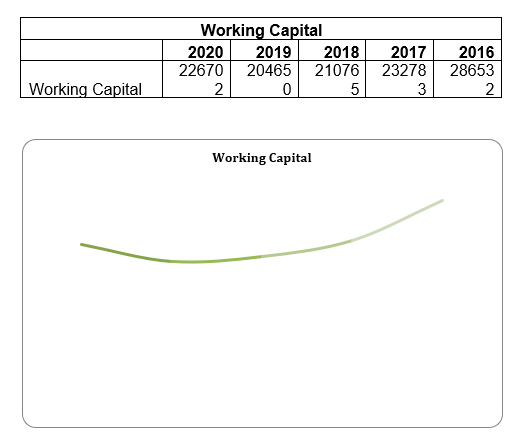
Figure 7: Working Capital Trends for Barclays Plc
(Source: Author)
Based on the above trend analyses, it is identified that working capital of the company has reduced in 2020 compared to 2016. Reducing trends can be seen in the working capital management of the business which indicates that current liability of the business has increased compared to current assets of the business over last five years. This data also indicates that the company reduced its cash conversion cycle over last five years in the business operation.
Calculation of debt to assets ratio
Debt to assets ratio is the financial assessment that assists to determine the financial risk in the business operation. Debt to assets ratio can be used to measure the use of the company’s assets that are financed by the debt rather than the equity of the business (McLaney and Atrill, 2016). In order to calculate the debt to assets ratio, it is necessary to divide the total assets from the long term debt of the business.
Debt to assets ratio = Long term debt / Total Assets
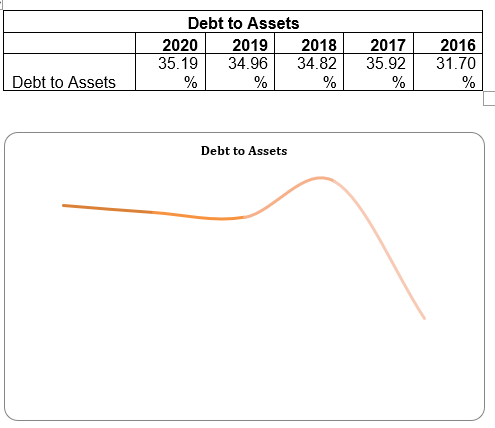
Figure 8: Debt to Assets ratio
(Source: Author)
Based on the above calculation it is identified that debt to assets ratio has increased for Barclays over last 5 years. This data indicates towards the increasing trends in the current environment. Increase in debt to assets ratio indicates that the company able to increase the investment in the assets through utilizing the debt in the current environment. Higher financial risk can be seen in this operation for the Barclays Plc.
Working capital turnover ratio
Working capital turnover ratio defines as the financial performance measurement that identifies the capability of the company to utilize its working capital for sales growth (Kalaivani and Jothi, 2017). Working capital management for the development of sales revenue can be identifying through the measure of the working capital turnover ratio for Barclays Plc.
Working capital turnover ratio = sales / Working capital
As the Barclays Plc is the service based organization, total income of the business operation consider as the sales revenue for the business over five years.
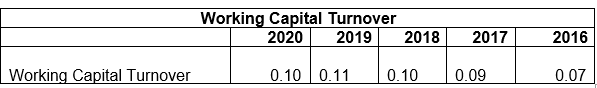
Based on the above table it is seen that working capital turnover for Barclays has increased in 2020 compared to 2016. This data indicates that the company has good working capital management to support the growth of the revenue over last five years.
Return on Equity
Return on equity (ROE) is the financial performance measurement that assists to determine the profitability of the firm in relation with the equity of the business (Amelia and Sunarsi, 2020). ROE has been used by the investors to determine the financial health of the business from the investment perspective.
Return on equity = Net Income / Shareholders Equity
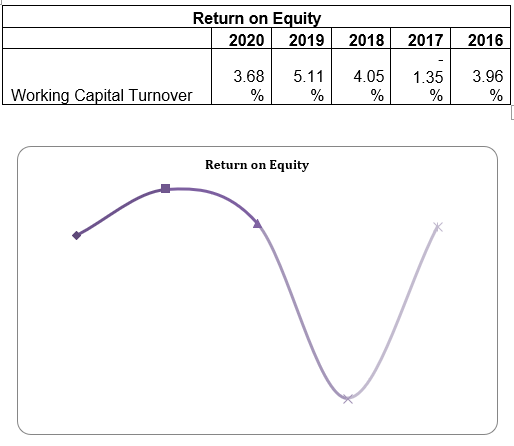
Figure 9: Return on Equity
(Source: Author)
Following the trend analyses of ROE it can be identified that ROE of the company has improved in 2020 compared to 2016. Due to Covid19, ROE of the company has reduced in 2020 compared to 2019 which indicates towards the ineffective investor’s interest towards the business.
Operating revenue and Gross profit
Operating revenue define as the revenue that an organization generate from the primary activity of the firm (Jati, 2021). Cost of goods sold is the measurement of cost of the product or services that the business sold. Gross profit is the valuation of primary profit from the business operation after deducting cost of goods sold from revenue of the business.
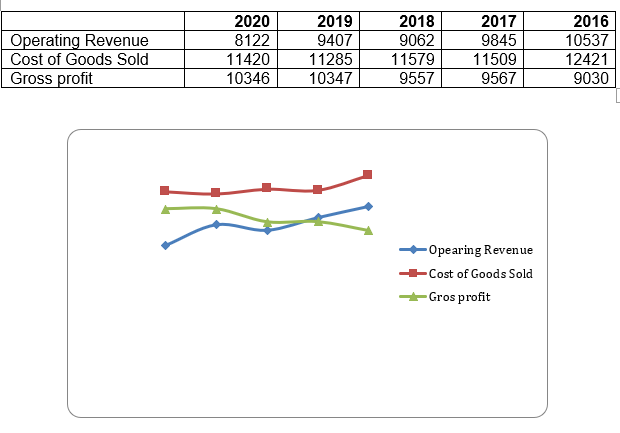
Figure 10: Trends in Gross profit
(Source: Author)
Based on the income statement of Barclays Plc it is seen that that has reducing trends for operating income and COGS. Hence, the increasing trends are there for Gross profit of the business which indicates that the company able to improve its primary profitability more effectively.
Net profit trends
Net profits define as the financial measurement that used to identify the net income of the business operation.
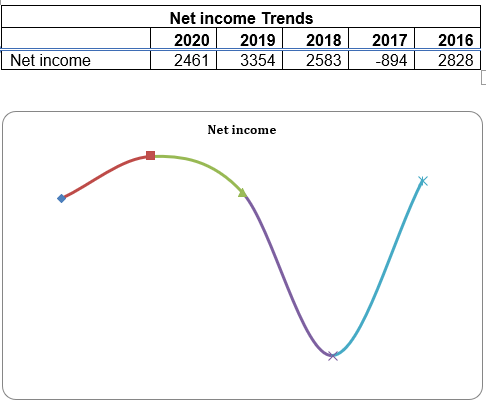
Figure 11: Net income Trends
(Source: Author)
Above graph indicates that positive trends can be seen in the net profitability of the business. In 2017, the company had faced a los due to lack of strategic development (Orbis, 2021).
Net profit margin ratio
Net profit margin ratio is the profitability ratio used to identify the percentage of profitability on the total sales of the business.
Net profit margin = Net profit / Total sales
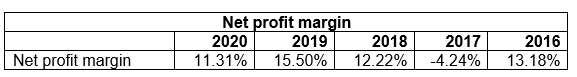
A reducing trend is there in the net profit margin of Barclays Plc in 2020. It is estimated that Covid19 has negatively impact on the net profit margin of the company in 2020.
Part 3: Selection and collection of company data
In order to complete the task, I have selected the organization from the website which listed the entire LSE listed corporation. Barclays Plc has been selected due to its financial growth and market value in the current environment. In order to collect the financial information of Barclays Plc, Yahoo Finance and annual report of the company used for last five years. I have collected data regarding Barclays Plc from the annual report of the company for last five years. Total value of assets, liability, and equity and income statement has been used to collect the relevant data regarding the company. Orbis websites has also used for the competitive analyses of the company. In order to collect information related to literature, relevant journal articles and text books has been used in this report more appropriately. Financial trend analyses for Barclays Plc have been replicated through using ratio analyses methods in this report more significantly. In order to analyzed the data, excel sheet has been used that assist to present the trends in graphical way.
Reference
Abad, D., Lucas-Pérez, M.E., Minguez-Vera, A. and Yagüe, J., 2017. Does gender diversity on corporate boards reduce information asymmetry in equity markets?. BRQ Business Research Quarterly, 20(3), pp.192-205. https://journals.sagepub.com/doi/pdf/10.1016/j.brq.2017.04.001
Amelia, R.W. and Sunarsi, D., 2020. Pengaruh Return On Asset Dan Return On Equity Terhadap Debt To Equity Ratio Pada PT. Kalbe Farma, TBK. Ad-Deenar: Jurnal Ekonomi dan Bisnis Islam, 4(01), pp.105-114. https://jurnal.staialhidayahbogor.ac.id/index.php/ad/article/download/738/523
Boisjoly, R.P., Conine Jr, T.E. and McDonald IV, M.B., 2020. Working capital management: Financial and valuation impacts. Journal of Business Research, 108, pp.1-8. https://e-tarjome.com/storage/panel/fileuploads/2019-12-09/1575883858_gh42.pdf
Finance.yahoo, 2021. Barclays PLC (BARC.L). [online] Finance.yahoo.com. Available at: https://finance.yahoo.com/quote/BARC.L/history?p=BARC.L [Accessed 29 December 2021].
Home.barclays, 2017. Annual Report 2017. [online] Home.barclays. Available at: https://home.barclays/content/dam/home-barclays/documents/investor-relations/reports-and-events/annual-reports/2017/Barclays-PLC-Annual-Report-2017.pdf [Accessed 29 December 2021].
Home.barclays, 2020. Annual Report 2020. [online] Home.barclays. Available at: https://home.barclays/content/dam/home-barclays/documents/investor-relations/reports-and-events/annual-reports/2020/Barclays-PLC-Annual-Report-2020.pdf [Accessed 29 December 2021].
Home.barclays, 2021. Barclays Our Story and History | Barclays. [online] Home.barclays. Available at: https://home.barclays/who-we-are/our-history/ [Accessed 29 December 2021].
Jati, W., 2021. Influence of Operational Costs on Operating Revenue and Loan to Deposit Ratio against Return on Asset at PT. Bank Negara Indonesia, Tbk Year 2009-2019. Kontigensi: Jurnal Ilmiah Manajemen, 9(1), pp.1-9. https://jurnal.dim-unpas.web.id/index.php/JIMK/article/download/88/131
Kalaivani, P. and Jothi, K., 2017. Impact of working capital management on profitability of the select car manufacturing companies in India. International Journal of Pure and Applied Mathematics, 116(24), pp.13-21. http://www.acadpubl.eu/jsi/2017-116-23-24/articles/24/2.pdf
Laurens, R. and Tampang, Y., 2018. Long-Term Liabilities. Available at SSRN 3210082. https://papers.ssrn.com/sol3/papers.cfm?abstract_id=3210082
Martinez-Jimenez, R., Hernández-Ortiz, M.J. and Fernández, A.I.C., 2020. Gender diversity influence on board effectiveness and business performance. Corporate Governance: The international journal of business in society. https://www.semanticscholar.org/paper/Gender-diversity-influence-on-board-effectiveness-Mart%C3%ADnez-Jim%C3%A9nez-Hern%C3%A1ndez-Ortiz/4d7412b4b67684d98f6d6f52158787d9c47792f9
McLaney, E. and Atrill, P., 2016. Accounting and finance: an introduction. Prentice Hill. http://103.227.140.9/handle/123456789/15358
Nielsen, S. and Huse, M., 2010. Women directors' contribution to board decision?making and strategic involvement: The role of equality perception. European Management Review, 7(1), pp.16-29. https://womanforward.org/wp-content/uploads/2020/06/Women-directors-contribution-to-board.pdf
Orbis, 2021. Orbis | Compare Private Company Data | Bureau van Dijk. [online] bvd. Available at: https://www.bvdinfo.com/en-gb/our-products/data/international/orbis [Accessed 30 December 2021].
Rafay, A., Yasser, F. and Khalid, Z., 2019. Revaluation of non-current assets under IAS-16: possibility of any managerial inducement: evidence from a South Asian economy. Rafay, A., Yasser, F., & Khalid, (2019), pp.93-105. https://www.researchgate.net/profile/Abdul-Rafay-3/publication/348680681_Revaluation_of_Non-Current_Assets_under_IAS-16_Possibility_of_any_Managerial_inducement_-_Evidence_from_a_South_Asian_Economy/links/6034bba3a6fdcc37a846881f/Revaluation-of-Non-Current-Assets-under-IAS-16-Possibility-of-any-Managerial-inducement-Evidence-from-a-South-Asian-Economy.pdf
FE7052 International Corporate Finance Coursework Sample
Assignment Instruction
This coursework constitutes 100% of the assessment for this module. Students are required to write a report (3000 words) by completing the coursework questions. Students are encouraged to access company information (e.g., annual report) to conduct independent research and collect data to answer the questions.
Students are required to complete all the questions listed below in their individual report.
Students are required to construct an analysis of a multinational corporation (MNC) covering a period of a minimum of 3 years and a maximum of 10 years. The analysis should address the following questions:
- Provide a historical overview of the selected company;
- Discuss the contemporary monetary environment of the company’s home country (such as monetary history, exchange rate regime, the role of the central bank in the foreign exchange market, and any relevant exchange rate crises), and its effects on the company’s international trade flows with other economies;
- Examine the capital structure of the chosen company and analyse on its cost of capital within the selected timeframe and discuss the implications for the value of the company;
- Track and report on the chosen company’s share/bond price changes (choose one only). Illustrate the risks and returns of the company in the market within the selected timeframe and provide commentary on the future prospects of the company (Tables/Figures/Graphs are expected to be included)
- Evaluate the company’s net working capital and debate whether the company has managed its working capital efficiently, and whether it has positively affected on the company’s value;
- Debate the factors that need to be considered in the process of multinational capital budgeting and investment decisions. Analyse their impact on the multinational corporation’s value
- Provide any additional economic or political insights that could affect the chosen company’s value and its future.
Structure
- Title Page
- Executive Summary
- Table of Contents
- Introduction
- Methodology
- Analysis & Discussion
- Conclusion
- Limitations & Recommendations
- References
Solution
Introduction
This report offers a complete analysis of Apple Inc., including its historical background, financial structure and response to the global economic and political challenges. The analysis starts from the Apple's inception in 1976 and explores turning points in the company’s growth, its dependence on the U.S. monetary environment, and management of capital structure. In this scope, Apple’s share price movement, net working capital management and multinational capital budgeting are explored using data from 2020 to 2024. The report seeks to help explain factors that influence Apple’s financial decisions and strategies, and how Apple retains its market leadership in the face of a changing global environment.
Historical background
Apple Inc. is a company that commenced business in 1976 founded by Steve Jobs, Steve Wozniak, and Ronald Wayne in a garage in Cupertino, California with the aim of creating personal computers (Ahmed, 2023). Apple I was Apple’s first product, it was a simple but revolutionary machine that led to the Apple II in 1977, Apple’s first major product and which established Apple as a leader in the emerging computer industry the assignment helpline Apple went public in 1980 and generated a lot of capital and used that capital for rapid growth and innovation.
In the 1980s Apple released some very notable products, Macintosh being one of them in 1984 (Little and Greene, 2020). This product solidified Apple as a company known for the innovative design first used in the Macintosh which is one of the first mass market personal computers with a graphical user interface (GUI). However, in 1985 it was an internal power struggle that saw Jobs depart from the company. There were then issues with leadership, wildly inconsistent product launches and declining market share for Apple over the following years. During this period, Apple also released a product, like the Newton PDA, which was a failure for the company, but showed a willingness to try new things in technology, in an effort to catch up with competitors like Microsoft.
Apple’s turning point was 1997 when Jobs returned as CEO and reimagined Apple’s product strategy around a much leaner approach. In his tenure, Apple introduced a string of iconic products in the 2000s: iMac, iPod, iPhone and iPad. When Apple introduced the iPhone in 2007, the tech industry began to revolve around the iPhone and was ushered into the era of Apple consumer electronics. This helps the company build a strong global brand and financial success based on ecosystem integration, high quality design, and user-friendly interfaces.
Currently, Apple remains the industry leader in technology and has expanded to services and wearables, with consistent dedication to innovation, quality and prioritisation of user experience. It is still one of the world’s most valuable companies, a symbol of cutting-edge technology and design excellence.
Contemporary Monetary Environment of the Home Country
Apple has a very strong dependence on the US monetary environment especially the Federal Reserve policies as a major determinant of both the cost and operation of Apple’s business across the world. Interest rate as a policy instrument under the Federal Reserve impacts on the capital structure of Apple since the firm balance sheet has tended towards a greater debt-equity ratio in the recent past. Apple has created an environment where all the companies in the Apple environment are able to generate revenues and be profitable. So, when Apple creates wealth, they do not only spend more on research and development to produce even better products that consumers enjoy but also take better care of their employees and suppliers for this every firm wants to be associated with Apple supply chain (Yifu and Wang, 2022). But the rising rates of interests have raised the cost of borrowing hence affecting the ability of Apple to use debt as it has been used in the past. Sustaining the balance on the capital structure will therefore be essential for Apple to continue on its innovation investments and therefore, debt management strategy will be imperative.
The stability of the U.S dollar as well as the moderate movement of currency by the Federal reserve is also propitious to Apple since most of its sales are in foreign countries. Since Apple generates the majority of its revenues in dollars, every time the dollar rises, as it is the case currently, global sales in other currencies are worth less and this puts pressure on the company’s gross margins. In 1994, Apple had a net profit of US $390 million from overseas markets and US $310 million from its local market (Rao, 2021). The Federal Reserve intervenes occasionally in foreign exchange markets for this purpose and aids Apple in part by diminishing some of the fluctuation caused by currency exchange rates; nevertheless, currency exchange rates remain a risk that Apple continuously seeks to hedge.
Inflation is another problem in the present monetary environment prevalent in the United States that is directly and indirectly impacting Apple. The latest inflation fright has raised expenses for inventory, transportation, and manufacturing throughout Apple’s value chain. Despite the fact that in the past Apple has been able to fully or partially transfer some costs to consumers given its popularity and brand awareness, the constantly high inflation rate in the U.S and other countries may constrain this capability without a negative impact on consumer sales. Furthermore, since Inflation should recognise that several founders and some Supreme Court judges regarded the concept of unbacked paper currency unfavourably (Yahya, 2022). To deal with this, Apple regularly reviews its supplier relationships and procurement mixes while at other times may even switch to lower-price countries to counter cost increases.
Monetary policy being tight in a bid to tame inflation has more ramifications to consumer’s buying capacity especially where inflation is high like in US. Monetary policy has not only resulted in increased wealth and greater wealth disparity but has also led to elevated consumer price inflation through the wealth effect on consumption demand (Ferguson and Storm, 2023). However, it is worth remembering that Apple has always been a company that produces high quality goods and has numerous loyal customers, which is why it has survived similar situations before.
Capital Structure in the Cost of Capital
Apple’s approach to capital structure indicates that it maintains a nice blend of debt and equity over the recent period. From the data obtained from 2021 to 2024, there is an evident show that the company has a higher leveraged position, specifically, a higher debt to equity ratio that Apple prefers to use debt to finance the company. The debt equity ratio, which was at its highest at 195.3 percent in 2022, slightly declining at 153.3 percent in 2024. This capital structure may be due to Apple preferred reducing shareholders’ dilution via low-interest debts for the funding of operations, acquisitions and share repurchases as Trade-off Theory dictates. In this theory, the company aims at maximising the advantage of interest tax deductibility while minimising the cost of financial distress that exists in Apple as a result of its efficient cash flows as well as high profitability (Wang, 2023).
.png)
The percentage of Debt and Equity again unfolds the financial model of Apple Inc. Debt was the most given attention between 2020 and 2023, with an average of 60 – 66% of capital structure, while equity which was equally important was 33.9% – 39.9% (Apple Inc., 2024). It also in indication to approach of Apple in terms of its use of debt to enhance the Shareholder Value and the firm’s Weighted Average Cost of Capital (WACC). Thus, seeing that Apple’s weighted average cost of capital is at 5.8% and where the after-tax cost of debt stands at 2.98% Apple has optimised on the cost of capital but at the same time creating room for significant investment in its innovation and market development. The fact that the cost of debt is lower than cost of equity confirm that Apple reaps a lot of benefits from debt leveraging. Here
The cost of equity financing is estimated at 10.17%.
The case of Apple shows that the changes in capital structure have also coincided with the changes in this cost over the period (Gugler, Szücs & Wohak, 2023). Thus, as long as debt has remained a large part of the capital structure, Apple’s WACC remains relatively low, indicating sound working of the value of the agency model. This focus on a low WACC is consistent with the Pecking Order Theory which postulates that firms have a strategic preference to reliance on internal funds and debt, and external sources of equity only if internal sources are inadequate. The idea of capital cost with the focus placed on Apple’s financial strategy-based shows that the corporate goal is to reduce capital costs while creating a locked-in insolvency condition. Such wise use of debts, coupled with the strong earnings and cash flow of Apple inflicts the evidence of an appropriate capital structure that envisages continuing growth effectively supporting shareholder value. By carefully managing its capital structure, Apple has ensured its cost of capital for funding its strategic plan in an economic liberal scneario (Rhee, 2023).
Share Price Movement for Apple and its Market Analysis
Seasonal fluctuations evident from the above graph of Apple Company share price in the last five fiscal years reveal that shares are sensitive to both company performance as well as the overall market status. From the analyses made for the period between 2020 and 2024, Apple’s average recoveries are between 63% and 76.9% in the years that formed the basis of the revenue calculation. This phenomenal growth is consistent with the general market rebound after the first period of COVID-19 pandemic, when many technology stocks, particularly those related to tech-enabled products and work from home solutions, boomed. Using our wide range of products, and growing ecosystem, Apple was targeting large market share, and creating shareholder returns; better than the S&P 100’s 32 percent for that year.
.png)
Figure 1Annual performance
Source: Self-Created
In 2021 Apple rose up nearly 30% to trump the S&P 100 average return of 21% Y/Y 2021. This performance clearly pointed to the fact of the company’s strength and its innovation-based growth model which was evident in the consumer demand of the company’s products and or services such as introducing new products into the market or new software versions among others. The market conditions currently are quite good: low interest rates enable buying stocks with the help of borrowed funds, preferences for investments in tech shares. Indeed, the ability to sustain high returns in this environment made investors endorse Apple while confirming its market superiority in the new technologies sector (Uwihirwe and Bazimya, 2022).
But as we move into these years, 2022 could have been Apple’s year of loss since its annual return was at -8.8% and far from its previous results. This decline was aggravated by specific market conditions such as developments like; increasing interest rates, inflation fears, or disruptions of some major supply lines which bogged down the technology industry. While the S&P 100 posted a 29% gain that year, Apple business limitations, elevated manufacturing costs and rather weak consumer electronics sales were in evidence. Nonetheless, from an Apple perspective, the fundamentals of the business remained sound and would simply need to wait for the right environment to turn things around, or right the ship, again (Simic and Jovicic, 2023).
Apple successfully returned 24.5% for the fiscal year ended 2023 and outperforms S&P 100 that had a negative rate of return of 21% mainly because of persistent economic instability and fluctuation in the stock market. This is evident by Apple’s strong financial performance during this period with effective cost control, appropriate product positioning and diversified source of revenue as a way of managing risks that afflicted other businesses and portraying investor confidence. This resilience goes well with Apple’s other characteristics of being a stable investment with low beta of 1.24 than the market.
Evaluation of the Net Working Capital Management for Apple
An analysis of the working capital cycle of Apple Company for the past four years shows a working capital management that is proactive to reduce the holding of non–current assets and at the same time enhancing liquidity. From 2021 to 2024, the current assets have increased from $ 134,836 million to $ 152,987 million in total due to the on-going investment in inventory and receivables (Apple Inc., 2024). However, current liabilities recorded a steeper growth, which stood at $125,481m in 2021 and projected to be $176,392m in 2024; with the growth rate of 22.7% in 2022 and 21.4% in 2024. The increase in liabilities beyond a corresponding increase in assets had a negative effect on the current ratio and volatile net working capital.
.png)
Figure 2 Working capital
Source: Self-created
This liquidity trend is reflected in Apple’s current ratio where figures have scaled down from 1.07 in 2021 to a projected; 0.87 in 2024. Last year the ratio reduced to 0.88, which implies that current liabilities were more than the current assets implying that Acme may have a constraint in its short term-liquidity. While it multiplied a little in the year 2023 for some reason, the ratio is back down in the year 2024. This current ratio variability shows that Apple implemented a risky working capital management level, which corresponds with the working capital principle of not locking capital in assets to finance even more profitable or high return activities (Kiymaz Haque and Choudhury, 2024).
In line with this interpretation, the net working capital figure more overshadows this by declining from $9,355 million in 2021 to negative territory by 2024 at -$23,405 million. This shift showed that Apple commonly use current liabilities to fund short-term activities to avoid to taint its cash flow toward longer-term investments with more attractive returns, for instance, on research and developmental costs or expenses on plant and machinery.
Apple strategy is in accord with the concept known as the Aggressive Working Capital Management Theory where companies work towards optimising return by minimising working capital needs while holding lower liquidity buffers. This approach however is relatively risky, hence complements Apple’s strong cash flow profile and high profitability, which affords the company sufficient flotation to mitigate for liquidity risks (JOY, 2021).
Key Contemplations in Multinational Capital Budgeting
In multinational capital budgeting, several factors of core importance to sustaining and growing corporate value confront Apple. The first area is exchanging rate risk, which poses a major threat to its international business because changes in the rates can hugely impact the earnings. To reverse this, Apple has over the years engage in hedging to counter this risk as it seeks to balance its cash flows across its operations in different countries while also seeking to shield its earnings from volatility from the foreign exchange market.
Apple's main strength resides in the manufacture of remarkable goods that appeal to consumers (Cai and Chen, 2024). The capital allocation decisions in Apple are affected by the various tax systems since some countries impose better tax treatments. For example, the tax differential has been used by the Apple to maximise after-tax returns, increasing the general returns on global investment. Corporate tax planning is still paramount for Apple to decrease on its tax liability around the globe as it complies with the dynamic changes in taxation laws especially in the regions that are changing their tax laws concerning international income.
Other sources of risk for Apple include market fluctuations and uncertain regulatory environment which are always considered when preparing budget. In order to invest initially, Monetary independence is impacted by a myriad of factors, including monetary policy, inflation rates, and financial laws (Ali et al., 2023). Challenges including restrictions to data privacy, technology exports, and environmental measures in places like the EU not only add a cost hurdle to Apple’s operations but also restrict its operations flexibility.
Additional Economic or Political Insights
Apple currently exists in a broad external environment with strong economic and political forces that play a crucial role in determining the strategic directions and organisational outcomes of the firm. Of course, one of the most pressing concerns is the trade conflict that is still happening between the USA and China today. Since apple relied heavily on manufacturers in China, tariffs and restrictions make production expensive and thereby may cause a rise in the company’s selling price to customers. In the context of the new great power rivalry, the US-China trade war, the COVID-19 pandemic, labor and transport costs, and sustainability pressure, the restoration of manufacturing capabilities has begun to receive more public attention, with the news media focusing more attention on stories of American companies bringing production back in-house.
Home (Zeng and Zhang, 2024). It also has competition between the U.S and China in the geopolitical front as a challenge. For instance, the U.S has gradually restricted the sale of high-tech components like semiconductor chips to China. Thus, these restrictions may limit its production or force it put into other suppliers, eventually, lead to the fact that it will become more expensive for Apple to produce something with high-technology components such as iPhones and MacBooks to mention but a few.
Legal forces in the operation of Apple business in the European Union include data privacy regulation, antitrust, and environmentalism. GDPR for example imposes strict data protection laws on Apple, hence the need to spend a lot of money in data protection and making sure all its services align with what is offered in Europe. Legal requirements that are environmental also force Apple to embrace sustainable management of its supply chain and products.
Conclusion
The analysis demonstrates Apple Inc’s strategic resiliency to innovative, while securing financial stability amidst the ever-varying market and geopolitical conditions. The key findings reveal how Apple has used debt leverage, responded to monetary policies and hedged against currency risks to continue its growth and market position. Despite the pressures of inflation, interest rate increases and regulatory constraints, Apple's capital structure and market driven strategies allow Apple to continue to create shareholder value and maintain competitive advantage. Finally, overall Apple’s ability to adapt to new markets, its continuing focus on high quality, and high-quality oriented products reaffirm Apple as the industry leader in a fast-changing global environment.
Limitations and recommendations
Limitations of this report include reliance on secondary sources of data, which may not adequately capture real time shifts or specific Apple strategies, and fixed period analysis which may not adequately capture long term trends. In addition, finer segment based financial data could further enhance the accuracy of profitability assessment of Apple’s product lines. Based on Apple’s ongoing AI and environmental sustainability expansion work, future research should also consider how this will shape Apple’s financial and operational strategies. Continuous investment in sustainable practices as well as improving the global supply chain resilience and close monitoring of regulatory changes in the U.S., the EU and China are recommended actions.
References
.png)
.png)

- Assignment - Child Care
- Assignment - Mathematics
- Assignment - Accounting
- Assignment - Auditing
- Assignment - Biology
- Assignment - Law
- Assignment - Management
- Assignment - Nursing
- Assignment - Finance
- Assignment - Computer Science and IT
- Assignment - Humanities
- Assignment - Economics
- Assignment - Statistics
- Assignment - Architecture
- Assignment - Engineering
- Assignment - cookery
- Assignment - Marketing
- Case Study - Chemistry
- Case Study - Accounting
- Case Study - Law
- Case Study - Management
- Case Study - Nursing
- Case Study - Finance
- Case Study - Computer Science and IT
- Case Study - Engineering
- Case Study - Economics
- Case Study - Biology
- Case Study - Auditing
- Case Study - Marketing
- Case Study - Project Management
- Coursework - Diploma
- Coursework - Accounting
- Coursework - Auditing
- Coursework - Biology
- Coursework - Management
- Coursework - Nursing
- Coursework - Finance
- Coursework - Computer Science and IT
- Coursework - Engineering
- Coursework - Humanities
- Coursework - Child Care
- Coursework - Project Management
- Coursework - Economics
- Coursework - Cookery
- Coursework - Law
- Dissertation - Accounting
- Dissertation - Auditing
- Dissertation - Biology
- Dissertation - Law
- Dissertation - Management
- Dissertation - Nursing
- Dissertation - Finance
- Dissertation - Computer Science and IT
- Dissertation - Humanities
- Dissertation - Economics
- Essay - Politics
- Essay - Childcare
- Essay - Accounting
- Essay - Biology
- Essay - Law
- Essay - Management
- Essay - Nursing
- Essay - Computer Science and IT
- Essay - Humanities
- Essay - Economics
- Essay - Auditing
- Essay - Engineering
- Essay - Architecture
- Essay - Finance
- Essay - Science
- Essay - Marketing
- Programming - Computer Science and IT
- Reports - Management
- Reports - Computer Science and IT
- Reports - Project Management
- Reports - Marketing
- Reports - Nursing
- Reports - Engineering
- Reports - Accounting
- Reports - Humanities
- Reports - Finance
- Reports - Architecture
- Reports - Biology
- Reports - Economics
- Reports - Childcare
- Reports - Law
- Research - Accounting
- Research - Auditing
- Research - Biology
- Research - Law
- Research - Management
- Research - Nursing
- Research - Finance
- Research - Computer Science and IT
- Research - Science
- Research - Engineering
- Research - Humanities
- Research - Economics
- Research - Project Management
- Research - Statistics
- Research - Architecture
- Research - Marketing
- Thesis Writing - Computer Science and IT
- Thesis Writing - Engineering
- Thesis Writing - Biology
- Thesis Writing - Finance
- Thesis Writing - Humanities
- Thesis Writing - Auditing
- Thesis Writing - Economics
- Thesis Writing - Law
- Thesis Writing - Nursing
- Thesis Writing - Accounting
- Thesis Writing - Architecture


.png)
~5.png)
.png)
~1.png)


.png)


