ACCT6005 Company Accounting Assessment 3 Case Study
Part A: This case study assignment help is designed to assess your understanding and application of knowledge using a practical case study to analyse and prepare relevant worksheet entries and financial statements for a Group.
Submission Instructions: Part A: • Submit Part A of the assessment document in a Word format and excel (see assessment question) including a coversheet. JPEG files or similar cannot be opened and will not be marked. • Submit via the Assessment link in the main navigation menu in ACCT6005 Company Accounting.
ACCT6005 Company accounting Assessment 3 Case study Part A
Assignment instructions: This assignment is to be completed using Microsoft word for the evaluation report (part a) and Excel for the entries, worksheet and Group financial statements (part b, c, d). Please use a separate sheet in excel for each separate part b, c and d.
Please ensure that your file name contains your student ID and your full name. Please ensure that you use the ‘Ref’ column in the worksheet to identify each separate consolidation entry.
Case study:
PART A (100 Marks)
Grape Ltd acquired all the issued shares of Duck Ltd for $940 000 cash on 1 July 2020.
The following information is available at this acquisition date:
The equity of Duck Ltd is provided below:
|
Share capital |
$495 000 00000 |
|
Retained earnings |
280 000 |
|
General reserve |
125 000 |
All the identifiable assets and liabilities of Duck Ltd were recorded at fair value in the statement of financial position. The company income tax rate is 30%.
The following transactions and events occurred during the year ended 30 June 2021:
1. During the year Grape Ltd sold inventory to Duck Ltd for $55,000 at cost plus 20%. Duck Ltd has sold 10% of these items externally as at 30 June 2021.
2. On 1 April 2021, Duck Ltd sold an item of inventory to Grape Ltd for $28,000. This inventory had cost Duck Ltd $20,000. Grape Ltd treated the item as plant and will depreciate it at 20% p.a.
3. Grape Ltd sold land to Duck Ltd for $25,000 which had originally cost $32,000.
4. Dividends: Duck Ltd paid $18 000 interim dividends in September 2020, and Grape Ltd declared $26 000 dividends in May 2021 (to be paid in October 2021).
5. On 1 July 2020, Grape Ltd provided an office for Duck Ltd’s administrative staff to use. Grape Ltd charges $700 per month. The last rental receipt received by Grape Ltd was on 30 April 2021.
Required:
Part (a) (36 marks)
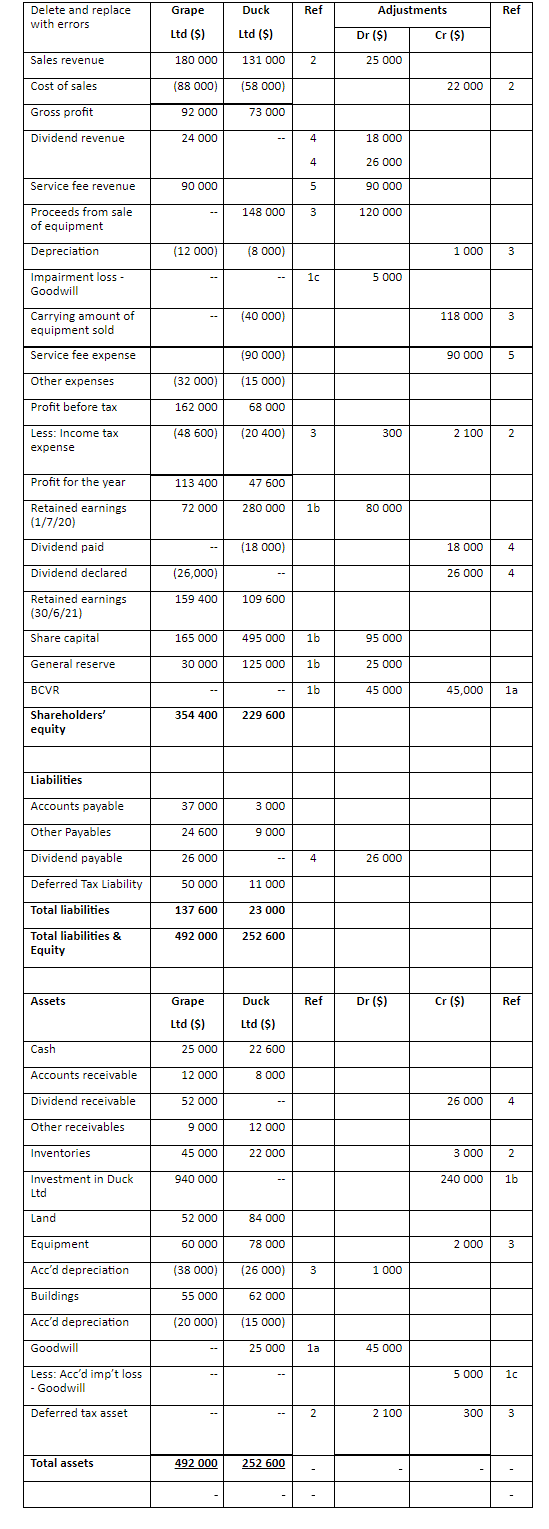
Analyse the completed worksheet attached for the Grape group. Using the information provided in the worksheet, prepare an evaluation report in word, detailing each omission and error. For each error:
1. List the accounts and amounts, which are incorrect for each consolidation adjustment.
2. Explain WHY the entry is incorrect. Include formulas where possible in your explanation.
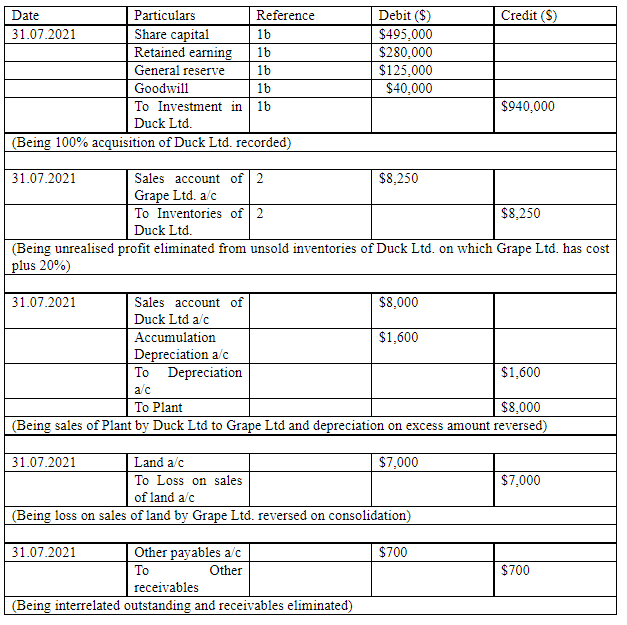
Part (b) Prepare the consolidation entries as at 30 June 2021 in excel using the template below. Include narrations for each entry: (28 marks)
|
Date |
Particulars |
Reference |
Debit |
Credit |
|
|
|
|
|
|
|
|
|
|
|
|
Part (c): Worksheet (24 marks)
Using excel, prepare the consolidation worksheet as at 30 June 2021, showing all entries including the corrected entries discussed in Part (a). Each entry needs to be entered as a separate amount and not entered as subtotals in the worksheet. Round your answers to zero decimal places. The worksheet template is provided below.
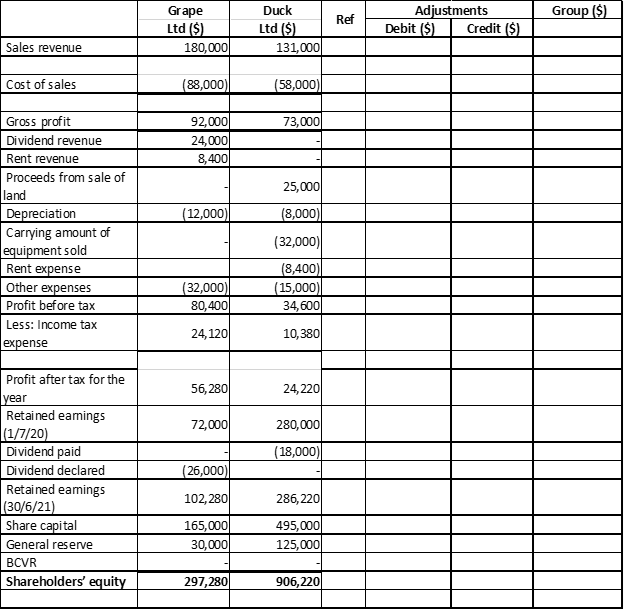
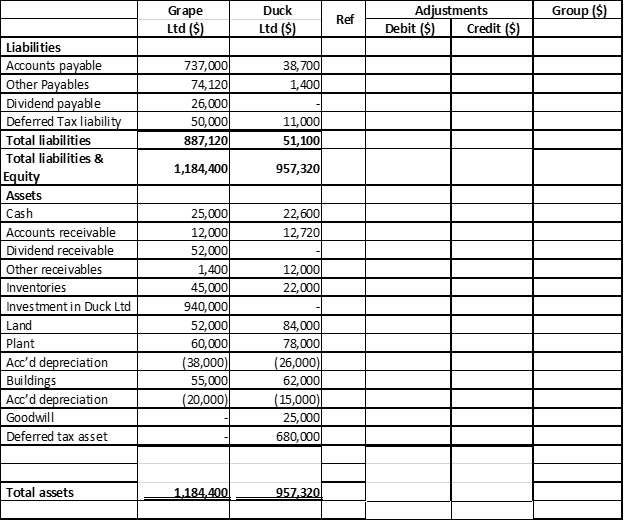
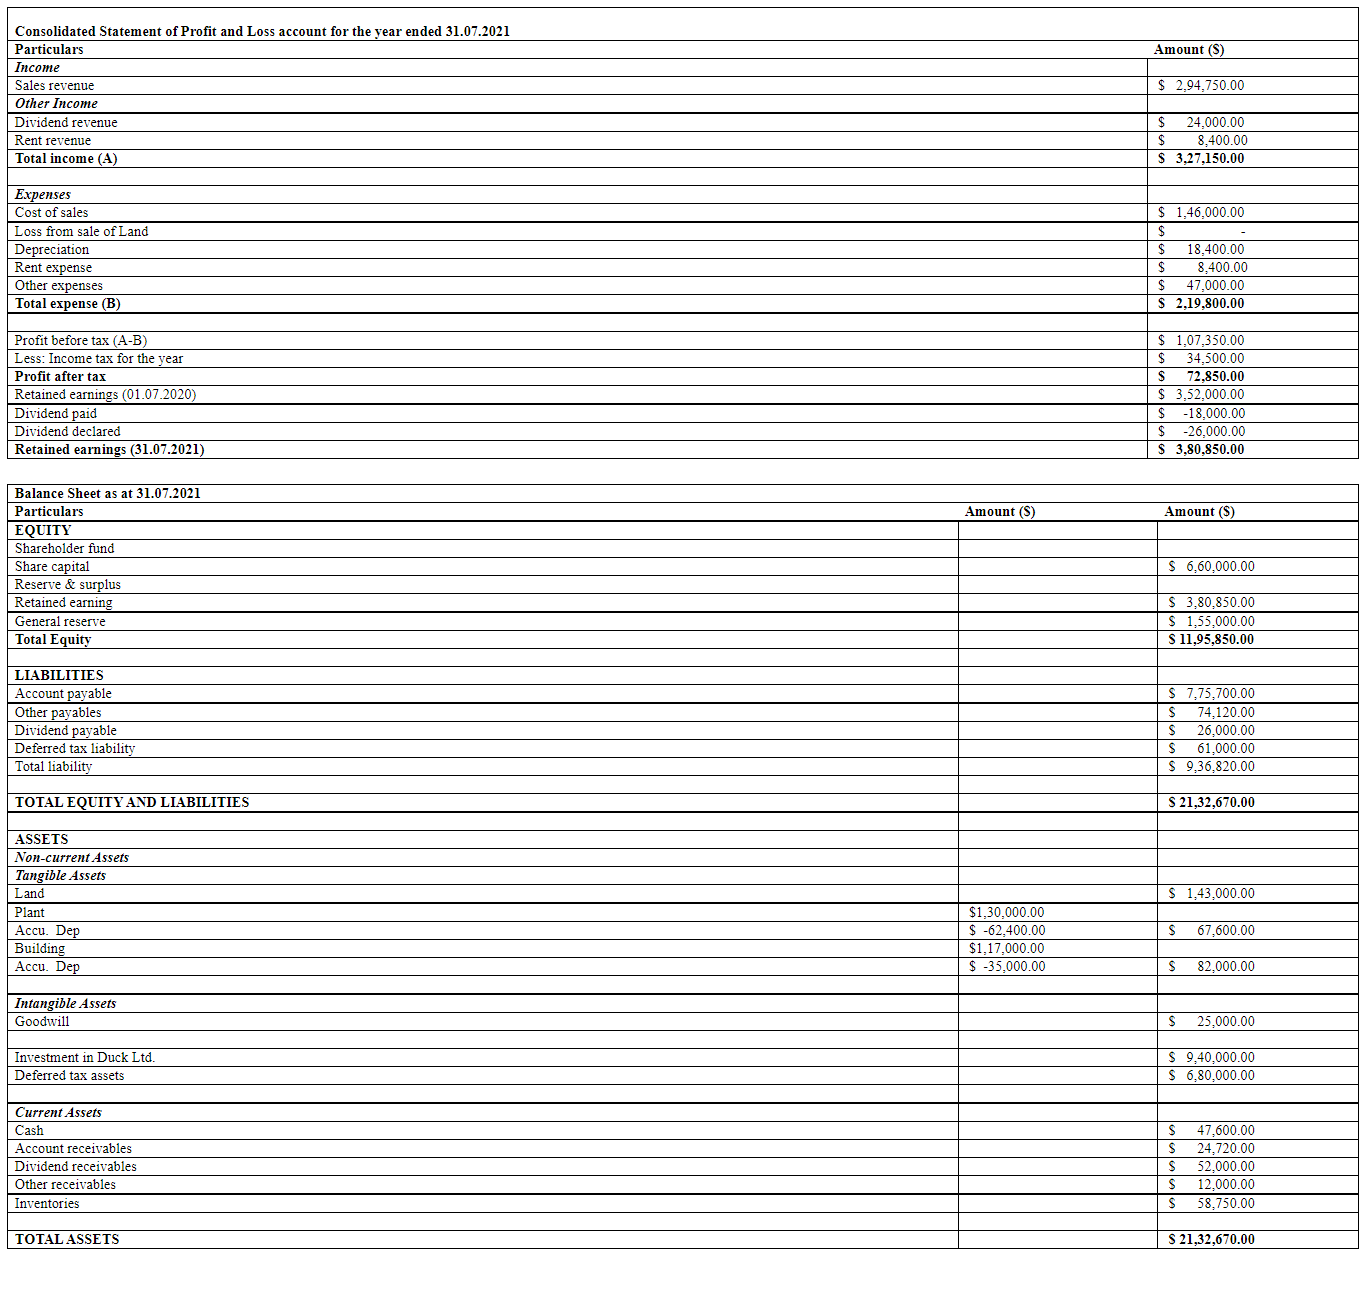
Part (d): Group financial statements (12 marks)
Using excel, prepare the Statement of Financial position for Grape Ltd as at 30 June 2021.
Solution
Part (a)
An acquisition can be defined as the difference between the price paid by the acquirer for purchasing another company and the original cost of the assets of the target company (Janice 2013).
Following entries or transaction is incorrect
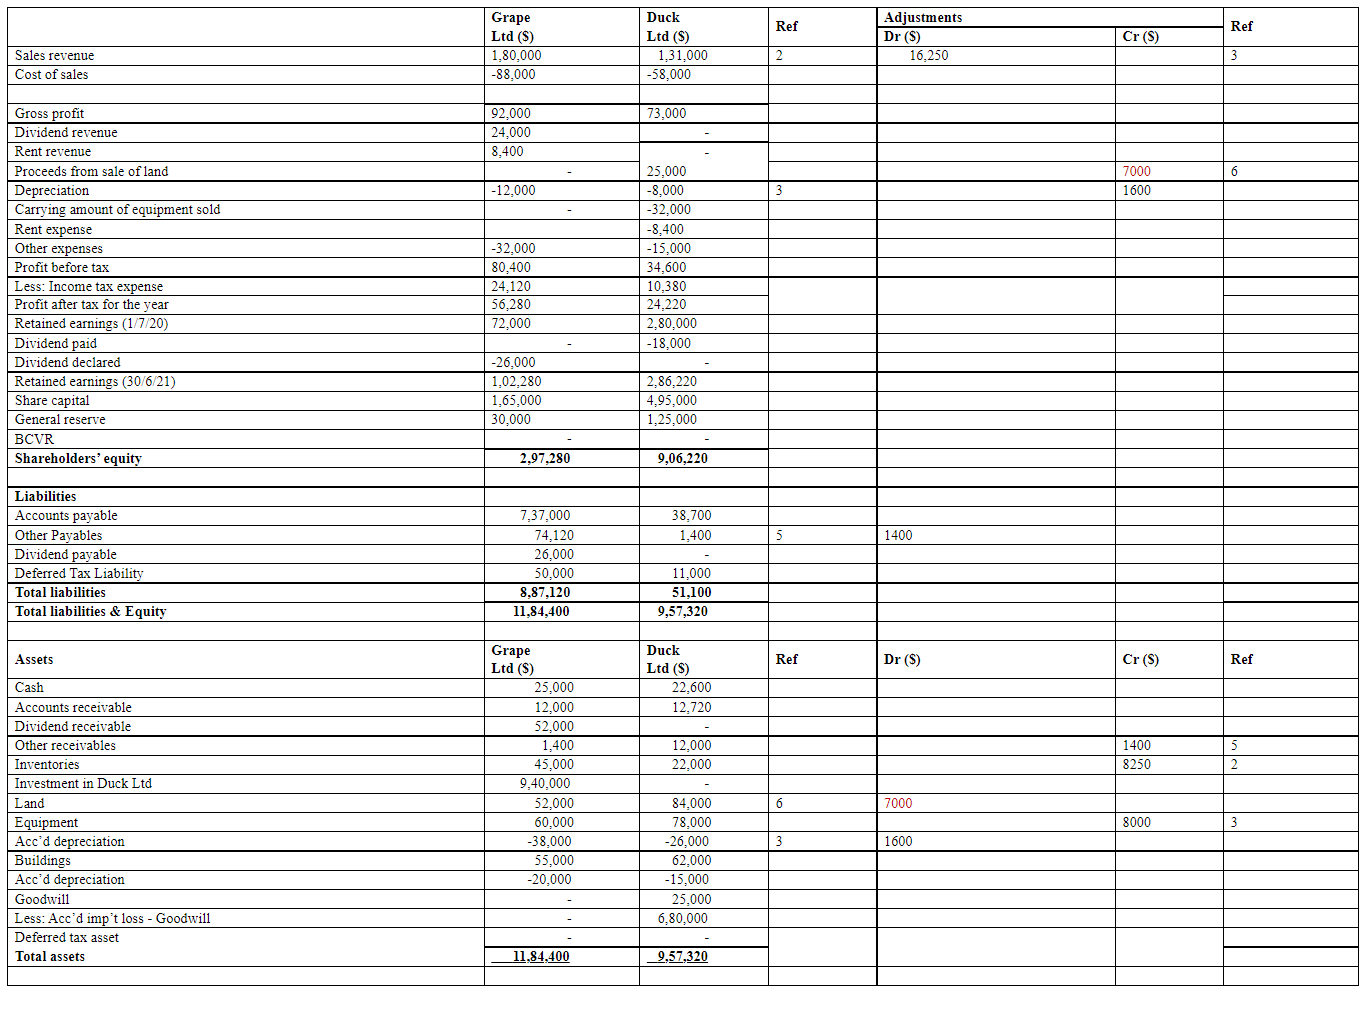
Reference 1:
Adjustment in Share capital, general reserve, retained earning & BCVR is incorrect and not required.
Reference 2:
Sales revenue- The amount of $25,000 debited in the sales account and $ 22,000 credited in the cost of sales account is incorrect- because for unsold stock with Duck Ltd, to eliminate the unrealised profit of Grape Ltd. the sales should have been debited with $8250 and Inventories should have been credited with $8250
Reference 3:
Adjustment entry done in Proceeds from sales of equipment and carrying amount of sold equipment, the related depreciation & entry done in equipment ledger in asset side is incorrect. Since Duck has treated Inventory and sold to Grape for $28,000 which cost Duck ltd $20,000 Therefore, the sales account of Duck should have been debited to a tune of $8000 and Depreciation account needs to be credited by $8000*20%= $1600 (which is excess on account of group sales) and the carrying amount of the equipment plant) needs to be reduced by net $6400 to eliminate the effect of the sales.
Reference 4:
All the adjustment relating to reference 4 needs to be removed since the dividend entry has already been correctly recorded no further adjustment required. Since Duke ltd (subsidiary of Grape Limited) pays interim dividend so its post-acquisition profit so it should be recorded in the profit and loss of Grape Limited and the same has been correctly recorded (AASB 2021)
Reference 5:
The adjustment for service expenses of $90,000 is incorrect as we need to just eliminate the outstanding and payable rent expenses which are for 2 months @$700 per month. Thus the correct adjustment should be debiting other payables account and crediting other receivables account to the tune of $1400
Reference 6:
Sales of land by Grape Ltd to Duck Ltd. for $25,000 cost $32,000. Thus, the unrealised loss of $7000 needs to be eliminated.
Herein the application of AASB 10 is observed because it develops the principles for preparation, as well as presentation of the consolidated financial statement when the entity has a control over one or more than one entities (AASB 2021)

Part b)
Part c)
Part d)
Consolidated Financial Statement of Duck Ltd
References
AASB. (2021) AASB Standard. Retrieved from https://www.aasb.gov.au/admin/file/content105/c9/AASB10_08-11.pdf
Janice, L. (2013). Understanding Australian Accounting Standards. Milton, Qld.: John Wiley and Sons. Retrieved from https://lesa.on.worldcat.org/oclc/807180288
Potter, B., Howieson, B., & Chapple, E. (2019). Accounting standards setting. Emerald Publishing Limited. Retrieved from https://lesa.on.worldcat.org/oclc/1113886538
ACCT6004 Management Accounting Assessment 2 Sample
Assignment Brief
Length - (1,800 words +/- 10%)
Learning Outcomes
a) Identify and analyses ethical and organizational issues confronting contemporary management accountants.
b) Categories and identify the nature of various types of costs, cost objects and cost behaviours and use cost estimation techniques to develop cost functions.
c) Apply cost accounting techniques to calculate the cost of a range of cost objects, as well as analyse costs.
d) Apply cost information to planning, control and decision-making.
e) Critically evaluate the relevance of both quantitative and qualitative costing information to management decision making.
Submission - by 11:55pm AEST/AEDT Sunday of Module 5.1 (week 9)
Weighting - 30%
Total Marks -100 marks
Context:
The purpose of this assessment is to establish the skills needed in the workplace for costing products and services using the appropriate processes and tools and applying analytical processes to construct accounting systems and models using workplace tools. Each question uses realistic data and the professional practices
similar to that found in workplaces.
Submission Instruction
Due Date/Time: 11:55pm Sydney time (AEST/AEDT) on Sunday 18th April 2021 Please aim to complete this assignment a few days prior to the due date to allow for any unforeseen circumstances such as illness, holidays, family issues, work commitments etc. You may submit the assignment early if you have other commitments around the due date.
All times listed are local (Sydney) times. For assignment help Please ensure you factor in any time difference between Sydney and your location when submitting your assignment, to avoid incurring any late submission penalties.
Please note the following important instructions relating to the assignment format and Submission:
• Note that this is an individual piece of assessment. You will need to work individually to prepare a response to ALL of the questions listed in the assessment.
• You must submit your assessment in one Excel file. Any submissions in any other file formats will not be accepted.
• Each question (including all sub-questions) should be presented in a single worksheet. As there are 5 questions in this assessment, your Excel file should contain 5 worksheets in total.
• You cannot scan handwritten responses and submit. All answers must be typed in Excel.
• Your assessment needs to be submitted though the submission links available on the Blackboard. Assignments submitted via e-mail (or any other method) will NOT be accepted.
• Make sure that you upload the correct file. If you discover (after the due date) that you have uploaded a draft version or the wrong file completely, you will not be allowed to submit a second file.
- The typo in Question 2-part C has been rectified in this version.
Question 1: Support Department cost allocation
Diamond Trust Bank has two support departments: The Human Resources Department and the Computing Department. The bank also has two operation departments that service customers directly: The Deposits Department and the Loan Department. The usage of the two support departments' output is provided below:
|
|
Providerofservice
|
|
|
Usersofservice
|
HumanResources
|
Computing
|
|
HumanResources
|
-
|
20%
|
|
Computing
|
20%
|
-
|
|
Deposits
|
50%
|
60%
|
|
Loans
|
30%
|
20%
|
The costs in the support departments and operation departments for the is presented below:
|
Departments
|
BudgetedCosts
|
|
HumanResources
|
$72,000
|
|
Computing
|
$120,000
|
|
Deposits
|
$300,000
|
|
Loans
|
$500,000
|
Required
a) Report the total costs of operation departments (the Deposits Department and the Loan Department) after the support departments' (the Human Resources Department and the Computing Departments) costs have been allocated using each of the following methods:
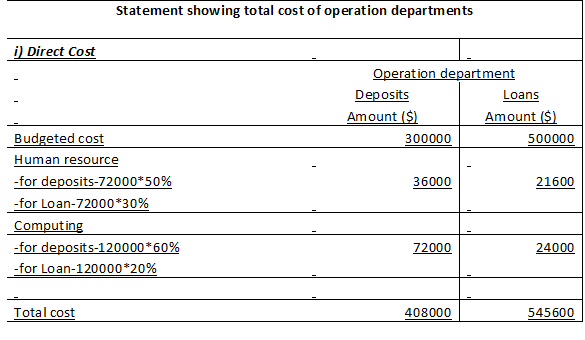
i) Direct Method
ii) Step Down Method (The bank allocates the costs of the Human Resources Department first.)
iii) Reciprocal Method
b) Diamond Trust Bank evaluates the performance of the operation department managers on the basis of how well they manage their total costs, including allocated costs. As the manager of the Loan Department, which allocation method would you prefer? Why?
Question 2: Job Costing
ACT Manufacturing Ltd. is highly automated company that uses computers to control manufacturing operations. The company uses a job-order costing system and applies manufacturing overhead cost to products on the basis of computer-hours. The following estimates were used in preparing the predetermined overhead rate at the beginning of the year:
|
Computer-hours
|
85,000
|
|
Manufacturingoverheadcost
|
$1,530,000
|
The company’s cost records revealed the following actual cost and operating data for the year:
|
Computer-hours
|
60,000
|
|
Manufacturingoverheadcost
|
$1,350,000
|
|
Inventoriesatyear-end:
|
|
|
Rawmaterials
|
$600,000
|
|
Workinprocess
|
$230,000
|
|
Finishedgoods
|
$1,756,000
|
|
Costofgoodssold
|
$2,800,000
|
Required
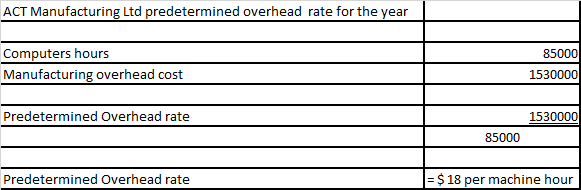
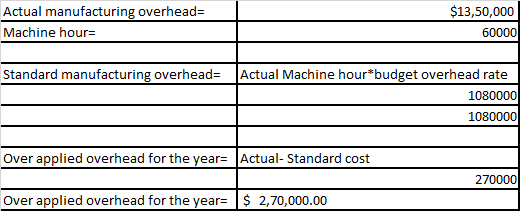
a) What is ACT Manufacturing Ltd.’s predetermined overhead rate for the year?
b) Calculate the company’s under applied or over applied overhead for the year.
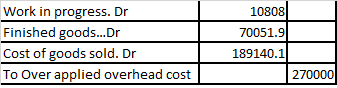
c) Assume that overapplied or underapplied overhead allocated on a pro rata basis to the ending balances in work in process, finished goods and cost of sales. The ending balance of these accounts are reported below. Prepare journal entries to show the allocation.
|
Workinprocess
|
$43,200
|
|
Finishedgoods
|
$280,000
|
|
CostofGoodsSold
|
$756,000
|
d) How much higher or lower will net operating income be for the year if the underapplied or overapplied overhead is allocated on a pro rata basis rather than closed directly to Cost of Goods Sold? Explain the reason for this difference.
Question 3: Process Costing System
Techsafe Company manufactures car seats. Each car seat passes through the assembly department and testing department. When the assembly department finishes work on each car seat, it is immediately transferred to testing department. The process-costing system at Techsafe Company has a single direct-cost category (direct materials) and a single indirect-cost category (conversion costs). Direct materials are added at the beginning of the process. Conversion costs are added evenly during the process.
The table below shows the relevant data for the assembly department for July 2020.
|
|
Physical Units
(Car Seats)
|
Direct Material Costs
|
Conversion Costs
|
|
Work in process, 1July2020(*)
|
5,000
|
$1,250,000
|
$402,750
|
|
StartedduringJuly
|
20,000
|
|
|
|
2020
|
|
|
|
|
Completedduring
|
22,500
|
|
|
|
July2020
|
|
|
|
|
Workinprocess,31
|
2,500
|
|
|
|
July2020(**)
|
|
|
|
|
Costsaddedduring
|
|
$4,500,000
|
$2,337,500
|
|
July2020
|
|
|
|
Note:
(*) Degree of completion: 100% for direct materials and 60% for conversion cost (**) Degree of completion: 100% for direct materials and 70% for conversion cost
Required
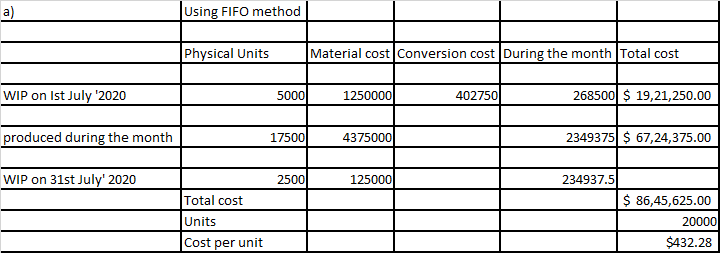
a) Determine the cost per equivalent unit for the Techsafe Company’s direct materials and conversion costs, and the total unit cost for the current period, under the FIFO method. Show all workings.
Determine the cost per equivalent unit for the Techsafe Company’s direct materials and conversion costs, and the total unit cost for the current period, under the Weighted Average method. Show all workings
Question 4: Cost Volume and Profit (CVP) analysis
Veritas Software is a leading Australian based accounting software manufacturer. It develops software packages for accounting firms located in Australia and overseas. Veritas is planning to release an upgraded version of their software soon. The company divides its clients into two groups: Local firms (those firms that operate in Australia) and Global firms (those firms that operate in overseas). Although the same physical product is provided to each client group, significant differences exist in selling prices and variable marketing costs:
|
|
Localfirms
|
Globalfirms
|
|
Sellingprice(perunit)
|
$195
|
$115
|
|
Variablecosts(perunit)
ManufacturingMarketing
|
$15
$50
|
$15
$20
|
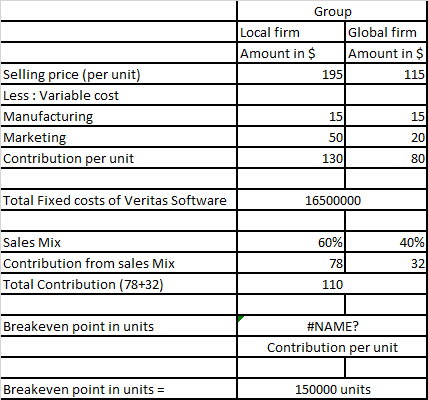
The fixed costs of Veritas Software are $16,500,000. The planned sales mix for the upgraded software in units is 60% Local firms and 40% Global firms.
Required
a) What is the break-even point in units for Veritas Software’s upgraded software if the planned sales mix is attained?
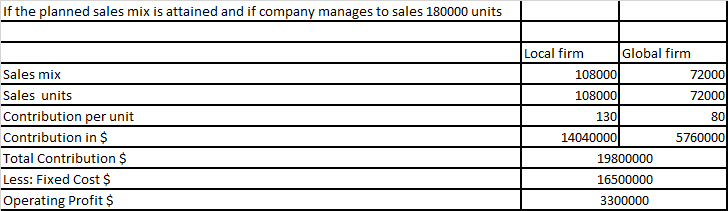
b) If the planned sales mix is attained, what will be the operating income when 180,000 units are sold?
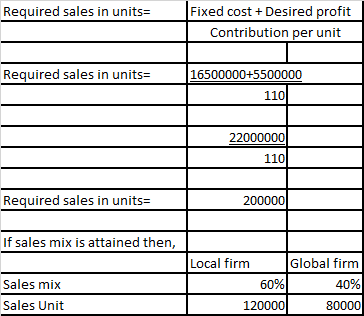
c) If Veritas Software wants to generate operating income of 5,500,000, how many units do they need to sell to Local and Global firms each? Assume that the planned sales mix is attained.
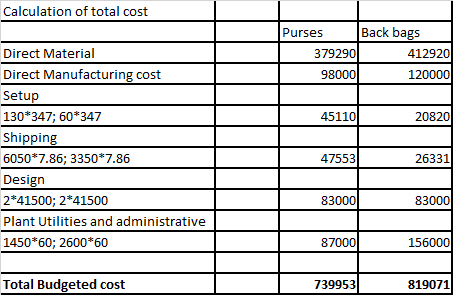
Question 5 Activity Based Costing
MaxPak is a designer of high-quality backpacks and purses. Each design is made in small batches. Each summer, MaxPak comes out with new designs for the backpack and for the purse. The company uses these designs for a year, and then moves on to the next trend. The bags are all made on the same fabrication equipment that is expected to operate at capacity. The equipment must be switched over to a new design and set up to prepare for the production of each new batch of products. When completed, each batch of products is immediately shipped to a wholesaler. Shipping costs vary with the number of shipments. Budgeted information for the year is as follows:
|
MaxPak
|
|
|
Budget forcostsandActivities
|
|
|
For theYearEnded30June2020
|
|
|
Directmaterials—purses
|
$379,290
|
|
Directmaterials—backpacks
|
412,920
|
|
Directmanufacturinglabour—purses
|
98,000
|
|
Directmanufacturinglabour—backpacks
|
120,000
|
|
Setup
|
65,930
|
|
Shipping
|
73,910
|
|
Design
|
166,000
|
|
Plantutilitiesandadministration
|
243,000
|
|
Total
|
$1,559,050
|
Other Budget information follows:
|
|
Backpacks
|
Purses
|
|
Numberofbags
|
6,050
|
3,350
|
|
Hoursofproduction
|
1,450
|
2,600
|
|
Numberofbatches
|
130
|
60
|
|
Numberofdesigns
|
2
|
2
|
Required:
a) Identify the cost hierarchy level for each cost category.
b) Identify the most appropriate cost driver for each cost category. Explain briefly your choice of cost driver.
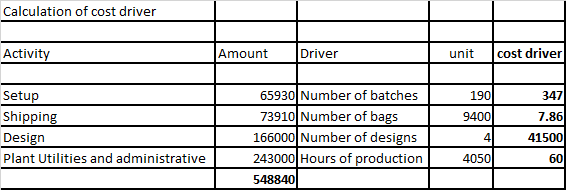
c) Calculate the budgeted cost per unit of cost driver for each cost category.
d) Calculate the budgeted total costs and cost per unit for each product line.
e) Explain how you could use the information in requirement 4 to reduce costs.
Solution
Answer 1
Part a
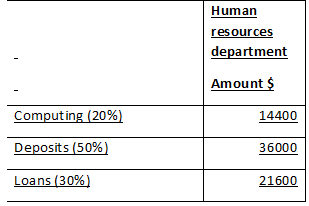
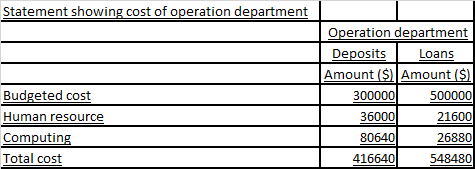
ii) Step down method
In step down method the cost of Human resource department shall be allocated first to
Cost of Human resource department is $ 72000
After allocation of Human resource then the second will be computing department
Cost of Computing department= 120000+14400 = $ 1,34,400.00
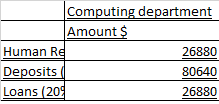
Part iii
In Reciprocal method the cost of computing allocated to Human resource shall be distribute again So, in this case $26880 allocated to Human resource from computing will be distributed again till it reduces to zero.
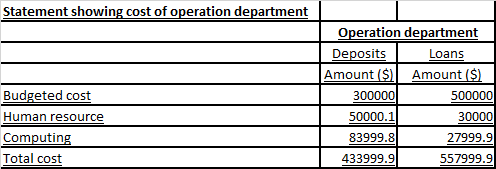
Part B
As a Manager we would always choose that method which provides most accurate measure of cost. Thus by evaluating all the three methods above it can be seen that Reciprocal method gives the most accurate evaluation of cost and thus will provide the most accurate performance evaluation
Answer 2
Part a
Part b
Part c
Part d
The company profit has got reduced due to over applied overhead. The cost of goods sold will increase and thus the profit margin will get reduce, thus the company should ignore over application of overhead cost
Answer 3
Answer 4
Part a
Part b
Part c
Answer 5
Part a
Direct Material
Direct Manufacturing cost
Plant Utilities and administrative
Design
Shipping
Setup
Part b
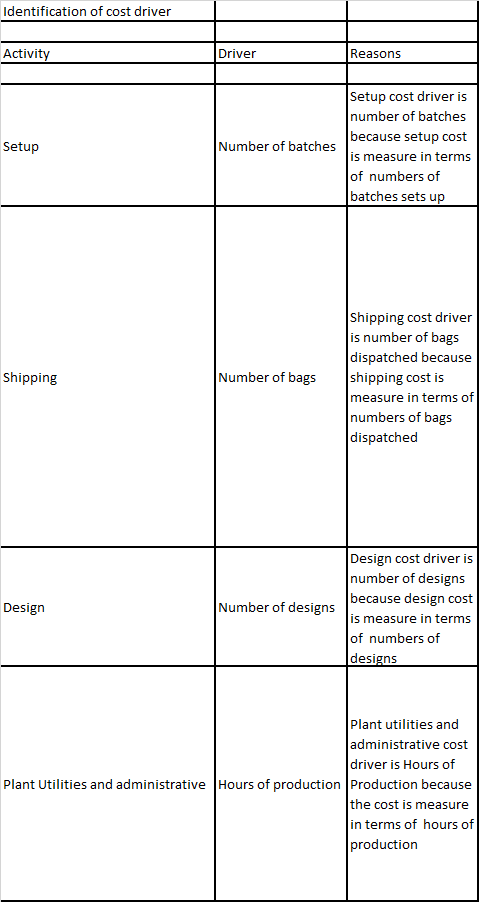
Part c
Part d
Part e
Use of ABC activity based costing gives the true view of cost allocation on the basis of cost driver and thus it eliminated traditional approach of cost allocation
STAT6003 Statistics for Financial Decisions Assignment Sample
Task 1:
Selecting your Random Sample and Creating your Sample Data File ( 8 Marks)
In order to select the sample data that will form the basis of your assignment you will need to make use of the random number table provided with this assignment help. The provided table of random numbers is, as the title suggests, a sequence of randomly generated numerical digits (0 to 9). These digits are arranged in a table with one hundred rows numbered 01 to 00 and twenty columns spread over two pages. The entries in each column of each row consist of five single digits.
The property data from which you will select your sample data consists of 400 IDs each with an identifying property number (PN) ranging from 1 (or 001) to 400.
Your first task is to select 50 three digit random (property) numbers ranging from 001 to 400 from the provided table of random numbers. We will ask you to select 50 numbers, to begin with, just to cover the distinct possibility that you may select the same three digit number more than once. The type of simple random sampling that we will be engaged in here is termed “without replacement” because we specifically do not want to allow a property identification number to be selected more than once.
In order to select your 50 random property identification numbers you will need to first go to a starting position row and column in the random number table. Defined by the last three digits of your Torrens University student identification number. The last two digits of your Torrens ID number identifies the row and the third last digit identifies the column of your (relatively) “unique” starting position. For the demonstration last three digits of 312, reading across row 12 from left to right starting at column 3 as instructed, you would encounter the following three digit numbers; 293 313 381 349 656 985 295
You need to record these first three acceptable ID numbers, 293, 313, 381 and 349 into the first column of an Excel spread-sheet and then continue this process until fifty valid three-digit personal identification numbers selected.
Task 2:
1. Provide the complete summary statistics for Market Price ($000) and Age of house (years). (5 Marks)
2. Describe the shape of the distributions for Market Price ($000) and Age of house (years). (5 Marks)
3. Test whether the population’s average Market Price ($000) is different from 777. (5 Marks)
4. Construct a 95% confidence interval for the Market Price ($000), also Interpret the confidence interval. (4 Marks)
5. Provide an introduction section on the rationale of your model , sample size, and the dependent and independent variables (including their unit of measurement) in this model. (4 Marks)
6. Plotthe dependent variable against each independent variable using scatter plot/dotfunction in Excel. Examine these scatter plots and correctly assess the strength and the nature of the
relationship between the dependent and the independent variables? (6 Marks)
7. Present the multiple regression model with complete regression summary output in your assignment. (6 Marks)
8. Provide the simple linear regression data analysis for the market price as the response variable and the Land size in Square meters as the explanatory variable. Write down the least square regression equation and correctly interpret the equation. (6 Marks)
9. Write a clear interpretation of the slope of the regression line from question 8. You must refer to the variables of interest. (4 Marks)
10. What is the value of the coefficient of determination for the relationship between the dependent and independent variable from question 8. Interpret this value accurately and ina meaningful way. (4 Marks)
11. State the 95% confidence interval for the slope coefficient and interpret this interval from question 8. (5 Marks)
12. Compare the multiple regression model (question 7) and simple linear regression model (question 8) and evaluate the goodness of fit between these two modelling techniques.(8 Marks)
13. Predict the market price of a house (in $) with a building area of 300 square meters. Explain why your answer is valid.(4 Marks)
14. By performing an appropriate hypothesis test what decision and conclusion would you draw about the hypothesis that the Land size in Square meters useful in predicting the market price of a house (in $)? Use the data provided to justify your answer, as appropriate.When answering this research question. (8 Marks)
15. For statistical analysis involving hypothesis testing in this assignment, you are required to:
• Formulate the null and alternative hypotheses for full model.
• State your statistical decision using significant value (α) of 5% for this test.
• State your conclusion in this context.
SOLUTION
Summary statistics is used to summarise data and get information from it. The summary statistics table comprises the values of central tendency which are obtained in the form of mean, median and mode along with measures of dispersion is obtained in the form of standard deviation and sample variance. In addition to this, distribution of data can be understood by calculating skewness, kurtosis and range (Cooksey 2020). Hence, from this table one can understand where the mean lies and how data is distributed around the mean value. The summary statistics of market price ($000) is shown in table 1. Similarly, the summary statistics of age of house that is measured in years is shown in table 2.
Table 1: Summary Statistics of Market Price ($000):
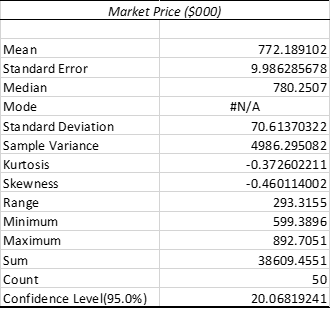
From the table, it is observed that average market price is $772.19 (‘000). Moreover, the standard deviation is 70.61 which implies that market prices of houses do not deviate largely from the mean value. The minimum market price of house in the collected sample file is $599.39 (‘000). Moreover, the maximum market price of house in the collected sample file is $ 892.71(‘000).
Table 2: Summary Statistics of Age of house (years)
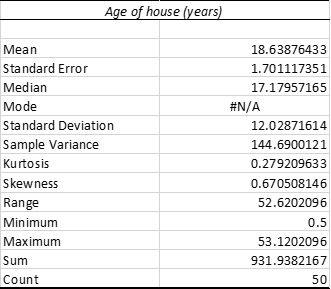
From the table, it is observed that average age of house is 18.63 years. Moreover, the standard deviation is 12.03 which implies that age of houses deviates largely from the mean value. The minimum age of house in the collected sample file is 0.5 year. Moreover, the maximum age of house in the collected sample file is 53.12 years.
2.
In statistics, skewness measures how a data set is distributed. A data set can be either symmetric or symmetric in nature. The main reason of measuring skewness is that it informs whether ata has larger extreme values or lower extreme values. As per the “Rule of Thumbs”, the skewness varies between -0.5 to 0.5 is known as symmetrical (Orcan 2020). The skewness of Market Price ($000) is -0.46 which lies within the boundary. Hence, it indicates that the distributions for this variable is almost symmetric. The shape of the distribution is also called a bimodal distribution.
On the other side, the skewness of Age of house (years) is 0.67 which lies between 0.5 and 1. Hence, it indicates that the distribution of data is moderately skewed towards the right direction. In other words, the distribution is positively skewed where mean value is higher than median.
The distributions of Market Price ($000) data as well as the same for Age of house (years) are demonstrated below by histograms.
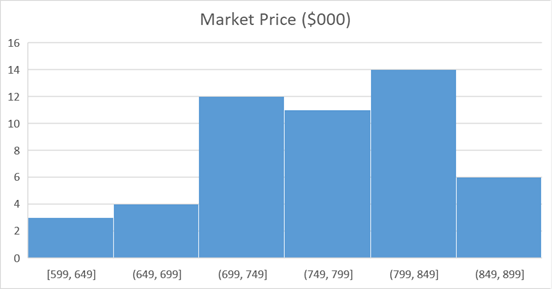
Figure 1: Distribution of Market Price ($000)
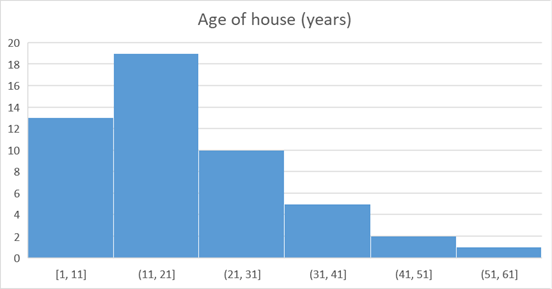
Figure 2: Distribution of Age of house (years)
3.
To understand if the average Market Price ($’000) of target population differs from 777 or not, one sample t-test (two-tailed) is conducted. Here, n is 50. However, population standard deviation is unknown. Hence, z-test cannot be applied.
Here, average Market Price ($ ‘000) is µ
Therefore, the null hypothesis is:
H0: the average Market Price ($’000) of the population is equal to 777
µ = 777
The alternative hypothesis is:
H1: the average Market Price ($’000) of target population is different from 777
µ ≠ 777
The outcome obtained from MS Excel is:
Table 3: One sample t-test (two-tailed test)
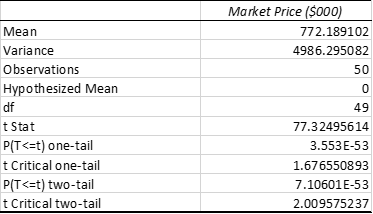
Here, the t statistics is 77.32 which is higher than t Critical two-tail value, which is 2. Hence, here, the null hypothesis is rejected. Moreover, the P-value in two-tail test is 0.00 which is less than 0.05 at 5% significance level (Xu et al. 2017). Hence, again the null-hypothesis is rejected. Thus, it implies that average Market Price ($’000) of the target population is not equal to 777.
4.
As per the outcome obtained from Excel, the value of Confidence Level at 95% is 20.07
Thus, the lower interval is (mean – confidence level) = 752.12
the upper interval is (mean + confidence level) = 792.26
Here, confidence interval represents actual upper and lower values. It implies that the 95% of the time, the researcher can expect that the real mean will fall between 752.12 and 792.26.
5.
The model of regression analysis is selected to forecast the dependent variable by independent variable(s). The regression model is categorised depending on the number of independent variables. Hence, to determine dependent variable with one independent variable, linear regression model is applied. Moreover, to determine dependent variable with more than one independent variable, multiple regression model is applied (Montgomery, Peck and Vining 2021). The sample size in this study is 50, which are selected by applying simple random sampling technique without replacement. The four variables are market price ($000), Sydney price Index, total number of square meters and age of house (years). In regression model, market price ($000) is considered as dependent variable while others are considered as independent variables. The scatter plots are also made to measure the strength of association between independent and dependent variable.
6.
A scatter plot is a form of statistical diagram that shows values for two variables and measure a relationship between them. Hence, this plot is used to show the relationship visually to understand the strength type of the relationship between these two variables. In general, this plot is of 3 types, which are positive, negative and no correlation (Akoglu 2018). The relationship of the dependent variable with each independent variable is shown by scatter plots.
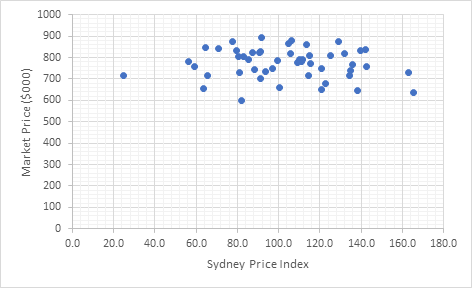
Figure 3: Scatter Plot Diagram between Sydney Price Index and Market Price ($000)
Figure 3 represents a scatter plot diagram to show relationship between independent variable Sydney Price Index and dependent variable Market Price ($000). From the figure, it is seen that these two variables do not have any relationship with each other. In other words, the diagram indicates that Sydney Price Index does not relate with Market Price ($000). Hence, variation in Sydney Price Index cannot tend the Market price to variation in same or opposite direction specifically.
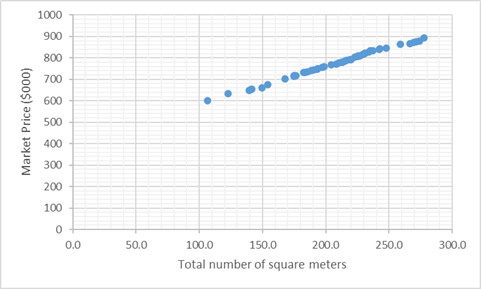
Figure 4: Scatter Plot Diagram between Total number of square meters and Market Price ($000)
Figure 4 represents a scatter plot diagram to show relationship between independent variable Total number of square meters and dependent variable Market Price ($000). From the figure, it is seen that these two variables have strong and positive correlation. In other words, the diagram indicates that there if Sydney Price Index increases, Market Price ($000) price also increases and vice versa.
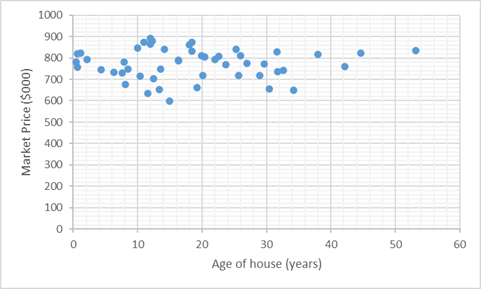
Figure 5: Scatter Plot Diagram between Age of house (years) and Market Price ($000)
Figure 5 represents a scatter plot diagram to show relationship between independent variable Age of house (years) and dependent variable Market Price ($000). From the figure, it is seen that these two variables do not have any relationship with each other. In other words, the diagram indicates that there is no relationship between Age of house (years) and Market Price ($000). Hence, age of house cannot tend the Market price to change in same or opposite direction specifically.
7.
The following table represents summary outcome of multiple regression model:
Table 4: Calculation of Multiple Regression
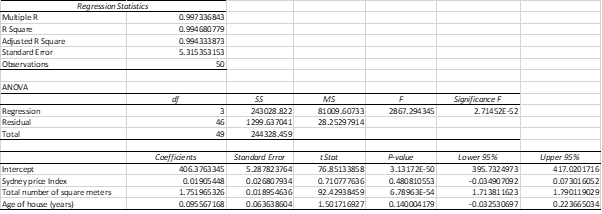
From table 4, the following equation of multiple regression is obtained:
Market Price ($000) = 406.38 + 0.02 Sydney Price Index + 1.75 Total number of square meters + 0.1 Age of house (years)
In this equation, 406.38 is the intercept of regression equation. Moreover, 0.02, 1.75 and 0.1 are beta coefficients. Beta coefficient of an independent variable implies the magnitude of change in the dependent variable when this independent variable changes by 1 unit.
If Sydney price index increases by 1%, the market price of houses will increase by $ 0.02 (‘000). If total number of land size increases by 1,75 square meters, then market price of house will increase by $1.75 (‘000). If age of houses increases by 1year, then market price of that house will increase by $0.1 (‘000). Hence, from the equation, it is seen that each independent variable has positive influence on the market price of house.
8.
Table 5: Calculation of Simple Linear Regression
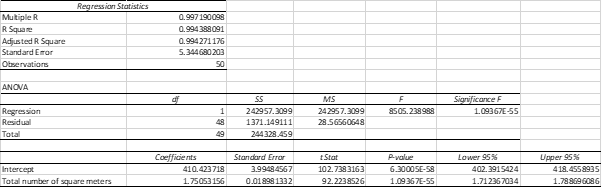
The obtained Simple linear regression equation is:
Market Price ($000) = 410.42 + 1.75 total number of square meters
According to the above equation, market price of a house can be high even if land size in square meters of the house is unavailable.
9.
From the multiple regression equation of question 8, the slopes are described below.
The slope of the regression line is the beta coefficient of total number of square meters. It implies that if land size increases by 1 square meters, the market price will increase by $1.75 (‘000).
10.
The value of R-square is 0.99 which means independent variable can define 99% of variation of the dependent variable.
11.
At 95% confidence interval, the slope coefficients are: lower limit: 1.712 and upper limit: 1.789. For intercept, the lower limit is 402.392 and upper limit is 418.456.
12.
The value of R-square in question 7 is 0.99 while that in question 8 is 0.9 as well. Hence, it is observed that the value of R-square in both models are almost equal to 1. Moreover, the value of the coefficient of determination or adjusted R-square for the association between dependent and autonomous variables is 0.99 as per table 4. It implies that independent variables can predict almost 99% of variation of the dependent variable. Hence, it indicates a strong and positive correlation between dependent and independent variables.
Hence, models fit the data perfectly.
13.
From simple linear regression equation, obtained in question 8, the market price of house (in $) can be obtained when a building is given as 300 square meters.
Market Price ($) = 410.42 + 1.75 * 300
Market Price ($) = 410.42 + 525
Market Price ($) = 935.42
Here, the answer is valid as the obtained relationship is statistically significant as significance F value of the equation is 0.00 at 5% significant level and hence it is less than 0.05.
14.
The null hypothesis states no association between market price and land size which is measured in terms of square meters:
H0: b1 ≠ 0
The alternative hypothesis states an association between market price and land size which is measured in terms of square meters:
H1: b1 = 0
The hypothesis is tested at 95% significant level when α = 0.05
At 5% significant level, p-value is 0.00, which is lower than 0.05. Hence it implies that the alternative hypothesis is true and the equation is statistically significant. In other words, it can be said that there is a positive linear relationship between market price ($000) and land size in square meters.
15.
The full model is the multiple regression model.
In this model, the null hypothesis is:
H0: Each independent variable is statistically insignificant
The alternative hypothesis is:
H1: At least one of the autonomous variables is statistically significant
The hypothesis is tested at 95% significant level when α = 0.05
In table 4, the p-value for Sydney price index and age of house (years) are 0.48 and 0.14 which are greater than 0.05 at 95% confidence interval. This means the null hypothesis is true which means these two autonomous variables are not important in explaining market price of the houses in thousand dollars.
On the other side, the p-value for total number of square meters and age if house (years) is 0.00 which is less than 0.05 at 95% confidence interval. This means the null hypothesis is rejected as the independent variable is significant in measuring and predicting market price of the houses in thousand dollars.
Moreover, the significance F is 0.00 which is less than 0.05 at 5% significant level. It accepts the alternative hypothesis that at least one of the autonomous variables is significant.
In conclusion, it can be said that market price of houses can be determined properly by land size of houses in square meters. On the contrary, Sydney price index and age of house (years) cannot measure market price of houses correctly. Thus, to determine market price of house, it is better to consider land size of it in terms of square meters. The significant relationship between autonomous variable and dependent variable is understood by the linear regression model. The P-value is used to determine whether the relationship is significant or not.
References:
Akoglu, H., 2018. User's guide to correlation coefficients. Turkish journal of emergency medicine, 18(3), pp.91-93.
Cooksey, R.W., 2020. Descriptive Statistics for Summarising Data. In Illustrating Statistical Procedures: Finding Meaning in Quantitative Data (pp. 61-139). Springer, Singapore.
Montgomery, D.C., Peck, E.A. and Vining, G.G., 2021. Introduction to linear regression analysis. John Wiley & Sons.
Orcan, F., 2020. Parametric or non-parametric: Skewness to test normality for mean comparison. International Journal of Assessment Tools in Education, 7(2), pp.255-265.
Xu, M., Fralick, D., Zheng, J.Z., Wang, B., Tu, X.M. and Feng, C., 2017. The differences and similarities between two-sample t-test and paired t-test. Shanghai archives of psychiatry, 29(3), p.184.
ACCT6005 Company Accounting Case Study Sample
Context:
- Assessment coverage: Module 1 Fair Value adjustment and Module 2 Intra group transactions.
- Part A: This assignment is designed to assess your understanding and application of knowledge using a practical case study to analyse and prepare relevant worksheet entries and financial statements for a Group.
- Part B: You will be required to prepare a short video (8 minutes +/-10%) addressing specific questions in this assignment. You will recommend and communicate strategic recommendations regarding various types of consolidation adjustment entries. This is designed to access your understanding of the concepts covered in Module 1 and Module 2 and assess your communication skills to your audience.
Please ensure that your presentation includes reference to relevant Australian Accounting Standards (AASB).
Solution
Question 1:
The accounting for the acquisition is made as per the AASB three-paragraph 5, which hopes in the process of calculating the process of purchase which includes the identification of the one who will acquire. Determination of the date of acquisition along with the measurement of the identifiable as it's acquired in the acquisition process and the debts and any non-controlling interest in the acquiree. Furthermore, recognition and measurement of the goodwill or profit from bargain purchase needs to be done. For Assignment Help Therefore for the equation analysis, we need four different aspects to be covered. Is that the purchase consideration is being paid to the Acquiree, recognizing the identifiable assets and liabilities purchased and calculation of goodwill. In the calculation of purchase consideration, all the payments made with her in the way of cash or equity or both should be included. Whereas for the measurement of the value of net identifiable assets, the assets fair value and its book value should be considered. However, if there is a difference between the book value and the fair value of any asset and the purchasing companies recording the assets at its fair value difference of the fair value and book value includes a tax treatment, which should be adjusted either as DTA or DTL. Further, the gain or loss arising in adjustment after the tax effect will be adjusted with BCVR. If the purchase consideration is higher than the net value of the asset acquired, then the goodwill will be recognized for the difference amount; on the contrary, again on bargain purchase will be recorded.
Question 2:
In the given case scenario, the inventory’s book value is $30,000, whereas its fair value is $40,000; this signifies that the inventory’s fair value and the book value are not the same; therefore, it should be adjusted. In this case, the fair value of the inventory is higher than the book fellow; therefore, again on acquisition should be recognized (Ayres, Huang & Myring, 2017). the gain on acquiring the inventory amounts to $10000 ($40000 -$30000). However, the entire amount will not be recognized again due to the tax rate of 30%. Here the tax liability for the fair value accounting will be $3000, and the BCVR adjustment will be $7000.
Question 3:
In the given case, as Joel is acquiring 100 persons takes in Billy. Therefore any liability relating to the dividend payable is required to be eliminated due to double accounting. Does in the calculation of purchase Thus in the calculation of Purchase Consideration dividend payable by Billy is ignored.
Question 4:
In the consolidation process, as there is 100% acquisition and no non-controlling interest, therefore the entire income, expenditure, assets, and liabilities of the parent company and the subsidiary company will be adjusted. Therefore in the consolidation process, all the income of Billy is acquired to be added with the income of Joel. However, there are some intergroup transactions such as the sale of plant and machinery inventory in between the party we just having a profit or loss aspect. Therefore it should be eliminated for double accounting. For the elimination of the value of inventory or any asset sold by the parent to subsidiary or subsidiary to parent, only the profit part should be eliminated. However, if the Product is sold to external parties, then the profit should not be illuminated (Leo et al., 2018).
Question 5:
In the case of consolidation entries, the difference between the book value and the fair value after exiting the taxes is transferred to the DC fear so that the loss or gain on the fair value acquisition is determinable. In the end, any adjustment relating to the acquisition process is adjusted with this account, at the closing of the acquisition process, the BCVR transfer or to the financial statement or reserves. The making of BCVR adjustment it's to make a detailed statement about the profit and loss arising in the consolidation process.
Question 6:
The given scenario presents that Joel has given a loan to Billy limited for $326,000. However, in the consolidation accounting process, order preparation of consolidated financial statement any intragroup transactions between the parent and the subsidiary is required to be eliminated. Therefore the adjustment for the loan provided by the parent for the subsidiary should be deducted from its asset section. Similarly, the liability of the loan should be eliminated from the books of Billy limited. Along with that, any interest expense or income is it recognized by any parties relating to the loan provided by the parent should be eliminated from the books. Therefore, in the adjustment, the interest received by Joel from Billy and the loan liability is eliminated, and the same treatment is made in the books of Billy for eliminating the unrealized gain or losses (Cîrstea, Nistor & Tiron Tudor,2017).
Reference:
.png)
ACCT6005 Company Accounting Case Study Sample
Context:
• Assessment coverage: Module 1-2 Fair Value adjustment and Intra group transactions.
• You are required to demonstrate: the assumed knowledge and skills from Module 1 Introduction and Principles of Consolidation; understanding and ability to account for fair value adjustments and intra group transactions.
• You are able to prepare: acquisition analysis, adjustment entries for group using the consolidation worksheet, and consolidated financial statements.
• You are able to recommend and communicate strategic recommendations regardingfair value adjustment entries.
Instructions:
• Show all relevant workings where required.
• Combine the answers for both Part A and Part B into one assessment document.
Solution
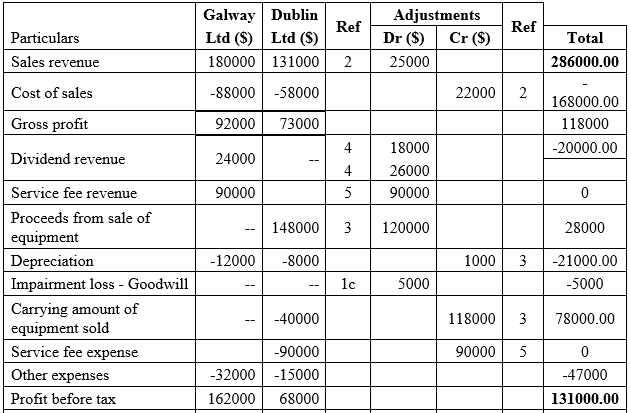
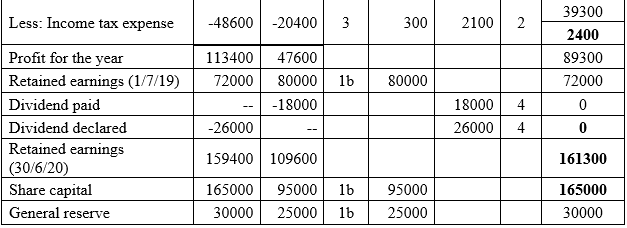
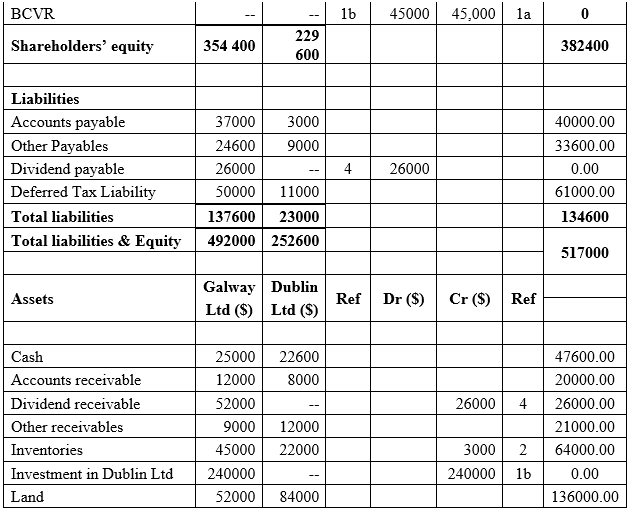
Part A
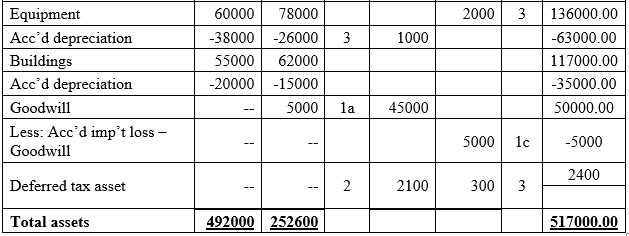
Point 1: Goodwill
1. The accounts that would get affected from the impairment of Goodwill are Goodwill, Retained Profit, BCVR, Investments in Dublin.
2. The above accounts have not been adjusted to eliminate the intragroup impairment of Goodwill of $5000.
It is to be further noted that Goodwill treatment would not get affected from the tax rate.
The individual companies would have passed the following entries before consolidation are as follows:

3. The Elimination Entry would be for the stated situation are as follows
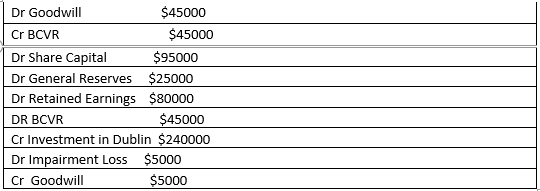
4. If this error is not corrected, goodwill would be shown at book value instead of showing at fair value leads to which the value of assets would be shown at overstated value by $5000. As per the IAS 36 goodwill should be impaired if the book value is less than the fair value of the market. In the currents scenario goodwill of the Dublin Ltd has been impaired by $5000 and this should be shown at the consolidated balance sheet. Since the goodwill which has been acquired during the time of acquisition has been impaired the same should be reduced by $5000 to show the net and true effect. For Assignment Help Further, any impairment or any improvements in the valuation of the goodwill would be capitalized as such treatment is not regular in nature. However, in the current scenario as the impairment of goodwill has risen after acquisition hence the same should be reduced from the Retained Earnings. Also, impairment expense is the different type of expense for the company and hence this should not mix up with any other expense. (Glaum, Landsman, Wyrwa, 2018)
Point 2: Sales of inventory
1. The accounts that would get affected from the sales of inventory in between the companies are Cost of goods sold, Sales, Inventory, Net Profit.
2. The above accounts have not been adjusted to eliminate the intragroup unrealized profit of $3000.
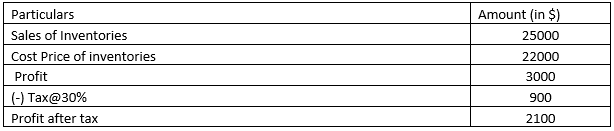
The individual companies would have passed the following entries before consolidation are as follows:
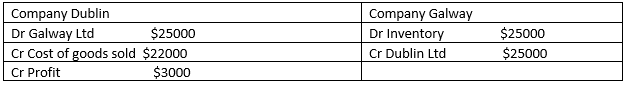
3. Elimination entries for the current adjustment is follows
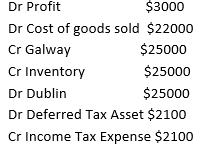
4. If this error is not corrected, inventory and profit would be shown at inflated value. Further, the overall value of the assets would reflect at the inflated values as the value of the inventory has been inflated. On the other side liabilities would be inflated due to the profit arrived from such sale. The intra group adjustment should be made appropriately so that net effect can be shown. Therefore, such adjustments have to make to deliver true and fair balance of the financial statements so that the value of assets and liabilities should reflect at correct balance. The profit would change for the company as the profit from the sale of inventory would reduce from the total profit. (Dubolazov, Simakova, Dubolazova, Makarov, 2020)
Point 3: Sale of Equipment
1. The account that would get affected from the sale of equipment in between two companies are Galway, equipment, Profit on equipment, Dublin.
2. The above accounts have not been adjusted to eliminate the intragroup unrealized profit of $5600. The sale of equipment between both the companies should be excluded as the same is considered under intra-group transaction.
.png)
The individual companies would have passed the following entries:
.png)
3. Elimination Entry for the current adjustment is follows
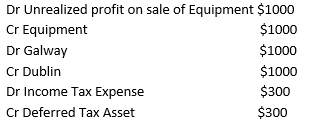
4. If the above adjustment has not being made then assets and liabilities both would be shown at inflated values. The correct value of the equipment would be ignored and the unrealized profit that should be ignored has taken into consideration. Hence, net gain after tax should be excluded for the purpose of correct evaluation of the equipment. (Dutt, Nicolay, Spengel, 2021)
Point 4: Dividend
1. The account which have been affected Dividend received, Dividend Payable, Dublin, Galway.
2. The above accounts have not been adjusted to eliminate the intragroup adjustment of $18000. The date of acquisition is 1st July 2019 and dividend paid on September 2019 which is the part of post-acquisition profit and hence should be credited in the profit and loss account. Any revenue occurred after the acquisition should not be capitalized. Further, Galway Ltd has declared the dividend as on May 2020 and the same would be paid on October 2020.
The individual companies would have passed the following entries:
.png)
3. Elimination of entries for the current adjustment is follows
.png)
4. If the above adjustment has not being made then assets and liabilities both would be shown at inflated values leads to which the balance sheet of the company would not deliver true and fair statements. Further, dividend payment and received would show double effect which is not correct as per the international accounting standard. There would be no difference in the accounting of net profit as dividend is being paid after arriving at profit. The intra group transactions should be adjusted while preparation of the consolidation account so that the financial statement should deliver true value. As per the international accounting standard while preparation of the consolidation net effect should be shown.
Point 5: Charge of service Fees
1. The account which have been affected Galway, Dublin, Service Revenue, Service Expense.
2. The above accounts have not been adjusted to eliminate the intragroup adjustment of $9000 ($90000 x 10%). AS 90% of $90000 has already paid by Dublin Ltd to Galway Ltd.
The individual companies would have passed the following entries:
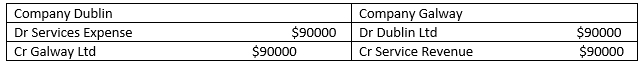
3. Elimination of entries for the current adjustment are as follows:
Dr Service Revenue $90000
Cr Service Expense $90000
4. If the above adjustment has not being made then assets and liabilities both would be shown at inflated values leads to which the balance sheet of the company would not deliver true and fair statements. In the current scenario, Dublin Ltd has purchased services expenses from Galway Ltd which leads to creation of creditors in Dublin Company and creation of debtors in the account of Galway Ltd. To show the net effect both the transaction should be eliminated. However, the value of the net assets and equity would not change for a group but the assets and liabilities would be inflated by $9000 in the financial statements. The Gross Profit would not change but the reporting of income would accordingly overstated by such amount. (Piuzzi, Song, Bigach, Khlopas, Mont, Vega, 2019)
Part B
From the above adjustments the consolidation report has been created in which net affect has been considered thereby eliminating all the previous stated entries that enables us to understand the true and fair view of the financial statements of the company. As per the international accounting standard all the intra group entries should be adjusted effectively to deliver correct value of the statements.
References
.png)
ACCM6000 Capstone Accounting and Governance Case Study 2 Sample
Assignment Details
Your Task
Analyse the corporate governance practices of a given organisation and identify challenges in terms of sustainability and risk. Interpretandcritically analyseorganisational risk and sustainability practice, prepare a written memorandum, and deliver a presentation that addresses challenges and opportunities.
As the capstone unit, this subject requires students to bring together their accounting and governance knowledge and techniques developed within prior subjects and throughout this course and apply these to the interpretation, analysis and critique of present-day business and governance practices to identify problems and to propose solutions. Building on students' in-depth understanding of relevant theories and practices already developed in accounting and governance and their proficiency in the tools and techniques, this assessment further develops research, analytical, critical thinking and problem-solving skills demanded by the accounting profession in the 21st Century.
This is an individual assessment that requires an analysis of a [given] case study/scenario, out of class and the preparation of a memorandum for submission by Turnitin
Following are the general instructions for completing this assessment.
1. Read and analyse the case study, paying attention to the business context and any issues and concerns facing stakeholders.
2. Based on the issues identified in the case study, conduct research of academic journals, professional practitioner literature and recent news releases relating to "best practice corporate governance," "sustainability," and "risk management practices."
3. Based on your analysis, prepare a written memorandum (1,500 words) to those charged with governance that addresses the different views and positions of the stakeholders and investors presented in the case study along the following lines:
a. Provide advice and recommend corporate governance practices which will positively contribute to the business strategy and goals presented in the case study.
b. Provide a summary of the significance, benefits, and challenges of producing sustainability and other non-financial reports for the business operating in the specific industry presented in the case study.
Solution
1. Introduction
Since its founding in 2016, Moka Restaurant Group (MRG) has carved out a position for itself. Renowned dietitian Suzy Cartier mounted it. This employer is pleased with its portfolio of innovative consuming thoughts, which incorporates Moka, Supper Club, Feast, and Zoom. This logo has received popularity for its creative technique in culinary studies, all while specializing in presenting inexpensive consuming alternatives acquired from sustainable carriers. As a result, paintings are being achieved to draft a document to look at MRG's company governance practices, consisting of a look at the business enterprise's governance shape, sustainability applications, and operational nuances.
2. Memorandum
2.1 Problems or Issues of Concern Facing Stakeholders
To protect the openness of fashionable-reason financial reviews for foremost users, corporations are required by way of the General Requirements Standard underneath IFRS S1 to post extensive statistics concerning sustainability-associated dangers and possibilities. The four major pillars of this general are key overall performance indicators, method, governance, and risk management. At the moment, businesses need to make sure that their sustainability disclosures fit their GPFR, publish substantial records at each degree in their supply chain, and encompass sustainability disclosures into their every-year financial statements related to the problems or troubles of dealing with stakeholders (Shahwan, 2020).
- Related Party Transactions: To save you from conflicts of interest and make sure that positive transactions match marketplace language, MRG's insurance requires openness and trustworthy dealing in related party transactions. However, concerns about independence and justice are raised via the discretionary authority positioned in important people for The assignment helpline.
- Financial Performance Measures: MRG's acknowledgement of an upward push in income and the next discount in funding demonstrates the use of traditional accounting requirements to assess the company's overall performance.
- Sustainability Practices: MRG is aligned with the growing variety of accounting systems that emphasize social and environmental obligation on the subject of sustainability. However hard situations concerning the safety of packaging and the precision of detailed facts highlight how essential correct reporting and danger evaluation are to sustainable accounting approaches (Jejeniwa, 2024).
- Risk Management: The structure of a risk committee demonstrates that MRG respects organization governance requirements and acknowledges the need for hazard oversight. However, the committee's early detection of ownership-associated risks points to the need for greater thorough danger identification and manipulation, taking operational, monetary, and regulatory concerns into consideration.
2.2 Corporate Governance Advise
The International Accounting Standards Board (ISSB) has released IFRS S1 and S2, aiming to improve sustainability disclosure quality and address environmental and social issues. These standards follow four pillars: metrics and objectives, governance, and strategy. Metrics and objectives evaluate an organization's performance; governance is the framework for implementing these methods; and strategy is the plan for achieving its objectives. These guidelines aim to establish international standards for sustainability in the future (Grossi and Argento, 2022).
- Risk management: This is the technique through which the enterprise acknowledges and manages the various dangers it faces. It is the responsibility of companies and organizations to offer records about sustainability possibilities and risks, in addition to their rules concerning them.
- Transparent Governance Structure: Create an easy governance form that describes the jobs, obligations, and decision-making procedures of executives, directors, and key control teams of workers. This shape seeks to grow openness, lessen conflicts of interest, and impose specific necessities.
- Diverse Board Composition: To better fit with MRG's goal of growth and innovation inside the culinary landscape, aim for a large board with a diverse variety of backgrounds, stories, and points of view. Independent administrators ought to carry governance knowledge and corporation-precise facts to the discussion.
- Risk Management Integration: Include risk manipulation methods in strategic decision-making techniques, which include habitual checks of risks related to enterprise operation management, assets, lawful obligations, and supply chain. The risk committee should be unbiased and effective in figuring out, comparing, and mitigating risks (Al-Attar, 2021).
- Ethical Conduct and Compliance: Incorporate extra details on conflicts of interest, moral conduct, and regulatory compliance. Make sure that the Code of Ethics and its tips are always observed, and provide clear and reliable techniques for handling court cases.
- Sustainability Integration: Consider sustainability in all factors of business, from waste management to shopping components. Improve reporting and disclosure of sustainable practices to meet organization necessities and stakeholder expectancies (Kastiel and Nili, 2021).
2.3 Producing Sustainability and Other Non-Financial Reports For The Business
2.3.1 Significance
For numerous reasons, Moka Restaurant Group (MRG) finds it necessary to produce sustainability and various non-financial criticisms. First of all, MRG places a strong emphasis on sustainability, nutrition, and community involvement in their enterprise and inventive and visionary comments (Puttri and Novianti). As a result, stakeholders expect responsibility and openness about the company's sustainability policies, along with traders, clients, and regulators.
MRG's operations, including sourcing additives and waste management, heavily rely on sustainable techniques. By generating non-economic perspectives, MRG can continuously improve and monitor its operations. By monitoring performance indicators like energy consumption, waste generation, and dealer compliance, MRG can identify areas for optimization and innovation. This approach promotes a sustainable lifestyle throughout the business, coordinating operational techniques with the company's overall goals.
2.3.2 Benefits
For Moka Restaurant Group (MRG), generating sustainability and specific non-economic checks can have good-sized advantages. First and foremost, it fosters more transparency, which increases thoughtfulness and confidence among those engaged. By using strength-inexperienced machinery, getting chemicals from sustainable businesses, and being transparent about their sustainability activities, MRG may show their commitment to moral business practices and draw in clients and shoppers who are socially conscious (Naciti et. al., 2022).
Furthermore, such viewpoints offer a level on which MRG may additionally spotlight its unique value proposition and set itself out in a crowded marketplace. In addition to strengthening logo loyalty among customers who cost sustainability, highlighting tasks like donating food to charities and taking part in recyclable packaging corporations is going beyond just pleasant social responsibility. Making non-financial assessments also promotes innovation and non-save-you improvements. Regulators' or purchasers' remarks can inspire MRG to improve its techniques, guaranteeing adherence to necessities while also enhancing operational efficiency and generating top-notch merchandise. Moreover, the exams function as a valuable inner device for general universal performance assessment and strategic making plans.
2.3.3 Challenges
Producing sustainability reports and non-monetary reporting for the eating place business presents a multitude of problems for MRG. These difficulties are coupled with the intrinsic qualities of the arena. This entails handling perishable goods, fierce competition, and moving customer preferences (Almashhadani and Almashhadani, 2021). Achieving a balance between sustainability and profitability is a chief task. This company specializes in procuring its materials from sustainable sources and seeks to decrease waste through initiatives like precise component control and identifiable packaging, among others, to strike a balance between its financial viability and its environmental responsibility.
The MRG governance rules' associated birthday celebration transaction policy and code of ethics call for a rigorous evaluation of their compatibility with sustainability goals. The different trouble is navigating the complexities of hazard control. This indicates that even though MRG hooked up a hazard committee to oversee various dangers, which include belongings-related and operational risks, ongoing oversight remains vital for different chance mitigation measures like group of workers termination, hypersensitivity disruption, patron accidents, and others. Strong chance management procedures are also required within the eating place quarter, as is evident from the temporary menu adjustments brought on via substances that had been unavailable across the supply chain.
3. Issues and Recommendations
Issues: Moka Restaurant Group (MRG) has challenges in its operations associated with perishable inventory, client preference volatility, and competitiveness that make it tough to use inexperienced control practices at the same time as also growing profitability. The greatness of the information presented and the way it pertains to statistics integrity in sustainability reporting, coping with associated annual transactions, and a robust emphasis on risk management are a few crucial factors (Almashhadani, 2021).
Recommendations: MRG can enhance its governance by absolutely outlining duties and responsibilities, stopping conflicts of interest, and improving transparency. It must additionally investigate boardroom diversity and implement effective change control procedures. Addressing moral issues and enhancing sustainability control can improve stakeholder self-belief and make contributions to the employer's long-term improvement (Castrillón, 2021). Ensuring moral requirements and addressing sustainability worries can also contribute to MRG's fulfilment.
4. Conclusion
MRG is enforcing company governance concepts like IFRS 1 and IFRS 2 to transform into a market chief. This approach aligns with business standards and could create a robust relationship between the commercial enterprise and stakeholders. Reducing the sustainability Tough circumstances will protect the business, ensure continuity, and maximize opportunities for future expansion. Developing a successful commercial business version and increasing sustainable value need a holistic approach to governance and sustainability.
4. References
.png)

- Assignment - Child Care
- Assignment - Mathematics
- Assignment - Accounting
- Assignment - Auditing
- Assignment - Biology
- Assignment - Law
- Assignment - Management
- Assignment - Nursing
- Assignment - Finance
- Assignment - Computer Science and IT
- Assignment - Humanities
- Assignment - Economics
- Assignment - Statistics
- Assignment - Architecture
- Assignment - Engineering
- Assignment - cookery
- Assignment - Marketing
- Case Study - Chemistry
- Case Study - Accounting
- Case Study - Law
- Case Study - Management
- Case Study - Nursing
- Case Study - Finance
- Case Study - Computer Science and IT
- Case Study - Engineering
- Case Study - Economics
- Case Study - Biology
- Case Study - Auditing
- Case Study - Marketing
- Case Study - Project Management
- Coursework - Diploma
- Coursework - Accounting
- Coursework - Auditing
- Coursework - Biology
- Coursework - Management
- Coursework - Nursing
- Coursework - Finance
- Coursework - Computer Science and IT
- Coursework - Engineering
- Coursework - Humanities
- Coursework - Child Care
- Coursework - Project Management
- Coursework - Economics
- Coursework - Cookery
- Coursework - Law
- Dissertation - Accounting
- Dissertation - Auditing
- Dissertation - Biology
- Dissertation - Law
- Dissertation - Management
- Dissertation - Nursing
- Dissertation - Finance
- Dissertation - Computer Science and IT
- Dissertation - Humanities
- Dissertation - Economics
- Essay - Politics
- Essay - Childcare
- Essay - Accounting
- Essay - Biology
- Essay - Law
- Essay - Management
- Essay - Nursing
- Essay - Computer Science and IT
- Essay - Humanities
- Essay - Economics
- Essay - Auditing
- Essay - Engineering
- Essay - Architecture
- Essay - Finance
- Essay - Science
- Essay - Marketing
- Programming - Computer Science and IT
- Reports - Management
- Reports - Computer Science and IT
- Reports - Project Management
- Reports - Marketing
- Reports - Nursing
- Reports - Engineering
- Reports - Accounting
- Reports - Humanities
- Reports - Finance
- Reports - Architecture
- Reports - Biology
- Reports - Economics
- Reports - Childcare
- Reports - Law
- Research - Accounting
- Research - Auditing
- Research - Biology
- Research - Law
- Research - Management
- Research - Nursing
- Research - Finance
- Research - Computer Science and IT
- Research - Science
- Research - Engineering
- Research - Humanities
- Research - Economics
- Research - Project Management
- Research - Statistics
- Research - Architecture
- Research - Marketing
- Thesis Writing - Computer Science and IT
- Thesis Writing - Engineering
- Thesis Writing - Biology
- Thesis Writing - Finance
- Thesis Writing - Humanities
- Thesis Writing - Auditing
- Thesis Writing - Economics
- Thesis Writing - Law
- Thesis Writing - Nursing
- Thesis Writing - Accounting
- Thesis Writing - Architecture


.png)
~5.png)
.png)
~1.png)


.png)


