Finance Coursework Assignment Sample
Important note: Coursework is marked on the understanding that it is the student’s own work on the module and that it has not, in whole or part, been presented elsewhere for assessment. Where material has been used from other sources, this must be properly acknowledged in accordance with the University’s Regulations regarding Academic Misconduct.
COMPANY ANALYSIS - (100% OF OVERALL COURSE GRADE)
A company of interest must be chosen, relevant company-level data collected from Orbis, an analysis made by using quantitative (with Microsoft Excel) and qualitative techniques, interpret the results and discuss these with reference to economic concepts and theories covered in the course, and in relation to recent business and financial economic events that have affected the company you have chosen. In-text references should be included throughout the coursework, and, at the end of your coursework, a bibliography section with full references must be presented. Both in-text and full references must follow the Harvard Referencing Style as per University referencing guidelines.
Company Analysis
The goal of this assessment is to look at the different specified financial aspects related to a UK firm you have chosen, and which should be listed on the London Stock Exchange (LSE). Most of the firms listed on the LSE operate both in the UK and abroad. Therefore, they are international in the way they operate their business. An understanding of the financial side of this firm is very important as stakeholders and potential investors constantly scrutinize listed firms in order to assess if management is running the business properly. To cover the main financial aspects of this firm you should address each part as indicated below by using articles, textbooks, databases and any other reliable source of information for assignment help.
Part 1 – (1,400 words). The goal of this part is to provide a summary of the company you have chosen. Resources you need for this task include: Textbooks, Orbis database, website Yahoo finance, company’s annual reports, and any other relevant resources you may find.
- Select a firm listed on the London Stock Exchange (you must use the Excel containing companies listed on the Board of the London Stock Exchange that I uploaded on Moodle, named ‘Companies on London Stock Exchange’ to find a firm you are interested in) and highlight any specific reasons for selecting this particular company.
- Look at the Annual reports of this firm and describe the company's activities;
- Find the revenues of this firm over the last 5 years (i.e. 2016-2020) and report these revenues in a table. Comment on whether revenues either increased or decreased.
Identify any relevant elements that could have had an impact on the firm’s revenue (i.e. either an external shock such as a financial crisis or an internal impact such as the mismanagement of the company).
- What sector does the company you have chosen belong to? Identify the sector and by using the database Orbis address the following points:
Who are the main competitors of the company you have chosen?
By looking at the revenues of your company as well as the revenues of its main competitors during the year 2020, identify the market share of your company as well as the market share of each of your company’s main competitors. Either tabulate the market share of each or put it a pie chart form. Comment on the market share of your company as well as the market shares of its main competitors.
- By using either the Orbis database or the internet website Yahoo finance compile a table where you report on the year-end stock price of your company from 2016 to 2020. Did management maximize the price of this common stock throughout this period? If this has not happened, try to find out the reasons for this (i.e. look atpossible external or internal factors).
- Has your chosen company made any long-term investment decisions over the last five years? (tips: look at the annual reports produced by your chosen company during years 2016, 2017, 2018, 2019, and 2020).
- Did your company generate revenue from foreign markets over the last five years? (Tips: look at the annual reports of the year, 2016, 2017, 2018, 2019, and 2020, and try to find the breakdown of revenue in terms of domestic and foreign markets) Report your finding in a table and comment the trend of foreign revenues over the last five years.
- By using the Orbis database or other relevant sources of information, look at the composition of the Board of Directors in your firm of interest. Is there an equal distribution of gender of people on the Board? Is there any scientific evidence that gender has an effect on decisions made by Boards of Directors of public-listed companies? Address this last question by using 3-5 relevant academic articles.
Part 2 –The objective of this part is to identify how well your company did financially over the last five years (i.e., 2016, 2017, 2018, 2019, and 2020). Resources you need for this task include: Textbooks, Orbis database, Yahoo finance website, the company’s annual reports and any other resources you may find. In particular you should address the following points:
- Look at the Balance sheet of your firm and report in separate tables the following information:
Current and Fixed assets over the last five years (i.e. 2016, 2017, 2018, 2019, and 2020) and write a short comment related to their trend. Look at the annual report of your company for the last year of your analysis looking for keywords such as ‘current assets’ and ‘fixed assets’. What do you learn about the company from its annual report in relation to the two afore mentioned aspects (i.e. current assets and fixed assets)?
Non-current liabilities and current liabilities over the last five years (i.e. 2016, 2017, 2018, 2019, and 2020) and write a short comment related to their trends. Look at the annual report of your company for the last year of your analysis looking for keywords such as ‘non-current liabilities’ and ‘current liabilities’. What do you learn about the company from its annual report in relation to the two afore mentioned terms?
Working capital over the last five years (i.e. 2016, 2017, 2018, 2019, and 2020) and write a short comment related to their trends. Look at the annual report of your company for the last year of your analysis looking for keywords such as ‘working capital’. What do you learn about the company from its annual report in relation to this item?
Calculate the debt-to-asset ratio of your company over the last five years (i.e. 2016, 2017, 2018, 2019, and 2020) and comment on the extent to which your company’s total assets have been financed with debt and write a short comment related to its trend. Look at the annual report of your company for the last year of your analysis looking for keywords such as ‘debt-ratio’. What do you learn about the company from its annual report in relation to this term?
Calculate the working capital turnover ratio of your company over the last five years (i.e. 2016, 2017, 2018, 2019, and 2020) and comment on the extent to which your company has efficiently used its working capital to generate revenues and write a short comment related to its trend. Look at the annual report of your company for the last year of your analysis looking for keywords such as ‘working capital turnover ratio’. What do you learn about the company from its annual report in relation to this term?
Calculate the return on equity (i.e. ROE) of your company over the last five years (i.e. 2016, 2017, 2018, 2019, and 2020) and comment on the extent to which your company has been profitable in using its owners capital and write a short comment related to its trend. Look at the annual report of your company for the last year of your analysis looking for keywords such as ‘ROE’. What do you learn about the company from its annual report in relation to this term?
- Look at the profit and loss account of your firm and report the following information in separate tables:
Operating revenue, costs of goods sold and gross profits over the last five years (i.e. 2016, 2017, 2018, 2019 and 2020) and write a short comment related to the trend for each of those aspects. Look at the annual report of your company for the last year of your analysis looking for keyword such as ‘Operating revenue’, ‘costs of goods sold’, and ‘gross profits’. What do you learn about the company from its annual report in relation to these terms?
Net Profit over the last five years (i.e. 2016, 2017, 2018, 2019 and 2020) and write a short comment related to the trend of this item. Look at the annual report of your company for the last year of your analysis looking for keywords such as ‘Net Profit’. What do you learn about the company from its annual report in relation to this term?
Calculate the Net Profit Margin ratio of your company over the last five years (i.e. 2016, 2017, 2018, 2019, and 2020) and comment on the extent to which your company’s revenues have generated profits and write a short comment related to this trend. Look at the annual report of your company for the last year of your analysis looking for keywords such as ‘Net Profit Margin’. What do you learn about the company from its annual report in relation to this term?
Part 3 – (200 words)
- Describe how you went about selecting a specific company, collecting and analyzing relevant data. Giving your own personal assessment as to how effectively you went about completing this task. Please note that in evaluating the coursework, attention will be placed on your ability to incorporate finance and business concepts and theories covered in class in the various parts of the assessment. The use of appropriate financial and business terminology, the ability to clearly and concisely explain these aspects and the use of referencing (according to Harvard referencing style) will also form part of the evaluation, as well as your ability to stay within the topic parameters and exhaustively answer the question within the set word limits. Note that tables, figures, and references are not included in the word count. In preparing your assignment, you must follow the order of tasks as listed in Part 1, Part 2, and Part 3. Do not include in any Part, answers that are related to other parts as this will make your assignment less readworthy and create confusion. You must include a Word Count at the end of your coursework (Tables, Graphs/Figures, and Bibliography section does not count towards the overall word count). Make sure each Table / Graph you provide in your coursework has a progressive number and a title. Finally, you must write your coursework using Microsoft Word editor, whereas for Graphs you are advised to use Microsoft Excel. You cannot provide handwritten answers that are scanned, these will not be accepted. Please do not copy and paste images / graphs from annual reports.
Important note: Coursework is marked on the understanding that it is the student’s own work on the module and that it has not, in whole or part, been presented elsewhere for assessment. Where material has been used from other sources, this must be properly acknowledged in accordance with the University’s Regulations regarding Academic Misconduct.
Solution
Introduction
Financial assessment is one of the significant concepts in the current environment that directly linked with the performance evaluation of the firm. With the help of the financial; assessment, current stability and working capital management of an organization can be identify more effectively. Purpose of this assignment is to measure the financial performance of a LSE listed UK based company for over 5 years in order to determine the financial performance trends. This report has divided in three parts where in first part a summary of the selected company has been described. In the second part, financial performance trends for five years have been recognized and third part discuss about selection process of company data.
Part 1: Summarization of the selected organization
Organizational background
Barclays Plc has been taken under consideration in this report as the sleeted organization to analyses the financial performance of the company over last five years. Current stability of the business and operational efficiency of the firm can be evaluated through the financial assessment of Barclays Plc more significantly. Barclays Plc has been selected in this report because it is a LSE listed company and comes under the FTSE 100 components (Home.barclays, 2021). Additionally, the company operates internationally which provide an upper hand to select this organization to measure the financial trends. During the Covid19, financial effect can be seen in the operational process of the financial institution. Because Barclays a financial institution, it is effective to determine the current financial trends of the business more effectively. Due to this reason, Barclays Plc has been selected for the financial analyses in this report.
Barclays Plc is a UK based multinational bank that operates as two divisions such as Barclays International and Barclays UK. It is one of the oldest banks in the UK which was established in 1690 and headquarter situated in London, UK. Service range of the business are including retail banking, commercial banking, investment banking, wealth management, financial service, private banking and wholesale banking (Home.barclays, 2021). As per the annual report of 2021, current numbers of employee in the organizational operation is 83500. It is a public limited company that operates in financial service and banking industries.
Organizational activity
Barclays Plc currently linked with different business units and activity which directly impact on the performance parameter of the business. According to the report of the 2011, Barclays was the most powerful transactional corporation from the perspective of the ownership that directly impact on the financial stability of the business. Barclays has different business division which actively worked in international financial market and banking sector. Barclays UK, Barclays Corporate bank, Barclay’s payment, Barclays Private bank, Barclays US consumer Bank and Barclays Investment bank are the major division that operates by the group of the company (Home.barclays, 2020). The company has seven activity units in the operational process that assist in the growth of the business operation. As per the annual report 2020, Barclays established with one business unit as corporate bank in 1690. Hence, in the current environment, the company used to increase its numbers of activity unit and enhanced the profitability. Current activity units of Barclays are including Retail Banking Activity, Corporate banking Activity, Insurance banking Activity, Investment banking Activity, Wealth management, Wholesale banking Activity and Financial Service activity. The company used to generate highest percentage of revenue from the Investment banking Activity where Wholesale banking activity unit provides lower revenue consultation in the organizational operation.
Revenue trends over five years
Performance of the highly depends on the revenue generating capability of the business in the current environment. Considering the financial assessment it can be identified that Total income of the business has increased over the year for Barclays Plc. In the following section, a table has been made in order to show the trends of the revenue for Barclays Plc over last five years.
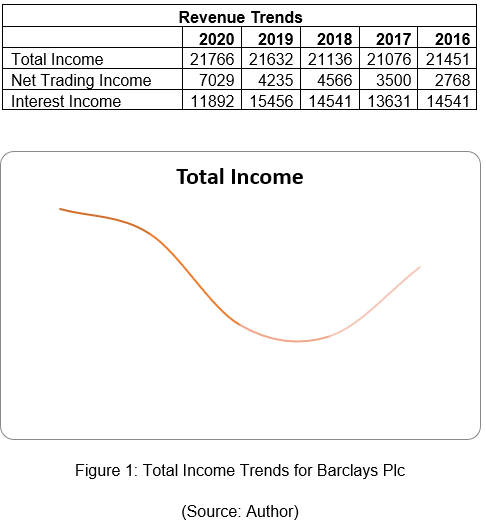
Considering the financial trends of the business revenue, it is identified that the revenue of Barclays has increased in last four years due to increase in trading income (Home.barclays, 2017). Higher growth in the financial market over last five years has positively impact on the trading income of Barclays Plc which has directly effect on the profitability of the business. However, reduction in the interest rate in the UK market has negatively impact on the total income of the business which reduces the growth of the revenue for Barclays.
Sector and competitive analyses
Barclays Plc belongs to Banking and financial service sector in the current environment. The company provides banking and financial services to the consumer of the UK and international market. The company used to provides investment opportunity to entrepreneurs and assist them to develop their business more effectively. In the financial performance analyses, competitive environment analyses are important that allow recognizing the current performance trends of the firm more effectively. Key competitors of Barclays Plc are including HSBC bank, National Westminster bank and Deutsche bank.
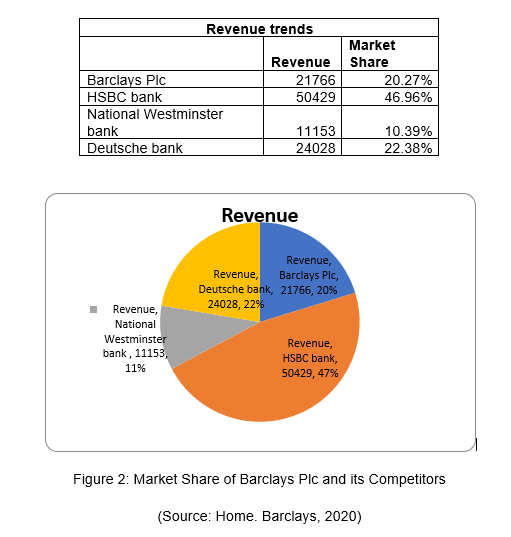
Considering the revenue generation in 2020, it can be identified that Barclays Plc posses 20% of the market share from the perspective of the revenue. On the other hand, following the revenue, it is identified that HSBC Bank possesses highest numbers of market share in the current environment from the perspective of revenue with 47% of market share (Orbis, 2021). Other competitors of Barclays Plc are including Deutsche Bank have 22% of market share and National Westminster bank have 11% of market share in the current environment (Home.barclays, 2020). This data indicates that market base is higher for the HSBC bank in the current banking industry where it is lower for National Westminster bank in banking sector. Based on the data, it can also stated that Barclays Plc current holds a good position in the banking industry from the perspective of revenue to enhanced its profitability and grow in future.
Stock price management
Historical data for Barclays Plc has been used in this section in order to determine the year end stock price for the business over last five years. Growth of the share price can be evaluate through the identification of the historical share price for the Barclay Plc. Following table has been used to show the closing price of share for each year over last five years for Barclay Plc.
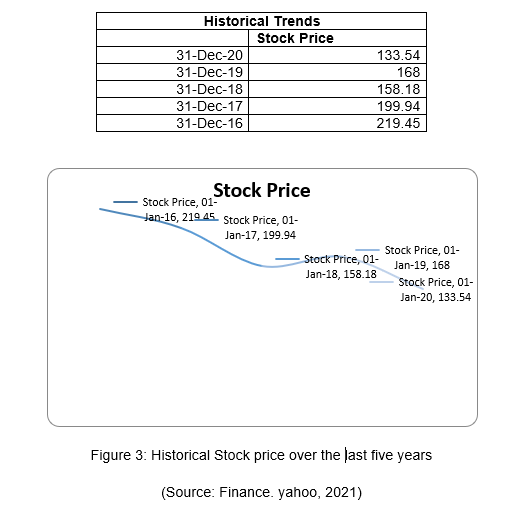
Considering the data it can be identified that there has reducing trends in the historical stock price for Barclay Plc in the current environment. It is identified that the stock price of the share was 219.45 in December 2016 and reduced to 133.54 in December 2020. Here, continues reduction in the share price can be identified for Barclays Plc in the current environment (Finance.yahoo, 2021). Changes in the interest rates and management strategy towards the activity reduction can be the reason behind this decrease. Covid19 has massively impact on the economic stability of the country and reduce the GDP rate of the UK. Due to government fiscal policy and unstable economic situation, share price has reduced dramatically in 2020 compared to 2019.
The company has taken the long term investment decision in 2020 for the sustainable development strategy. As the long term investment decision, the company used to make a vision for net zero bank within 2050 and align with the franchise activity to meet the goal of Paris Climate Agreement (Home.barclays, 2020). The company also strategy to tacking the climate changes through the acceleration of the changes in low carbon economy.
Barclays used to operate in the foreign market which makes it Multination Corporation. The company has generated large volume of revenue from the foreign market. Considering the annual report of the business, it is identified that the company generate 31.71% of the total revenue from the domestic market in 2020 (Home.barclays, 2020). This data indicates that the company generates large volume of revenue from foreign market.
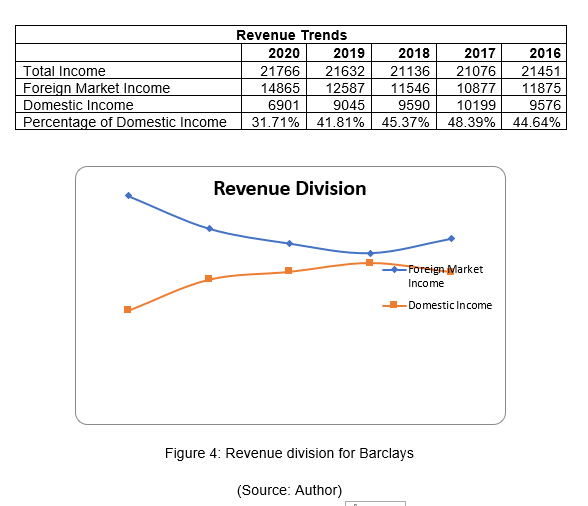
Considering the trends analyses, it is identified that there has an increasing trends for foreign revenue. The company able to increased its foreign revenue in the business operation over last five years.
Composition of Board of director
Considering Board Composition of the annual report of Barclays Plc, it is identified that numbers of non-executive director is 9, Chairman is 1 and Executive director is 2. Following the gender balance it is seen that Numbers of male director is 9 and Female director is 3. Here, 3:1 ratio can be seen in the gender distribution on the board of director for Barclays Plc in 2020 (Home.barclays, 2020). According to Abad et al. (2017), gender has no impact on the decision making process in board of director of public listed company that the decision making skills are same for both gender. Argue with the above statement, Martinez-Jimenez et al. (2020) stated that Leadership capability and critical thinking perspective is higher among the male director than female director which allow to get effective judgment in the decision making process. In accordance with the above statement, Nielsen and Huse (2010) told that board decision making depends on the professional experience rather than gender diversity.
Part 2: Financial performance for the company over last five years
Current assets and fixed assets
Current assets and fixed assets are the two different elements of total assets for an organization. Current assets consider as the short term assets that the company planned to sold within 1 years of period (Rafay et al. 2019). Fixed assets are considered as the long term assets that the company purchased for the production and service operation.
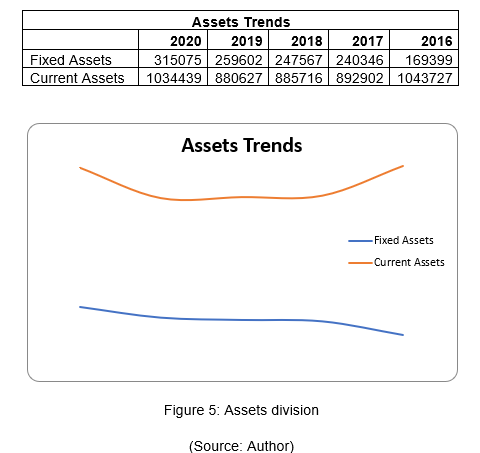
Based on the assets trends it can be identified that total assets of Barclays Plc have increased in 2020 compared to 2019 due to additional investment. Trend analyses shows that current assets of the company have increased effectively in 2020 compared to 2019 and 2018. On the other hand, fixed assets of the company have increased in 2020 compared to 2019 and 2018 for Barclays Plc. As it is a banking corporation, current assets are higher than the fixed assets of the business. This data indicates towards the large volume of regular transaction for the firm.
Total liability of an organization can be identified through the identification of the non-current liability value and current liability value (Laurens and Tampang, 2018). Current liability defines as the debt of the business that the company must pay within one year time period. On the other hand, non-current liability define as the long term liability that the company taken for the benefit of the business.
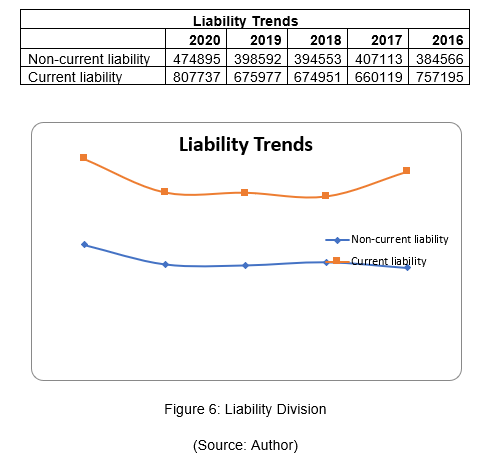
Based on the financial trends analyses it is identified that current liability of Barclays Plc has increased in 2020 compared to 2019 and 2018. On the other hand, Non-current liability of the business has increased over last five years for the business. Trend analyses showed that non-current liability of the company has increased due to increase in customers’ accounts in the business operation.
Working capital trends
Working capital management is necessary for the business in order to improve the overall operational efficiency of the firm more effectively (Boisjoly et al. 2020). Working capital management directly indicates towards the financial stability of the business in the current environment. In order to detect the working capital of an organization, it is necessary to deduct the current liability from the current assets of the business. Working capital trends for Barclays Plc has been identified in the following section of the report.
Working capital = Current Assets – Current liability
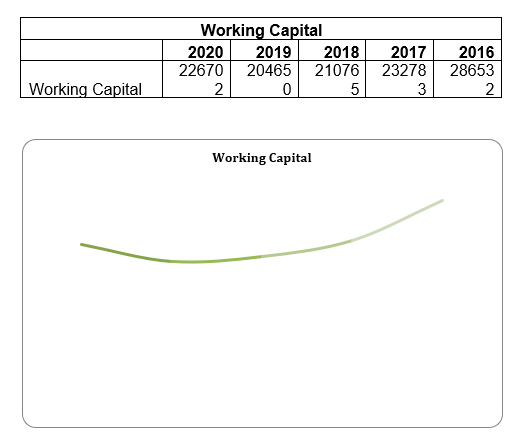
Figure 7: Working Capital Trends for Barclays Plc
(Source: Author)
Based on the above trend analyses, it is identified that working capital of the company has reduced in 2020 compared to 2016. Reducing trends can be seen in the working capital management of the business which indicates that current liability of the business has increased compared to current assets of the business over last five years. This data also indicates that the company reduced its cash conversion cycle over last five years in the business operation.
Calculation of debt to assets ratio
Debt to assets ratio is the financial assessment that assists to determine the financial risk in the business operation. Debt to assets ratio can be used to measure the use of the company’s assets that are financed by the debt rather than the equity of the business (McLaney and Atrill, 2016). In order to calculate the debt to assets ratio, it is necessary to divide the total assets from the long term debt of the business.
Debt to assets ratio = Long term debt / Total Assets
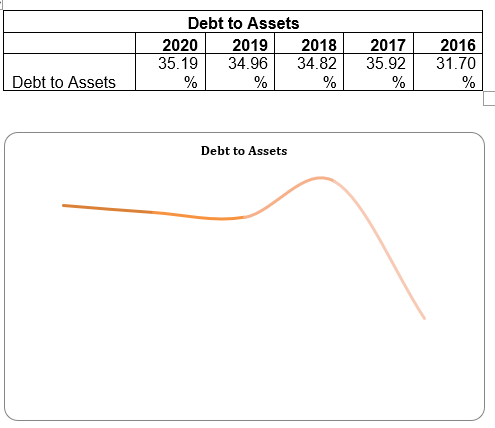
Figure 8: Debt to Assets ratio
(Source: Author)
Based on the above calculation it is identified that debt to assets ratio has increased for Barclays over last 5 years. This data indicates towards the increasing trends in the current environment. Increase in debt to assets ratio indicates that the company able to increase the investment in the assets through utilizing the debt in the current environment. Higher financial risk can be seen in this operation for the Barclays Plc.
Working capital turnover ratio
Working capital turnover ratio defines as the financial performance measurement that identifies the capability of the company to utilize its working capital for sales growth (Kalaivani and Jothi, 2017). Working capital management for the development of sales revenue can be identifying through the measure of the working capital turnover ratio for Barclays Plc.
Working capital turnover ratio = sales / Working capital
As the Barclays Plc is the service based organization, total income of the business operation consider as the sales revenue for the business over five years.
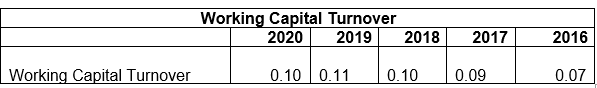
Based on the above table it is seen that working capital turnover for Barclays has increased in 2020 compared to 2016. This data indicates that the company has good working capital management to support the growth of the revenue over last five years.
Return on Equity
Return on equity (ROE) is the financial performance measurement that assists to determine the profitability of the firm in relation with the equity of the business (Amelia and Sunarsi, 2020). ROE has been used by the investors to determine the financial health of the business from the investment perspective.
Return on equity = Net Income / Shareholders Equity
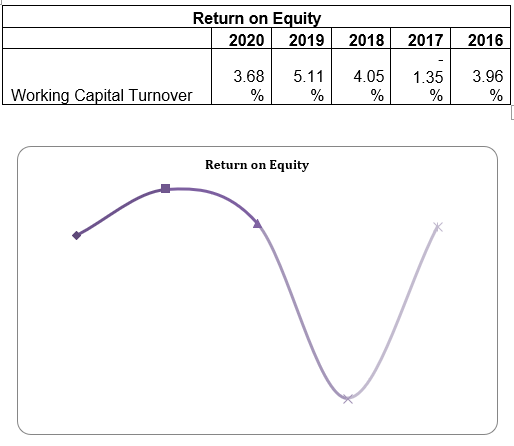
Figure 9: Return on Equity
(Source: Author)
Following the trend analyses of ROE it can be identified that ROE of the company has improved in 2020 compared to 2016. Due to Covid19, ROE of the company has reduced in 2020 compared to 2019 which indicates towards the ineffective investor’s interest towards the business.
Operating revenue and Gross profit
Operating revenue define as the revenue that an organization generate from the primary activity of the firm (Jati, 2021). Cost of goods sold is the measurement of cost of the product or services that the business sold. Gross profit is the valuation of primary profit from the business operation after deducting cost of goods sold from revenue of the business.
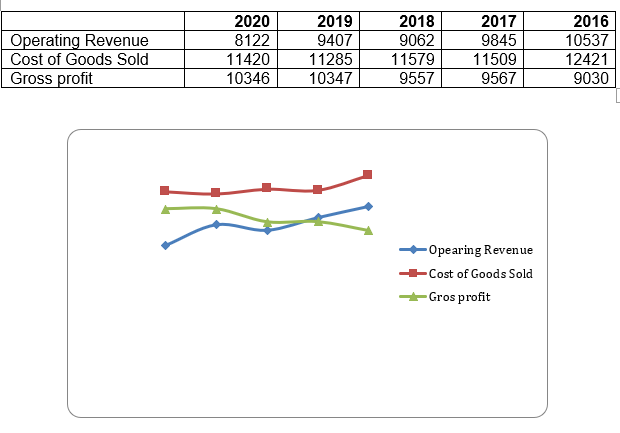
Figure 10: Trends in Gross profit
(Source: Author)
Based on the income statement of Barclays Plc it is seen that that has reducing trends for operating income and COGS. Hence, the increasing trends are there for Gross profit of the business which indicates that the company able to improve its primary profitability more effectively.
Net profit trends
Net profits define as the financial measurement that used to identify the net income of the business operation.
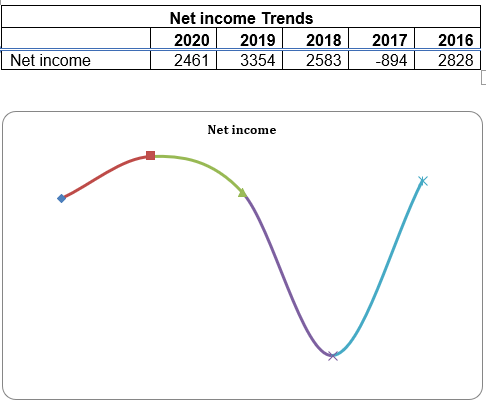
Figure 11: Net income Trends
(Source: Author)
Above graph indicates that positive trends can be seen in the net profitability of the business. In 2017, the company had faced a los due to lack of strategic development (Orbis, 2021).
Net profit margin ratio
Net profit margin ratio is the profitability ratio used to identify the percentage of profitability on the total sales of the business.
Net profit margin = Net profit / Total sales
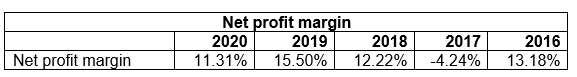
A reducing trend is there in the net profit margin of Barclays Plc in 2020. It is estimated that Covid19 has negatively impact on the net profit margin of the company in 2020.
Part 3: Selection and collection of company data
In order to complete the task, I have selected the organization from the website which listed the entire LSE listed corporation. Barclays Plc has been selected due to its financial growth and market value in the current environment. In order to collect the financial information of Barclays Plc, Yahoo Finance and annual report of the company used for last five years. I have collected data regarding Barclays Plc from the annual report of the company for last five years. Total value of assets, liability, and equity and income statement has been used to collect the relevant data regarding the company. Orbis websites has also used for the competitive analyses of the company. In order to collect information related to literature, relevant journal articles and text books has been used in this report more appropriately. Financial trend analyses for Barclays Plc have been replicated through using ratio analyses methods in this report more significantly. In order to analyzed the data, excel sheet has been used that assist to present the trends in graphical way.
Reference
Abad, D., Lucas-Pérez, M.E., Minguez-Vera, A. and Yagüe, J., 2017. Does gender diversity on corporate boards reduce information asymmetry in equity markets?. BRQ Business Research Quarterly, 20(3), pp.192-205. https://journals.sagepub.com/doi/pdf/10.1016/j.brq.2017.04.001
Amelia, R.W. and Sunarsi, D., 2020. Pengaruh Return On Asset Dan Return On Equity Terhadap Debt To Equity Ratio Pada PT. Kalbe Farma, TBK. Ad-Deenar: Jurnal Ekonomi dan Bisnis Islam, 4(01), pp.105-114. https://jurnal.staialhidayahbogor.ac.id/index.php/ad/article/download/738/523
Boisjoly, R.P., Conine Jr, T.E. and McDonald IV, M.B., 2020. Working capital management: Financial and valuation impacts. Journal of Business Research, 108, pp.1-8. https://e-tarjome.com/storage/panel/fileuploads/2019-12-09/1575883858_gh42.pdf
Finance.yahoo, 2021. Barclays PLC (BARC.L). [online] Finance.yahoo.com. Available at: https://finance.yahoo.com/quote/BARC.L/history?p=BARC.L [Accessed 29 December 2021].
Home.barclays, 2017. Annual Report 2017. [online] Home.barclays. Available at: https://home.barclays/content/dam/home-barclays/documents/investor-relations/reports-and-events/annual-reports/2017/Barclays-PLC-Annual-Report-2017.pdf [Accessed 29 December 2021].
Home.barclays, 2020. Annual Report 2020. [online] Home.barclays. Available at: https://home.barclays/content/dam/home-barclays/documents/investor-relations/reports-and-events/annual-reports/2020/Barclays-PLC-Annual-Report-2020.pdf [Accessed 29 December 2021].
Home.barclays, 2021. Barclays Our Story and History | Barclays. [online] Home.barclays. Available at: https://home.barclays/who-we-are/our-history/ [Accessed 29 December 2021].
Jati, W., 2021. Influence of Operational Costs on Operating Revenue and Loan to Deposit Ratio against Return on Asset at PT. Bank Negara Indonesia, Tbk Year 2009-2019. Kontigensi: Jurnal Ilmiah Manajemen, 9(1), pp.1-9. https://jurnal.dim-unpas.web.id/index.php/JIMK/article/download/88/131
Kalaivani, P. and Jothi, K., 2017. Impact of working capital management on profitability of the select car manufacturing companies in India. International Journal of Pure and Applied Mathematics, 116(24), pp.13-21. http://www.acadpubl.eu/jsi/2017-116-23-24/articles/24/2.pdf
Laurens, R. and Tampang, Y., 2018. Long-Term Liabilities. Available at SSRN 3210082. https://papers.ssrn.com/sol3/papers.cfm?abstract_id=3210082
Martinez-Jimenez, R., Hernández-Ortiz, M.J. and Fernández, A.I.C., 2020. Gender diversity influence on board effectiveness and business performance. Corporate Governance: The international journal of business in society. https://www.semanticscholar.org/paper/Gender-diversity-influence-on-board-effectiveness-Mart%C3%ADnez-Jim%C3%A9nez-Hern%C3%A1ndez-Ortiz/4d7412b4b67684d98f6d6f52158787d9c47792f9
McLaney, E. and Atrill, P., 2016. Accounting and finance: an introduction. Prentice Hill. http://103.227.140.9/handle/123456789/15358
Nielsen, S. and Huse, M., 2010. Women directors' contribution to board decision?making and strategic involvement: The role of equality perception. European Management Review, 7(1), pp.16-29. https://womanforward.org/wp-content/uploads/2020/06/Women-directors-contribution-to-board.pdf
Orbis, 2021. Orbis | Compare Private Company Data | Bureau van Dijk. [online] bvd. Available at: https://www.bvdinfo.com/en-gb/our-products/data/international/orbis [Accessed 30 December 2021].
Rafay, A., Yasser, F. and Khalid, Z., 2019. Revaluation of non-current assets under IAS-16: possibility of any managerial inducement: evidence from a South Asian economy. Rafay, A., Yasser, F., & Khalid, (2019), pp.93-105. https://www.researchgate.net/profile/Abdul-Rafay-3/publication/348680681_Revaluation_of_Non-Current_Assets_under_IAS-16_Possibility_of_any_Managerial_inducement_-_Evidence_from_a_South_Asian_Economy/links/6034bba3a6fdcc37a846881f/Revaluation-of-Non-Current-Assets-under-IAS-16-Possibility-of-any-Managerial-inducement-Evidence-from-a-South-Asian-Economy.pdf

- MBA632 Knowledge Management
- MG401 Leadership in Agribusiness Part c Report 2
- Working and Learning in Cross Cultural Communities Assignment
- BUS2003 Sustainability and Ethics Assignment
- MIS611 Information System Capstone Assignment
- MBA5003 Operations Plan Report 2
- IND301A Industry Consulting Project Assignment
- HCCSSD205 Social Justice Research Report 3
- Leadership and Effecting Change in Public Health Assignment
- PUBH7033 Foundations of Public Health Assignment
- Cultural Differences Role in Marketing Strategies for MNCs
- COMP1702 Big Data Assignment
- LML6001 Practitioner Legal Skills for Australian Migration Law Case Study
- LST2001 Introduction to Business and Company Law Assignment
- PRJ6001 Applied Project Assignment
- MSc Computer Science Project Proposal
- PUBH6000 Social Determinants of Health Case Study
- Research and Statistical Methods for Business
- PROJ 6012 Information Technology Report
- DATA4900 Innovation and Creativity in Business Analytics Report 4


.png)
~5.png)
.png)
~1.png)


.png)


