Reports
BUA4003 Principles of Economics Report 2 Sample
Assessment Brief
This assignment consists of two separate tasks that must be submitted at the same time. Your response to each task should be no more than 500-600 words plus diagrams. Use headings for Task 1 and Task 2. Your responses can draw on real world examples and sources and must include appropriate diagrams.
Task 1: The Impact of Elasticity on Strategic Choices for Electric Vehicle Producers
You are an industry analyst investigating the global EV market. In your research, you came across the following:
“In 2023, Tesla implemented multiple price adjustments across its model range”
“China's growing middle class and rising incomes have led to a surge in EV sales”
“The recent fluctuations in global oil prices have significantly impacted the adoption rates of EVs”
As an industry analyst, you have been tasked with providing a comprehensive report to help electric vehicle producers understand the importance of elasticity in their strategic decision-making. Prepare a short report (400-500 words plus diagrams) that addresses the following:
1. Price Elasticity of Demand:
- Explain the concept of price elasticity of demand (PED) and its significance for an electric vehicle producer. Illustrate how sensitive the demand for electric vehicles can be to price changes. [Hint: how would Tesla implementing multiple price adjustments across its model range affect the PED?]
2. Income Elasticity of Demand:
- Explain income elasticity of demand (YED) and how changes in consumer income levels can affect the demand for electric vehicles. Illustrate how rising incomes influence demand.
3. Cross-Price Elasticity of Demand:
- Explain the cross-price elasticity of demand (XED) in the context of electric vehicles and their substitutes and complements. Illustrate how prices of related goods can affect the demand for electric vehicles.
Task 2: The implementation of tax policy on petrol cars
Consider yourself as an economist working for the Australian Federal government. In your role, you evaluate issues relating to economic policy proposals. Your task here is to evaluate a proposal for Australia to reduce its air pollution by reducing its use of petrol cars and thus implementing a tax on for each litre of petrol sold. The aim of this policy is to reduce uptake of petrol-powered vehicles. You should focus on the importance of elasticity on the achievement of the objectives of the tax and discuss any potential unintended impacts of the tax (400-500 words plus diagrams).
Intended Learning Outcomes:
1. Apply economic frameworks for policy and business decision-making.
2. Research and apply economic concepts to predict how changes in economic conditions may impact individuals, businesses and industries within market structures.
3. Critically analyse economic data to explain relationships between economic variables and their impacts on policy, business and individuals.
4. Construct and present logical and persuasive economic arguments and communicate concepts professionally.
Referencing
- It is expected that you will reference a range of resources (e.g. the textbook, news media, journal articles, industry reports, the ABS and other sources).
- Attributing authorship correctly helps us all be better scholars. The referencing style for this subject is APA7.
- The Academic Referencing Tool provides detailed referencing examples for the prescribed La Trobe University referencing styles. Select the link if you would like to learn more.
Solution
Task 1: The Impact of Elasticity on Strategic Choices for Electric Vehicle Producers
Introduction
Elasticity therefore defines how sensitive the value of market parameters is to forces of value of economy. Essentially, elasticity is important for any strategic planning among EV producers. This report explores three key types of elasticity. This section focuses on the analysis of the Price Elasticity of Demand (PED), Income Elasticity of Demand (YED), and Cross-Price Elasticity of Demand (XED) to understand the market dynamics of the electric vehicle (EV) market.
1. Price Elasticity of Demand
.png)
Figure 1: Price Elasticity of Demand
(Source; Self-made)
Definition and Significance: The Price Elasticity of Demand (PED) is the coefficient to changes in price and is calculated as the ratio of the percentage change in quantity demanded to percentage change in price (Lecocq & Muehlegger, 2019). In the case of EV producers, PED is used to understand how changes in price impact sales volume, revenue, and the direction taken in the market.
Application to Tesla's Price Adjustments: One of the best examples of PED is the regular price changes that Tesla has employed in respect to its physical products. For example, a decrease in price of 10% for Model 3 and a subsequent change of sales of 15% leads to the determination of a PED of -1.5, indicating elastic demand. On the diagram, it is reflected in the decrease of the elasticity of demand, indicated by a flatter curve for the assignment helpline.
Sensitivity Analysis: Elastic demand means small changes in price can cause big changes in the quantity demanded and thereby affect market share. Knowledge about PED assists Tesla to adjust the prices in the right way to maximize its profits while at the same time maintaining competitiveness in the market.
2. Income Elasticity of Demand
.png)
(Source; Self-made)
Definition and Significance: Income elasticity of demand (YED), on the other hand, tends to point out a change in quantity demanded of a particular good when income moves around (Springel, 2021). The necessity of it is to divide the percentage change in quantity demanded by the corresponding change in income. Thus, for EV producers, YED is an effective tool that reveals how shifts in income affect demand for their products and determines the further course of action.
Impact of Rising Incomes: The improvement in income levels especially in China have greatly enhanced the demand for EV. For instance, the average income increases by 10% although to 20% the consumption of EV rises the corresponding is +2.0. This is depicted by a shift of the EV demand curve rightwards.
2. Cross-Price Elasticity of Demand
.png)
(Source; Self-made)
Definition and Significance: Cross-Price Elasticity of Demand (XED) defined as the influence of the relative price of one good on the quantity demanded of another good (Kalthaus & Sun, 2021). It is expressed as the percentage change in quantity demanded of Good A divided by the percentage change in the price of Good B.XED can be used by EV producers to determine on how shifts in the price of related goods like petrol influences the demand of EVs or electric cars.
Effect of Oil Price Fluctuations: Rising oil prices often increase EV demand. For example, a 10% increase in oil prices leading to a 5% rise in EV demand results in an XED of -0.5, indicating that petrol and EVs are substitutes. Diagrammatically, this is shown as a rightward shift in the EV demand curve.
Conclusion
It is, therefore, important for EV producers to understand elasticity such as PED, YED, and XED to enable better strategic decisions. PED demonstrates how to improve the right pricing schemes, YED identifies how shifts in incomes affect demand, XED describes how related products’ prices affect EV sales.
Task 2: The Implementation of Tax Policy on Petrol Cars
Introduction
Levying on petrol has the ambition of mitigating the emission of gases into the atmosphere since the utilization of vehicles that use petrol is unpopular. The policy targets are to reduce the usage of petrol and the resultant emissions (Wangsness & Halse, 2021). Another important concept that should be used to evaluate the policy is elasticity, which captures the impact of price changes on petrol consumption and consumers’ responses.
1. Importance of Elasticity for Policy Objectives
Price Elasticity of Demand (PED): Price Elasticity of Demand (PED) is the degree of responsiveness of quantity demanded of petrol to a change in price of petrol. If the demand for petrol is elastic (PED > 1), an increase in price because of a tax will result in a proportionate reduction in quantity demanded. For example, if a tax increases petrol prices by 20% and the PED is -1.5, the quantity demanded could decrease up to 30%. This significant saving in petrol use is beneficial in the fight against pollution and is useful in achieving environmental goals.
Illustration: An upward shift in the demand curve in an elastic demand scenario indicates that a petrol tax will reduce the quantity demanded in the market. On the same diagram, an increase in price leads to a shift of the initial demand curve (D1) to a steeper curve (D2) that reduced quantity demanded from Q1 to Q2 of petrol. This shift to the left demonstrates that an increase in the price of gasoline reduces its use and consequently minimizes emissions (Bitencourt et al., 2021). In terms of the policy objectives outlined in the diagram, the tax successfully reduces the use of petrol and, as a result, minimizes air pollution, a key environmental and public health concern.
2. Potential Unintended Impacts
Consumer Behavior Changes: One disadvantageous impact of adopting the petrol tax might be the saturated shifting of consumers towards other fuels or higher fuel economy vehicles. With the upsurge in petrol prices, consumers are inclined to buy either EVs or hybrids, trends that may partially neutralize the effect of reduction in petrol consumption. This shift may also help increase the demand for these alternative technologies and may do more than just reduce the usage of petrol.
Economic Impact: The tourists may be affected by the petrol tax since the less fortunate or those who consume significantly higher quantities of petrol are the worst hit as compared to the upper classes. This additional cost could further widen the inequality gap and decrease the funds available for these households (Valogianni et al., 2020). This might lead to low sales of petrol vehicles within the automotive industry thus affecting the manufacturers as well as the dealers in the sale of those models. Although the function is to decrease the use of petrol or is associated with emission reduction the tax would increase government revenue. Having this extra revenue, one can use it for environmental issues, infrastructure developments or to pay other taxes which might counterbalance some of the effects. However, whether these measures will help in eradicating the tax’s adverse effects will depend on the responses and amendments that the government will make on the policy level.
Conclusion
Elasticity crucially affects the petrol tax policy's success in reducing consumption and pollution. While PED helps predict the tax's impact on petrol demand, policymakers must consider unintended consequences, such as shifts to alternative fuels and economic strain on low-income households. If these facets are addressed, the policy stands to benefit by having increased optimality and fairness added to it.
Reference List
.png)
Reports
EC501 International Economic Development Report 2 Sample
Assignment Details
Students will complete an issue report which addresses one major issue that impacts upon international economic development. Each student will choose an issue from weeks (topics) 3, 4, 5 or 6 and will address theory, empirical evidence and recommendations for government and business responses.
Purpose
The purpose of this assessment item is for each student to develop and demonstrate a deeper knowledge and understanding of an issue in international economic development than is possible during the class session on the issue. Each student will become the class expert on their chosen issue.
The Task
Students should chose an issue from topics 3, 4, 5 or 6 that interests them. There is considerable scope provided in these topics and a number relate directly to agribusiness. Students should choose their issue as early as possible and read widely. Special attention should be paid to all the material used or referred to in the relevant class session (presentation). Issues that could potentially be addressed include:
- Trade in primary commodities as a barrier to economic growth in developing economies
- Economic enclaves as an impediment to economic growth in developing economies
- Application of dependency theory to economic development in the Global South
- Costs and benefits of international migration flows among nations
- The role of international aid in relieving foreign currency shortages
- Costs and benefits of industrialisation as a growth strategy
The written report should outline the chosen issue and state why it is of interest in the context of international economic development. Contributions to analysis of the issue from both theoretical and empirical perspectives should be presented, noting areas of agreement and disagreement and identifying any gaps in the literature that could be addressed by future research. Lessons or implications for government and business should be discussed. Students will then each present their report.
Format
The format required for the report is set out here. This format contains eight sections.
Cover Page (not included in word count)
List of contents (not included in word count)
Executive Summary (around 200 words) (this is the last section to be written)
Introduction (around 500 words)
- Identify the chosen issue
- Describe briefly the nature of the issue
- Summarise briefly the analysis to follow
Analysis (around 1,500 words)
- Provide a review of the theoretical and empirical literature relevant to the issue
- Use algebraic or geometric models to demonstrate mastery of the issue (use of such models is not compulsory but a model can sometimes convey an idea succinctly without using too many words)
- Carefully identify areas of agreement and disagreement among various contributors to the literature
- Identify any area(s) that should be the focus of future research
Conclusion (around 300 words)
References (not included in word count)
Appendices (if any) (not included in word count)
Solution
1. Introduction
Common problems the host countries experience include pressure on the economy because of rising demand in areas such as health, education, and accommodations. Sometimes the social problems are due to interaction with strangers for a certain time and change of the population, manifesting in conflict between groups. The industry often influences employment prospects, and job markets have limited positions for newcomers, as with locals and immigrants (Safarian, 2024). Furthermore, capacity is also strained where infrastructure reaches its optimum and the services offered dilute.
The nature of the issues is mostly related to the economic and cultural factors of the host countries. As follows the economy, this report highlighted the problems of unskilled employment. In addition, it highlighted the issues of immigration and the cultural burden issues in host countries for the assignment helpline.
This report highlighted major problems associated with the structures of host countries. In addition, it served the thoughts of literature and revealed a model of capital mobility to highlight the problems associated with the host countries. Some of the economic developments are additionally revealed, which can help to develop the capacity of the host countries' business effectiveness.
2. Analysis
2.1 Review of the theoretical and empirical literature
One of the relevant reasons for wishing the host countries suffered the most is their unskilled wages. According to Demireva and Zwysen (2020), an oversupply of employment in the sectors of low skills leads to the suppression of wages. As for that, the levels of employment benefits are getting lower by 4.9%. Disappointment, the earning capabilities of the skilled employees have fallen in those host countries. As per Livermore and Revesz (2020), the cost-benefit analysis theory helps to analyse the relationships between business costs against the benefits they receive. Using this theory and the thoughts of Wahba (2021) revealed differences in economic cost effects on the host countries. The rising demands for different public services like education and healthcare facilities have raised their economic stain. In addition, infrastructural pressures like the development of public transportation additionally affected their budgetary works.
From the viewpoint of Bilir et al. (2019), multinational companies play a huge role in the parts of trade developments as well as technological developments in host countries. For the lower employment costs, the multinational companies receive more benefited employability environments. It helps them to raise their structures of productivity with a minimum of employment costs. According to Lyailya and Zagida (2020), the host countries are additionally suffering from migration problems. The political influence of these countries influenced most of the young people. It is the cause of cultural shifts and concerns about job security environments.
2.2 Model of Capital Mobility
As follows the model of capital mobility, the effects of reward factors as well as international migations are analysed between two countries. As follows the model, the poor structures of labour mobilities of host countries affected their levels of employee effectiveness. As for the unskilled employees of those host countries, their capital can be moved faster in the international markets (Gerking and Mutti, 1983). However, it can bring lower returns on their international capital as well as employees' capital.
As for this model utilisation, two host countries are taken into consideration, which are the United States and Mexico. To understand the problems of this host country, two basic elements, their labour and capital, are taken into consideration. For that, the US contained an unskilled labour range of 5.7 million between the session of 2024 (International Labour Office, 2024). At this time, the country contained a growth rate of 37% on their capital infrastructures (International Labour Office, 2024). This shortage of labour in the US is greater than the shortage of unskilled labourers in Mexico. However, the country contained capital growth of 27% which is lower than the US (Deloitte, 2024). As follows the capital-labour ratios of these host countries, they both suffered from the issue of labour shortage and rising unfilled demands of skillful employment.
Table 1: Labour shortage
(source: International Labour Office, 2024)
2.3 Areas of Agreement and Disagreement
The main area of agreement is the employment issues in the host countries. In the global international market, there are 13 countries that face similar issues, where Israel is in the top position for the matters of unskilled employment (Yahoo, 2024). As for that, there was a rise in migrant employment visualised in the global job market, which reached 169 million last year. Additionally, from the global economy, the imigations lecvels of the unskilled employees are visaulised from 20% to 60% (Yahoo, 2024). It effected the efficiency rates and productional capabilities of the countries.
The disagreement factor of the literature is the attraction of multinational companies for the host countries. In host countries, the multinational business can receive employment benefits. However, it can affect their cost structures most (Hunter, 2024). It can raise the risks of exchange rates within the business. The differences in exchange rates between the countries can lead the multinational business financial consequences (Hunter, 2024). As like the poor exchange rate of Iran, the relationship with its multinationals is being affected (VoA, 2024). Additionally, the cultural risks can additionally reduce the production capacity of the company.
As for that, the gap in the thought literature is visualised for the analysis of output levels of unskilled employees. The capacity of unskilled employees for effective production, as well as the factors of capital-labour ratio, is not utilised by the thought of literature.
2.4 Area of Further Research
The area which will be considered for further research is the return on investment rates. It will analyse the levels of returns the international business can receive from their operational procedures in the host countries. Multinational companies face differences in internal and external issues during the time of their operational work in host countries. In addition, it will additionally serve to research the factors or challenges the multinational companies can face during the session of operations in these countries.
2.5 Current Developments
AI and Automation- One of the effective developments in the international economy is automation technologies. By using AI and automation technologies, international businesses utilise their digital services as well as productivity facilities (Cugurullo, 2020). As per the world's economic theory, the AI foundation model can help to serve dynamic market control (World Economic Forum, 2024). For that, it can bring equitable benefits of market distributions.
Global Supply Chain- For reasons of the COVID-19 pandemic, different countries faced geopolitical issues. As for that, the countries utilised their supply chain management procedures and served their focus for the diversity of supply chain management (Guan et al. 2020). Fort the COVID, the transportation costs for supplements are raised by 1.5%, whereas the costs of consumer purchases are raised by 7.5% (UNCTAD, 2024). By these moves, the business can manage its supply chain from international countries and reduce its supply costs (UNCTAD, 2024). It can additionally help to reduce their productivity price in features.
2.6 Evaluation
In the host countries, businesses face illegal migration issues. As for that, the US faced the highest number of migration issues during the time of 2018 as it contained a migration level of 23%, which is the highest level of migration (Immigration Council, 2021). In the current session, the country contained levels of immigrant population of 13.8%, which affected the economic levels deeply (Immigration Council, 2021). As for the reasons for migration, thousands of people travelled from north to southern countries. It deeply affected the levels of populations of different countries. In addition, of the rising levels of illegal migrants in economically developed countries, the employment levels of those areas are affected the most (Wihtol de Wenden, 2023). It additionally impacted the levels of their economic structures and raised the demand for public transportation as well as the public services offered by the governments.
Figure 1: Immigrant population in the US
(Source: Immigration Council, 2021)
3. Conclusion
This report served as a detailed analysis of the problems associated with the host countries. As the major problem, this report served unskilled employees at different levels of the country. In addition, it analysed the difficulties faced by the host countries during the time of their economic management. By using the capital mobility model, this report highlighted the differences in capital modalities between the US and Mexico. It additionally revealed some of the effective agreement thoughts as well as disagreement thoughts of literature. As follows the theory of cost benefits analysis, the major difficulties are revealed in the portions of cost structures of host countries.
As follows, the host countries suffer from economic burdens as well as cultural difficulties during the time of their operational process. Additionally, highlighted the difficulties of analysing the involvement of multinational companies in creating better economic and employment structures for the host countries. As for the significance, these lessons highlighted the developments of the economy and technologies. It highlighted international economic developments by using authoritative tools as well as the utilisation of the global supply chains. It additionally described the shifts of business needs for new technological skills that can help support the development of host countries.
References
Reports
HM5003 Economics for Business Report Sample
Detailed Requirements of The Assignment
You are a group of advisors to the Management Board in your company with Headquarters in Australia. As advisors you are first, required to conduct research on your selected sector/industry covering the previous 5- 10 years. Second, you are required to present a company strategy to your Management Board and to the Federal Government of Australia covering the next 5 years. Your Management Board requires that you submit a 3000-word market report containing your findings and strategies. Finally, your Management Board requires that your research should predominantly be based on microeconomic and macroeconomic theory and application of Holmes Institute syllabus.
Company Selection Guidelines
Note:
(i) Choose a company/firm of your choice.
(ii) The company/firm must be an enterprise based in Australia either as a national enterprise or a multinational subsidiary in Australia with headquarters abroad
Note:
i. if your company has many products and/or services, you can select a representative product/service to be the basis for your research.
ii. This report should provide useful information for your company’s Management Board. It should use a variety of resources, including the textbook, newspapers, industry reports, the ABS website, and other sources.
iii. Furthermore, your report should include headings and sub-headings. It needs to be properly referenced using the Harvard style and at least 5 references.
Solution
Introduction
It is the retail sector where one may find a few of Australia's strong economic pillars; and in that retail sector, there is the paramount position of the Woolworths Group. Formed in 1924, Woolworths has grown to become Australia's only largest supermarket chain, having gained a strong force of customers from metropolitan and regional areas. A broad portfolio comprising groceries, clothes, and other household goods or items really pinned this company to the leading spot in the retail industry. This report will deeply analyse the Woolworths Group's positioning in the market through discussions of both microeconomic and macroeconomic variables that shape its operations, from consumer preference and cost structures to regulatory environments, each influencing overall demand and supply. Furthermore, this essay discusses two recent important macro events that have affected Woolworths and the retail sector: the COVID-19 pandemic. Precisely, through an understanding of such variables, the report is supposed to render strategic proposals that would allow Woolworths to sustain its competitive advantage and adjust to the constant economic changes occurring within the Australian market.
Company Background
The group of Woolworths was established in 1924 and grew steadily as the largest supermarket chain in Australia, holding an outstanding share in the retail market. The company Woolworths was able to secure about 37% shares in the concerned market by the year 2024 and indicates its leading position in the business sector (Woolworths Group 2024). Major group operates via a host of brands and among them, Woolworths Supermarkets is the most famous. In Australia, there are the Woolworths Supermarkets, which serve millions of customers with extensive varieties of fresh produce and groceries, bakery foods, and household items.
Apart from Woolworths Supermarkets, the company owns a chain of discount department stores, Big W, which offers everything from clothing and electronics to homeware. This way, Woolworths Diversity can enable its company to infiltrate various sectors of the retail market and make sure customers enjoy one-stop shopping. With more than 1,000 store locations across the country, in both urban and regional settings, Woolworths' immense network ensures outreach to all types of customers, from metropolitan centers down to the most remote rural communities (Woolworths 2024). The company has now embraced digital transformation, expanding its online shopping platform and home delivery services to meet growing demand for convenience.
The commitment to sustainability by Woolworths has also seen the company embark on plastic use reduction strategy, energy efficiency, and supports the local community. With its solid supply for The Assignment Helpline complemented with a focus on customer service and innovation, the company has sealed a position among the leaders in the Australian retailing industry. While Woolworths continues to adapt to the changing market conditions and consumer preference, the company is positioned to maintain its leadership in the market in coming years.
Industry/Sector Background
The Australian retail industry is dynamic and highly competitive. Among the many it plays one of the important roles in the nation's economy. It perceives tough competition from all major companies like Woolworths, Coles, and Aldi, fighting for more shares of the market. This has made conditions such that there is a moderately low profit margin in the marketplace and for companies to make money based on high turnover rates.
Over the past decade, the retail industry has changed a lot, and it still does, for reasons that are very important. Among such causes of change are technological advances, which brought a full change in consumers' ways of shopping (KMPG 2024). This grudgingly forced companies like Woolworths to extend their online shelf space to a greater degree and integrate more technology into their operations to make the customer experience great and to make supply chains efficient.
Consumer preferences have also changed dramatically. Convenience, price on value, and sustainability are absolutely demanded. Providing the same information as before, consumers are more knowledgeable and price-sensitive, and they usually reach for digital means when comparing prices or searching for the best value. That trend has forward-shifted the retailer's price competition; therefore, companies run promotions very frequently, discounts, and loyalty programs to win and retain customers (KMPG 2024).
Besides that, economic cycles of recession and recovery have also taken their turn to hit the retail industry. Some major factors that determine retail sales include inflation, unemployment rates, and consumer confidence (Chen et al., 2024, p. 1678(2)). However, the most unparalleled attack on the industry has come from the unseen enemy known as the COVID-19 pandemic, which disrupted supply chains, altered the way people shop, and accelerated the switch to online shopping.
Despite these, the Australian retail industry is equally resilient, with companies in the industry working constantly to innovate, especially at times when the demand from consumers shifts. The resilience of the sector strongly depends on how it will adapt to changing economic conditions and technological advancement.
Market Structure of the Industry
Woolworths falls into the oligopolistic market structure in that of the Australian supermarket sector, wherein there are a limited number of large-scale firms put together in one market (Woolworths Group 2024). This market structure is highly manifested through the duopoly between Woolworths and the other major competitor, Coles. Aggregated, these two giants share more than 70% of the supermarket market share in Australia. Significant economies of scale, for instance, are few of the reasons that maintain this dominance, besides the fact that the extensive supply chains and brand loyalty exhibited by their products make it very difficult to effectively compete with new entrants.
Markets are oligopolistic in nature, and hence entry barriers for the market are high. Some of these impediments include the huge capital amount required to enter into a supermarket chain, huge distribution networks required, and it is difficult to earn consumer trust and loyalty (Devine & Bertsch 2023, p. 559(2)). Moreover, woolworths and Coles representing players of this category have existing relations with all suppliers in addition to having the best logistics system and hence are in strong positions.
Here, product differentiation plays an important role. Indeed, varied products are not absent in Woolworths and Coles as both sell private label brands, organic produce, and locally produced goods, which enable them to cater to the various preferences of their customers (Yuki & Kubo 2023, p. 95(3)). In turn, this would allow companies to retain brand loyalty and impede the entry of competition by small players and discounters such as Aldi.
Another defining characteristic of oligopoly in the Australian supermarket industry is price leadership. In this respect, both Woolworths and Coles have the predisposition to often lead any changes to prices, while through their market power, they have been able to lay down the law on overall pricing across the sector. These situations tend to build into minor price wars where aggressive discounting by both companies is used to lure customers away and hurts profitability throughout the industry.
Microeconomic and Macroeconomic Factors Influencing Demand
Microeconomic Factors:
1. Consumer Preferences:
Consumer preferences: These are vital and, therefore, have the effect of changing demand for products offered by Woolworths. Of late, consumers have been demanding organic and locally sourced products. This reflects an increased awareness by Australian consumers of health sustainability and environmental problems. Woolworths has responded by expanding its organic and locally produced products to position itself as the retailer of these emerging consumer needs. In doing so, it finds itself in a better position to meet the consumer requirements for such values in the products and also enhances its brand image among consumers for being responsible and customer-centric (Forest et al., 2023, p. 148(2)).
2. Price Elasticity:
Woolworths has highly elastic demand in many of its products. This means that with minor price increases or decreases, the level of demand changes significantly. Where this aspect is most striking among products for non-essential and luxury categories, consumers in this regard tend to be rather sensitive regarding price. For instance, when on sale, they consume more and more consumers are found when on sale. Still, any increase in price brings down the level of sales considerably (Chen & Lim 2023, p. 236(3)). Price elasticity empowers Woolworths with the necessary insights to either raise or lower prices in order to optimize product revenues within the realm of competitiveness.
Macroeconomic Factors:
1. Economic Growth:
The general economic conditions, such as the growth in Australia's GDP, have an impact on the spending capacity of consumers, influencing the demand at Woolworths. In good economic times, when the consumer has a sense of financial security, there is usually gains in discretionary spend, improving sales of higher-margin items for Woolworths in premium groceries and household goods. Due to this, consumers are sometimes very conscious of their prices during the downtrends in the economy, shifting demand to basic and cheaper varieties. Woolworths would have to be agile in its product offering and pricing strategies based on these economic cycles (Kaye & Nair 2023).
2. Inflation Rates:
Inflation: it is one of the most vital macro-economic factors that can occur, and it will directly affect the consumers' purchasing power. Increased inflation diminishes disposable income (Kozlov 2023, p. 23(3)). Therefore, consumers will become very conscious about spending. It can dampen demand for non-essential, high-value products of Woolworths, since they prefer to spend money on plain, basic merchandise only. Probably, Woolworths will also need to pass on some of the inflationary pressures that are related to an upsurge in the cost of goods sold. However, this is not always easy in a highly competitive market without having any adverse impact on demand. Therefore, Woolworths has to make a fine balance in pricing strategy to retain demand amidst cost pressures.
Microeconomic and Macroeconomic Factors Influencing Supply
• Microeconomic Factors:
1. Cost of Goods Sold:
The cost of goods sold or COGS is a major microeconomic factor that influences the supply of Woolworths. Any sort of change in the input cost from suppliers mainly in agriculture has a great effect on the supply chain. In such a scenario, the ensuing changes in fresh produce, dairy, and meat price are brought about by conditions of weather, crop yield, and feed prices and it influences the cost structure for Woolworths. If the cost to the supplier goes up, it will be hard for Woolworths to maintain their usual price without giving up some of the profit margin, which could affect how much is supplied or the pricing approach.
2. Labour Costs:
Other than that, one of the basic microeconomic factors which could affect the supply of Woolworths is labour costs. An increase in minimum wage or any other employee-related cost such as cost of training and development and employee benefits may affect the overall operational cost for the company (Woolworths Group 2024). For example, an increased cost of labour increases the operational cost for maintaining stores and logistics; hence, such increased cost might force Woolworths to change the supply of its merchandise with a view to optimizing cost. The shortage or surplus of labor could also impact the efficiency of supply chain functions, ensuring that the store shelves are always stocked or empty.
• Macroeconomic factors
1. Global Supply Chains:
Global supply chains significantly affect the sourcing and supplying of products to Woolworths. Disruptions in global trade have started to take their toll in regard to the availability and cost of imported goods. Shipping delays, along with increased costs for freight and bottlenecks in supply chains, have caused shortages with some products; thus, higher costs that have, in turn, been one factor making Woolworths reconsider strategies on sourcing. This dependence on global supply chains means international disruptions have a cascading effect on Woolworths' domestic supply capabilities.
2. Government Regulations:
Government regulations, particularly governmental laws about food safety and environment-friendly practices are still one of the major macroeconomic determinants that can affect Woolworths supplies. Compliance with strict regulations typically requires investment in improving technology, processes, and training (Nouhaila, M. & Younes 2023, p. 77(4)). These usually sum up to operational costs. Similarly, environmental-related regulations directed at reduction of carbon footprints or waste methods influence packaging, sourcing, and distribution channels. While they are regulatory requirements that ensure this product is safe and sustainable, they add complexity and cost to the Woolworths supply chain, which impacts the availability of goods and price of some of those goods..
Elasticity
Different products offered by Woolworths have different elasticities of their respective prices. For example, the demand for most of the essential goods, such as bread, milk, and eggs, is usually inelastic. In other words, for inelastic demand, a change in price would relatively have a small effect on the quantity demanded (Kolay & Tyagi 2018, p. 92(3)). For instance, even if the price of milk increases, consumers would still buy the product since it is considered an essential commodity. This inelasticity allows Woolworths some flexibility in transferring price increases without significantly impacting sales volumes for these staple commodities.
On the other hand, goods of luxury or non-essentials, like high-end chocolates, gourmet foods, and seasonal goods, operate under elastic demand. This means consumers are always sensitive to price changes, and even with a slight increase in price, there can be a reasonable fall in the quantity demanded (Kolay & Tyagi 2018, p. 95(2)) As an example, if the price of a particular luxury chocolate increases at Woolworths, then their consumers may opt for a more economic version of the same brand or may not buy it altogether. This elasticity means that for such products, pricing strategies should be carefully worked out by Woolworths to ensure competitiveness at an optimum revenue level.
Knowing the elasticity of said various products will also enable Woolworths to adapt its pricing strategies to ensure that it is able to maximize revenues without hurting consumer sensitivity over the prices of various group products. By balancing the pricing of inelastic and elastic products, Woolworths can maintain overall profitability and customer satisfaction.
Recent Macroeconomic Event Affecting Woolworths and Australia
The COVID-19 pandemic is, without doubt, one of the most pivotal macroeconomic events of the modern era. It has hit hard on the retail industry worldwide, including Woolworths, an Australian retail company. Surprisingly, as the pandemic started to take shape, it brought in changes in customer purchase patterns that were fundamental in nature. The demand the Company witnessed for basic items such as groceries, households, and hygiene was arguably unprecedented. Since Woolworths has always been one of the biggest supermarket chains in Australia, it found itself at the receiving end of such a demand and thus had to effect immediate alterations in their operations with all due haste.
The sudden rise in the demand for essential products led to a situation where stock was out and disrupted supply chains. Due to the closure of international borders, slowed production, and delayed shipping, the global supply chains were highly disrupted. Woolworths had to take on this challenge by optimizing its supply chain, cleaning up its inventory levels, and ensuring that the key products were available in the stores. Furthermore, they attached importance to the health and safety of its employees and customers by following strict hygiene practices and social distancing in its stores.
Another major change which the pandemic brought in its wake was the rapid acceleration of online shopping. Consuming populations were fast depending on online services for their grocery needs with lockdowns and social distancing norms in force. Woolworths scaled up its digital infrastructure and expanded its online shopping to reach home deliveries to meet the demand surge (Vohra & Mehta 2021, p. 19(2)). Contactless delivery is one of the innovative solutions proposed by Woolworths for customer convenience along with click-and-collect services to make customers and staff safer.
Recommendations
Other key strategic recommendations that would help Woolworths remain competitive and resilient in the changing retail landscape will include:
1. Invest in Digital Transformation:
o Woolworths should continue its integration and development of the online shopping platform, and ensure a wider delivery network to meet the consumer expectation for convenience. Further, this would be cemented by investing in technology-enabled solutions in forms of AI, whether for inventory management or personalising the shopping experiences.
2. Supply Chain Diversification:
o To reduce the risk of disruption within international supplies, Woolworths should decrease reliance on international suppliers by buying more products locally. Building stronger relationships with local producers and investing in domestic supply chains will reduce supply chain vulnerability stemming from external shocks.
3. Sustainability Initiatives:
It is recommended that Woolworths further invest in sustainable practices such as reduction of plastic use, enhancing energy efficiency, and support for local communities. Such initiatives are likely to find resonance among environmentally sensitive consumers and also ensure compliance with regulatory demands, which indeed are getting tough. This will be positioning Woolworths as one of the leaders in sustainable retailing.
Conclusion
In such a situation, Woolworths Group should be well placed to maintain a competitive edge in the Australian retail market. However, it is equally true that this industry faces stiff volatility, at the same time suffering at the hands of economic fluctuations and consumer changes. For example, Woolworths would need to pursue digital transformation continuously to sustain the growth of its online platforms and reach consumers with more convenient options for increased delivery services. Besides, the supply chains must be spread out to minimize risks of global disruption and ensure supplies of goods smoothly. Lastly, full-scale commitment to environmental sustainability will attract customers who are green-aware and thus help the supermarket comply with increasing demands by regulators. With such strategic focuses, Woolworths is bound to continue surging into the future, capitalize on any forthcoming opportunities, and stay viable through unforgiving retail competition. These efforts ensure that Woolworths will continue to be a powerhouse that leads the Australian market with trusted and innovative leadership.
References
.png)
.png)
Assignment
BUECO5903 Business Economics Assignment Part A Sample
Instructions:
This assignment contains five questions. You are required to answer all five questions. This is an individual piece of assessment. Make sure your submission is an original submission; this means it must be the creation of the person submitting it. You are required to explain your reasoning and use diagrams where appropriate.
Due date: Your instructor will advise you of the submission date of this assessment task. Assignment to be submitted electronically in the drop box in your Moodle shell.
Question 1
Using a production possibilities frontier (PPF) diagram, determine how does the PPF change in response to the events describe below. Make sure to explicitly indicate what sectors you are representing, and what sort of assumptions each event implies (i.e., a neutral effect vs a sector-biased effect). The latter follows from your assumptions on the factor intensity of the sector you are representing.
a) A relaxation of policies allowing more foreign direct investment into the country.
b) Increasing the minimum wage level.
c) A decrease in expenditure on research and development.
d) An increase in the retirement age.
e) Government policies supporting the provision of services, without affecting manufacturing.
Question 2
For each of the events describe below, you are required to explain:
1. The market you are evaluating (e.g., labour market, automotive market, etc).
2. Does the event act on the demand side, supply side, or both sides of the market?
3. Does the event lead to a quantity or price change? Or does the event lead to a shift in demand, supply, or both?
Make sure to explain what sort of assumptions you are making on the elasticities of demand and supply (when plotting your demand and supply, describe whether you are assuming an elastic or inelastic demand/supply).
a) A concerted reduction in the total production level in oil markets.
b) The implementation of a minimum wage.
c) The implementation of subsidies to agricultural production in Australia
d) The implementation of a Carbon tax in the resources exploitation sector. A Carbon tax is charged according to the level of emissions of greenhouse gases in an economy.
e) The implementation of a new loan program to university students in the education sector
Question 3
Compare the impact of a recession that reduces consumer income by 10 percent on the consumption of durable goods and house rentals. Suppose that the income elasticity of demand for durable goods is 1.5 and the income elasticity of demand for house rentals is 0.3. Based on your response, make a policy argument to support through government funding either businesses or house rentals.
Question 4
Using a supply and demand analysis show first the labour market in equilibrium, and then show
a) the effect of a reduction in the demand for labour as a consequence of a pandemic.
b) The effect of a government subsidy to producers to restore the employment of labour.
Provide a diagram with clear axis details. Make sure to explain what sort of assumptions you are making on the elasticities of demand and supply.
Solution
Answer 1:
a.
Here, agricultural and service sectors are represented. Assume the economy produces good X which is capital-intensive in service sector and good Y which is labor-intensive in agricultural sector. Hence, more foreign direct investment will create sector-biased effect as the production of good X will increase keeping the production of good Y unchanged. This situation is drawn in the figure below:
.png)
Figure 1: Production Possibility Frontier: Sector-Biased Effect
b.
Again consider good X in the agricultural and good Y in the manufacturing industry. Good X is capital intensive and Good Y is labour intensive. For Assignment Help, Increasing the minimum wage level will help the industry to get more labourers for producing good Y while the production of good X will also increase but by a smaller rate (Arnold, Arnold and Arnold 2022). Hence, the situation implies sector-biased effect.
.png)
Figure 2: Production Possibility Frontier: Sector-Biased Effect
C.
Consider two industries, service and manufacturing industries are operating in the economy. As expenditure on research and development (R&D) declines, the service sector can increase its total production by conducting more research work. Furthermore, manufacturing sector can also increase its total production due to increasing R&D. Hence, the economy will experience a neutral effect on the PPF.
.png)
Figure 3: Production Possibility Frontier: Neutral Effect
d.
Suppose the economy has manufacturing sector and service sector. An increase in the retirement age will help both sectors to get a large number of skilled and experienced labour force. Hence, production in both sectors will increase and a neutral effect can be seen on the PPF.
.png)
Figure 4: Production Possibility Frontier: Neutral Effect
e.
The economy has both service sector and manufacturing sector. Government policies are implemented to support the provision of services though these do not influence manufacturing process. Hence, production in the service sector will increase keeping total production in manufacturing sector unchanged. Thus, a sector-biased effect can be seen on the PPF.
.png)
Figure 5: Production Possibility Frontier: Sector-Biased Effect
Answer 2:
A.
.png)
Figure 6: Change in supply in the oil market
The condition is based on the oil market. The concerted reduction in total production of oil will affect the supply side. Oil market has inelastic demand and supply. This is because, supply of oil cannot be increased suddenly and demand for oil does not change significantly with its price change. Figure 6 depicts the situation from where it is observed that equilibrium price will increase to P1 and equilibrium quantity will decrease to Q1.
b.
.png)
Figure 7: Change in supply in the labour market
The condition is based on the labour market. The implementation of a minimum wage will affect the supply side of labour if the wage rate will impose above the market wage rate. Labour market has elastic demand and supply. This is because, demand and supply of labour can be changed significantly by a small change in its wage. The condition of implementing minimum wage is shown in Figure 7. Here Wm is the minimum wage which is higher than market wage W0. Hence, an increase in labour supply by N1N2 are can be seen in the economy.
c.
.png)
Figure 8: Change in supply in the agricultural market
The condition is based on the agricultural market. The implementation of subsidies on Australian agricultural product will affect supply side. Agricultural market has elastic demand and supply. The implementation of subsidy will encourage farmers to produce more amount of agricultural products. Figure 8 depicts the situation where supply curve increases from S0 to S1. Thus, equilibrium price declines to P1 and equilibrium quantity increases to Q1.
d.
.png)
Figure 9: Change in supply in the Energy market
The condition is based on the energy producing market. The implementation of a carbon tax as per the level of greenhouse gas emission will affect the supply side of energy production. Energy market has inelastic supply due to the limited resource. The condition of decreasing supply of energy resource is shown in Figure 9. Here market price of energy increase to P1 from P0 and energy supply will decline to Q1 from Q0 due to imposition of carbon tax.
e.
.png)
Figure 10: Change in supply in the Energy market
The condition is based on the energy education market. The implementation of a new loan program will increase demand for education among university students. Education has inelastic demand as it is necessary for everyone. The condition of increasing demand for education is shown in Figure 10. Here market price of education increases to P1 from P0 and equilibrium quantity declines to Q1 from Q0.
Answer 3:
When income elasticity of demand becomes greater than 1 then it implies that the good is luxury item. On the other hand, income elasticity of demand less than 1 implies that the good is necessary item. For durable goods, the income elasticity of demand is 1.5 and income elasticity of house rental is 0.3. Hence, as per the given condition, durable goods are luxury items and house rentals are necessary items (El Shagi, Sawyer and Tochkov 2022). Thus, government needs to implement funding policy on house rents so that people can afford it easily.
Answer 4:
Labour demand curve has a negative slope showing an inverse relationship between real wage of workers and amount of labour. Labour supply curve is upward rising as it shows a positive relationship between real wage and amount of labour. The supply curve expresses a tradeoff between labour and leisure and hence it bends slightly at the upper portion.
.png)
Figure 11: Labour Market Equilibrium
a.
The impact of decreasing labour demand due to pandemic is shown in figure below:
.png)
Figure 12: Decrease in Demand for labour
Due to decrease in demand for labour, the real wage will also fall to W1 from We while amount of labour in the market will also fall to N1 from Ne.
b.
Impact of a government subsidy to producers for restoring the labour employment:
.png)
Figure 13: Increase in labour supply
Due to increase in labour, the real wage will also fall to W1 from We while amount of labour in the market will increase to N1 from Ne.
Answer 5:
a.
.png)
b.
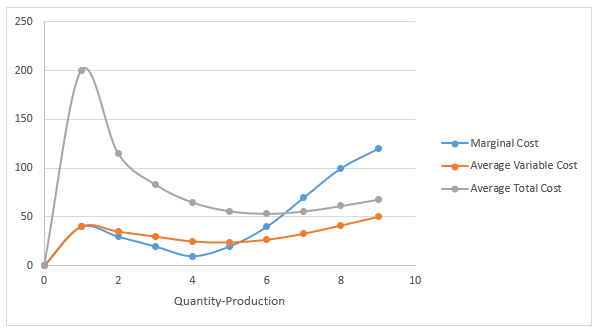
Figure 13: MC, AVC and ATC Curves
References:
.png)
Case Study
ECON6001 Economic Principles Case Study Sample
Context:
COVID-19 continues to adversely affect economies and is burdening the fiscus of many economies globally. It has implications not only on national budgets but on macroeconomic management.
This assessment aims at:
• Assessing the students’ ability to critically analyse the impact of COVID-19 on key sectors of the pair of countries given, one from the ASEAN nations and another from Asia Pacific nations.
• Testing the students’ ability to perform a comparative analysis of the impact of COVID-19 on the forecast macroeconomic performance in 2021 and 2022
• Testing students’ evaluation of the efficacy of fiscal policy in dealing with the COVID-19 induced recessions
• Evaluating the students’ understanding of the concept of quantitative easing and how it has been used, if any, to assist in combating the COVID-19 induced recessions.
Instructions:
(a) On the basis of that information and other sources of data, compare the countries’ projected macroeconomic performance in 2021 and 2022, your discussion should focus on real GDP, unemployment and inflation. Sources of useful data could be government websites, think tanks, IMF, OECD, Asian Development Bank and the World Bank.
(b) Discuss how these two countries have used fiscal policy in combating the COVID-19
recession.
(c) Critically evaluate the following statement, “Fiscal policy should lead and monetary policy follows in dealing with the recession as a result of COVID-19”. Discuss this in the context of the two allocated countries and any third country from the table of countries given above.
(d) Quantitative easing (QE) is one of the untraditional monetary policy approaches that can be used by central banks. Discuss how it can be used to deal with severe economic crises suchas the recession caused by COVID-19. To what extent have these countries (the three in part (d)) used this unconventional monetary policy tool to contain the recession emanating from the advent of COVID-19? (10 marks).
Solution
Introduction
Overview of the Report
Every country across the world can be seen to have different growth patterns and trends in economic development and much of the same can be seen to be related to the primary industries and their contribution to the growth of the concerned economies as well as on the economic policies that are taken by the governments of the concerned countries. For Assignment Help However, the growth and performance of the economies and the industries operating in the same, can be seen to be considerably affected by different internal as well as external fluctuations taking place across the globe and in the country itself (Deb et al., 2020). One such fluctuation or phenomenon of immense importance is that of the ongoing crisis of the COVID-19 pandemic across the globe, that has not only led to deaths of millions of people, but can also be seen to be causing immensely negative implications on the businesses, industries and economies of almost all the nations across the globe.
Purpose of the Report
Keeping this into consideration, the concerned document emphasizes on the impacts of this pandemic on the economy and industries of India and Philippines, with the purpose of discussing the policy frameworks of the concerned nations and their implications in this aspect.
Comparison of five main sectors and their performance in COVID-19
India has been performing impressively in the global economic framework over the years and is considered to be one of the most prominent developing nations across the globe. The primary industries or sectors of the concerned country, that can be seen to be contributing impressively in the GDP of the concerned country, can be shown with the help of the following figure:
.png)
Figure 1: Primary sectors and their contribution to the GDP of India
(Source: Statisticstimes.com, 2021)
The textile sector, the real estate sector, the agricultural sector, the manufacturing sector and the tourism sector can be seen to be the top five and prominent sectors in India, contributing substantially to the growth and the GDP of the concerned country over the years. However, the ongoing crisis of the COVID-19 pandemic situation can be seen to have affected these major industries and their profitability and revenue generation, much of which can be attributed to the lockdowns and the restrictive measures that are being taken by the government of India to contain the spread of the COVID-19 pandemic situation (Mckinsey.com, 2021). The effects of the concerned pandemic situation on these industries can be shown with the help of the following figure:
.png)
Figure 2: Impacts of the COVID-19 pandemic situation on the outputs of the different sectors
(Source: Mckinsey.com, 2021)
The construction sector, tourism sector and the textile sector can be seen to have been majorly affected and the effects can also be seen to be severe in the different manufacturing operations and in the agricultural sector (Pib.gov.in, 2021).
On the other hand, the contributions of different sectors to the GDP of Philippines, over the years, can be shown as below:
.png)
Figure 3: Contributions of different sectors to the GDP of Philippines
(Source: Statista.com, 2021)
The tourism sector, the agricultural sector, the real estate sector, outsourcing, retailing and the construction sector can be seen to be the top five industries or sectors contributing massively to the economic growth of the concerned country (Unido.org, 2021). There has been nearly 80% decline in the tourism demand in the concerned country due to the ongoing COVID-19 pandemic situation, while there has also been considerable reduction in the production volumes of the general manufacturing sector of Philippines as shown below:
.png)
Figure 4: Reduction in production volumes of the manufacturing industries in Philippines due to the COVID-19 pandemic situation
(Source: Unido.org, 2021)
The agricultural sector has been comparatively less affected while there have been substantial implications of the pandemic situation on the retail and the outsources sectors of the concerned country, much of which can be attributed to the changing demands and preference patterns for the products and services of the concerned sectors of Philippines.
Comparison of the projected macroeconomic performance of India and Philippines in 2021-2022
The two countries considered in this report are expected to have differences in their projected macroeconomic performances, based on the ways in which they are trying to mitigate the adverse impacts of the COVID-19 pandemic crisis situation on their economies. India, is expected to have an increase in the GDP in 2021, with the expected GDP being 2850 billion USD in 2021 and the same is expected to grow further to around 3000 billion USD in 2022. However, the growth of Philippines is expected to be slower in the coming years, with the expected GDP to be 373.00 USD billion in 2021 and 379.00 USD billion in 2022 and this may be due to the slower recovery of the concerned nation from the impacts of the ongoing pandemic crisis (Data.worldbank.org, 2021). The unemployment in Philippines is expected to have the following trends with the slow recovery of the economy:
.png)
Figure 5: Predicted unemployment in Philippines in 2021-2022
(Source: Tradingeconomics.com, 2021)
However, although India also experienced a considerable spike in the unemployment due to the pandemic situation and the consequent lockdowns and restrictive measures, it is expected to experience a more impressive fall in the unemployment rate in both 2021 and 2022:
.png)
Figure 6: Projected unemployment rate in India in 2021-2022
(Source: Tradingeconomics.com, 2021)
The projected evidences highlight that while Philippines will be having a stagnated fall in unemployment in 2021 without much changes in 2022, India is expected to experience a continuous fall in unemployment in both 2021 and 2022 with the recovery of the concerned economy (Statisticstimes.com, 2021).
There will also be a fall in the inflation, as expected for India, and this may be due to the fall in prices of products and services for boosting the demand in the concerned economy in the COVID-19 aftermaths, as shown below:
.png)
Figure 7: Expected inflation rate in India in 2021-2022
(Source: Tradingeconomics.com, 2021)
However, the inflation rate for Philippines is expected to experience a constant decline in 2021 and 2022 and this can be shown as below:
.png)
Figure 8: Expected inflation rate of Philippines in 2021-2022
(Source: Tradingeconomics.com, 2021)
This can be due to the fact that due to the slow recovery of the economy of Philippines from the pandemic situation, the recessionary phase is expected to be prolonged in case of Philippines as compared to India.
Usage of fiscal policies for combating the COVID-19 recession
Both the concerned countries can be seen to have used fiscal policies extensively to boost their economies out of the recessionary situation caused by the ongoing COVID-19 pandemic crisis. In case of India, the government had launched a fiscal package of 22 billion USD for supporting the businesses, investments and also to strengthen the “Make in India” program, thereby supporting the small and medium industries in the concerned country. There are also different employee support programs and unemployment support as well as health care packages that have been incorporated under the fiscal policies of the concerned country to combat the COVID-19 recession (Home.kpmg, 2021). There have also been tax cuts incorporated by the government of India and similar fiscal policies can also be seen to have been implemented by Philippines to combat the recessionary effects of the ongoing pandemic crisis. However, unlike that of India, Philippines could not incorporate a huge relief package under its fiscal policy frameworks for the COVID-19 pandemic situation and this is mostly due to the lack of such resources for the small and developing nation like Philippines. However, there has been special risk allowances for health workers that have been launched by the concerned country, which is similar to the health insurances that have been implemented for the health workers of India, by the government of the concerned country.
Evaluation of The Statement in Terms of India, Philippines and Australia
There is a notion that in case of a recessionary situation, the fiscal policies are more effective and should be prioritized and the monetary policies should accompany the same. This has been the case for both India and Philippines as well as for the developed nations like that of Australia in combatting the recessionary effects caused by the ongoing COVID-19 pandemic situation. In case of India as well as Philippines, extensive tax cuts and exemptions are evident. On the other hand, Australia can be seen to have launched an elaborate fiscal relief package as well as programs like that of the Job-Keeper program to support the businesses to retain their workforces during the pandemic situation. These can be seen to be similar to that of India, which has also prioritized in providing direct support to the businesses and the general population of the concerned country (Imf.org, 2021). However, the policies taken by India can be seen to be a mixture of the fiscal as well as the monetary policies, and the monetary policies include more relaxed borrowing and lower interests which can also be seen to be similar in case of Australia. Philippines, on the other hand, can be seen to have mostly emphasized on fiscal policies than that of the monetary policies although there have been changes in the rate of interests in the concerned country, which has been done to boost the borrowing and the investment operations in the country to mitigate the recessionary situation caused by the ongoing pandemic crisis (Home.kpmg, 2021). Thus, it can be asserted that in case of the concerned three countries, fiscal policies have been prioritized and monetary policies have been supportive policies to combat the negative impacts of the COVID-19 pandemic situation on the respective economies of the concerned three countries.
Quantitative Easing and Its Usage To Contain The COVID-19 Recession By The Three Countries
The quantitative easing is an unconventional monetary policy, which is taken to increase the money supply, investment and lending activities in an economy and this is done by the central bank of an economy, by purchasing longer-term securities in the open market and is especially incorporated in recessionary situations. India, in the present period, can be seen to be incorporating this quantitative easing policy, to combat the stagnant economic situation created by the COVID-19 pandemic situation. To stimulate the economy, in 2020-2021, the Reserve Bank of India has bought bonds worth more than 14 billion USD to increase the money supply in the economy, which in turn is expected to help in boosting the investments and the lending activities in the economy, thereby contributing potentially in the expansion of businesses and the production activities in the concerned country (Bloomberg.com, 2021).
The Reserve Bank of Australia, can also be seen to have started with the quantitative easing policy, with an amount of more than 80 billion dollars being spend on the QE program, where Australian government bonds are being purchased and 20 billion dollars is being spent on purchasing the state and territory government bonds by the concerned nation. This has been helping the government to stimulate the economy by increasing the money supply and it is working as evident from the impressive recovery of the Australian economy, the business activities and the investments in the business operations in the aftermath of the COVID-19 pandemic situation (Imf.org, 2021). Like that of Australia and India, Philippines can also be seen to be taking the quantitative easing measures by buying up the government securities and this is being done directly to avoid the deflationary situation created by the COVID-19 pandemic situation. However, in case of Philippines the level of bond buying and quantitative easing can be seen to be lower than expected. Nevertheless, all the nations considered in this case, can be seen to be incorporating the unorthodox monetary policy of quantitative easing at different extents to mitigate the recessionary impacts of the ongoing COVID-19 pandemic situation (Pib.gov.in, 2021).
Conclusion
The above discussion makes it evident that the COVID-19 pandemic situation has been affecting the economies of different nations adversely and this is evident in case of both India and Philippines, as can be seen from the effects of the same on the top five industries of both the concerned countries. There is different fiscal as well as monetary policies that can be seen to be incorporated by the governments of these two countries as well as by the government of developed nation like that of Australia to mitigate the adverse effects of the ongoing COVID-19 pandemic situation and there are also evidences those fiscal policies are gaining more emphasis and prioritization in case of these countries to take their respective economies out of the recessionary situations. However, different extents of quantitative easing can also be seen to be taking place in these countries and these are being done to increase money supply, lending and investments and to decrease the recessionary situations in the economies of these concerned countries in the COVID-19 pandemic situation.
References
.png)
Assignment
ECO600 Economics and Finance for Business Assignment Sample
Instructions
1. Answer ALL four (4) sections. They contain short-answer questions. There are NO multiple-choice questions.
2. Keep your answers WITHIN 500 words per section.
Weighting 40%
Word Count Maximum 2,000 words
Section 1: Ethical enterprises in the modern economic system: the circular economy (10 marks; length: max. 500 words)
Background
You are hired as the sustainability manager of Manly Golf Club. It is in Sydney, not too far away from ICMS’s main campus.
Learn about the golf club, its facilities, and the services it provides here, in this website.
To distinguish itself from rival golf clubs in the area, this club is under pressure to demonstrate its circular economy credentials.
It has hired you to propose strategies that apply the circular economy principles to all aspects of its operations.
Question
1. Propose four (4) circular economy strategies, two for each of this golf club’s two services:
(i) Golfing
(ii) Weddings and functions
Where possible, demonstrate how each strategy could be good/profitable for the business.
Section 2: International trade and development (10 marks; length: max. 500 words)
Background
Papua New Guinea is a large island country north of Australia. It has a largely underdeveloped economy: it mostly exports raw materials such as timber and copper.
It does not have a large manufacturing base, relying instead on importing manufactured goods from abroad.
To learn about the country, go here. To learn about its economy, go here.
To see its low and high complexity exports, use Harvard University’s Atlas of Economic Complexity (click here):
- Enter the country’s name and click ‘start exploring’
- Find the section called ‘Export basket’ (the products it exports).
- Lastly, click on ‘Export complexity’ near the bottom.
Question
1. Select one (1) export item from this country whose complexity is low.
Then, follow these three steps:
First: propose how this item’s complexity could be improved using creativity, innovation or value-adding. Provide interesting detail. Argue why your proposals might be beneficial for this country’s economy.
Second: which country or region would be good target markets for this export, and why?
Third: suggest any trade-related policy that could help this country in this project.
Section 3: Macroeconomic fundamentals (10 marks; length: max. 500 words)
Background
Maldives is an archipelagic country made up 1,200 islands of which only around 200 are inhabited. It has a population of 540,000 people. It is located to the south of India, in the Arabian Sea.
The economy is heavily reliant on tourism, which is its largest ‘export’ industry by far, followed by seafood exports (fish, prawns etc.)
Macroeconomic situation
Since 2012, Australia’s inflation rate was around 2% and falling, before rising sharply in 2022 to almost 4% as COVID-19 restrictions were largely removed (go here, click on ‘10Y’ button to see the last 10 years’ trend).
In contrast, Maldives inflation in 2012 was almost 20%, fell to 5% in 2018, and was mostly negative (between 0% and -5%) since then. Analyse Maldives inflation rate since 2018, by going here and clicking on the ‘10Y’ button. See how it looks like, in contrast to Australia’s.
Analyse Maldives unemployment rate, here (click on the ‘50Y’ button for a long historical perspective. Analyse its balance of trade, here (click on the ‘25Y’ button).
Contrast that to Australia’s unemployment and balances of trade (see here and here, click the ‘25Y’ button). You may investigate these and other macroeconomic measures more on the Internet.
Question
1. By contrasting Maldives and Australia’s macroeconomic measures up to today in 2022, assess which phase of the business cycle Maldives is likely to be in (see here to learn about the business cycle). Justify your answer.
2. You are the general manager of the Four Seasons hotel chain in the Maldives. Given your analysis of the business cycle above:
(i) assess whether it might be a good idea for Four Seasons to invest in expanding its hotel operations in the Maldives
(ii) assess issues involved in hiring new hospitality managers and other workers for its hotels.
Section 4: Fiscal, monetary and supply-side policy (10 marks; max. 500 words)
Background
Country X is a developing country with a large government bureaucracy that is quite inefficient. The processing of applications to start new businesses are slow.
This country also has generous unemployment benefits: its unemployed citizens receive a generous payment that allows them to pay for rent and food such that there is little motivation for some of the unemployed to look for jobs.
The key macroeconomic measures of Country X over time– from two years ago to the present– are shown below. Examine them carefully. They are expressed in quarters (quarters means in chunks of three months):
(a) GDP growth: -2%, -1%, -2%, 14%, 5%, 3%, 2%, -1%
(b) Unemployment rate: 8%, 9%, 10%, 6%, 6%, 5%, 5%, 8%
(c) Inflation rate: 2%, 2%, 1%, 3%, 3%, 1%, 0.5%, 0.5%
(d) The purchasing managers’ index, PMI, in the manufacturing sector: 47, 48, 49, 49, 45, 48, 46, 45
The current official interest rate is 4%.
Question
Monetary policy
Given the macroeconomic information above about this country’s economy:
1. Would this country’s central bank be likely to increase or decrease its official interest rate or maintain it at the same level? Why do you say that?
Next, based on your answer above, assess how that action might affect or transmit to each of these, with sufficient detail and discussion:
(a) consumer spending (C) and business investment (I)
(b) the unemployment rate
(c) the inflation rate
(d) the currency’s exchange rate, assuming all other things being equal (will the currency’s value tend to appreciate or depreciate, and why?)
(e) the exchange rate’s effect on the country’s exports, assuming all other things being equal (could the trade balance move towards a surplus or a deficit?)
Solution
Section 1
Question 1
(i) Golfing
- With respect to Cao, L., 2020, the implementation of coordinating the circular value chains with the help of data which is a circular economic strategy supports the preparation of products for recycling for reusing the data. If the Manly golf club uses the data of different players and collects detailed information related to the style of playing the golf, creates an effective plan for the different golf games. The purpose of implementing this strategy helps the golf club to understand the gameplay of the players and create potential golf courses for adding challenges and providing a high level of satisfaction to the players or the customer of the golf club. Through this process, the Manly golf club increased the profitability of the business and also met the satisfaction requirements of the customers or the players.
Rethink: The principle of rethink is applicable in this strategy for creating an effective golf course for the player and also understanding the playing style of the player. It adds up value to the product and makes it a potential product for best assignment help.
.png)
Figure 1: Coordinating the circular value chains
(Source: https://www.boardofinnovation.com/circular-economy-business-models)
- Overview of the Kim, 2019, this strategy of circular product design of circular economic strategy helps for the preparation of different products to recycle for reusing the killed information of the players and game field. At any rate, the Manly golf club effectively uses the potential data of the different players and also it collects detailed information related to the different levels of players then it will create a potential golf course for the players. The purpose of implementing this strategy helps the golf club to understand the gameplay of the players and create potential golf courses for adding challenges and providing a high level of satisfaction to the players or the customer of the golf club.
Reduce: The above strategy helps to increase the efficiency level of the golf club and also provides various resources to the players. Providing a higher value of a product to the players creates a high level of satisfaction rate for the customers.
.png)
Figure 2: Circular product design
(Source: https://www.boardofinnovation.com/circular-economy-business-models)
(ii) Weddings and functions
- Based on the analysis of the Kimanzi, M.K. and Gamede, 2020, the strategy of collection and reserve logistics of the circular economic strategy creates a potential environment and complementary services for the customers. With the help of this strategy, the different occasions and wedding functions can be effectively operated in the hotel of the Manly golf club. It is based on the life cycle of the product and the method of reselling. This process implements appropriately in the function section of the golf club which helps to increase the value of reputation and profitability of the golf club.
Repurpose The strategy is based on the method of re-selling which is the main purpose of the concept. The repurposing of the different products can be helpful for the golf club.
- With respect to Klopotan, I., Zoroja, J. and Meško, 2018, the application of the sorting and the pre-processing with the help of data which is a circular economic strategy supports the preparation of products to recycle for reusing the data. This process helps to optically use any alternative products and services during the wedding function and occasions for the creation of different products.
Recover: With the help of the above strategy, the golf club can effectively reuse the data for better purposes in the upcoming course of time. It will help the business of the golf club to increase in the upcoming course time.
Section 2
Question 1
According to the website, the selected export item is timber from the country Papua New Guinea which is standing in the low category of the complexities. It is one of the large Islands on the Norton side of Australia. The economic level of the country is underdeveloped
- In respect to Lamperti, F., Monasterolo, I. and Roventini, 2019, improvement can be done by creating valuable exporting relationships with other countries by exporting the timber and also the products which are made out of the timber. At the time of harvesting the timber, the scrap material and waste timber materials can be used to create potential artefacts which increase the profitability of the country. The scrap or the waste timber which is going to be thrown away now creates valuable artefacts which have a higher rate than the value of timber in respect to the art. On the other hand, the country needs to create relationships with developed countries for exporting the timbers and artefacts. For instance, if the buyer country of the timbers and artefacts of the country is the USA then the underdeveloped country Papua New Guinea can sell the timbers and artefacts at a high price. This process will be highly beneficial to the country and help to increase the rate of GDP and profitability at the same time.
- Based on the analysis of the Mian, A. and Sufi, 2018, to increase the profitability and improve the business quality of the underdeveloped country Papua New Guinea, the selected country origin for effective targeting market will be the developed countries such as the US and UK. The purpose behind selling the product to the US or the UK is due to the higher rate of currency and also the quality market segment. If the buyer country of the timbers and artefacts of the country is the USA or the UK then the underdeveloped country Papua New Guinea can sell the timbers and artefacts at a high price. This process will be highly beneficial to the country and help to increase the rate of GDP and profitability at the same time. Therefore, the country will get a high level of benefits and also the potential market segment which increases the profitability of the country decently.
- Based on the overview of the Pillay, S., Rajaram, R. and Ramnanun, 2020, the multilateral trade policy will be helpful for the country Papua New Guinea to maintain an agreement of commerce between the two countries by signing the treaties for the import and export of timber and artefacts made out of the timber materials. It will help the country to maintain a decent level of trade with developed countries which increases the profitability and helps the country to grow and develop in the coming course of time.
Section 3
Question 1
- According to the abstraction of the Rusydiana, A., Sanrego, Y. and Rahayu, 2021, after the investigation process, it is found that the business cycle of the Maldives is going towards a recession period. The forecasting range of the unemployment rate in the Maldives is going to be increased in the upcoming course of time which refers to the business cycle of recession. On the other hand, the macroeconomics level of the country is also going to decrease in the coming course of time due to safety and health reasons. The factor of safety and health reasons impact the entire business cycle of the country because the main occupation of the country is based on tourism which is going to be restricted in the upcoming course of time. The output level of revenue and GDP of the country is going to decrease due to the increasing unemployment rate in the country. It is also observed that the inflation rate of the country has been increasing for consecutive years which also impacts the profitability and the ability to generate revenue by tourism. Therefore, it is clear that the country is going forward into a recession period in the upcoming course of time.
Question 2
- According to the analysis of the Rusydiana, A.S., Sanrego, Y.D. and Pratomo, 2021, after evaluating the financial business cycle of the country, it is not the appropriate time to invest in the expansion of the operations of the hotel in the country because of the decision period in which the inflation did become higher than the normal level and also the rate of unemployment increased. If the value of unemployment rate increases it will create a flood of working employees in the hotel and after the decision period most of the working employees are going to leave the hotel which creates an operational gap in the business. It also negatively impacts the growth and development prospect of the hotel. Therefore, the four-season hotel in the Maldives does not need to increase the expansion of the operation factor of the business.
- With respect to the overview of the Vogel, H.A., 2019, if the four-season hotel appoints a new manager for operating the hospitality operation then it will be beneficial for the entire hotel. The hotel needs to understand the purpose and perspective behind hiring anywhere manager for the hospitality section. The hiding of a new hospitality section of the hotel is beneficial but on the other hand, the hiring of various workers will negatively impact the overall productivity and profitability of the hotel. Therefore, the hotel can hire a new manager for the hospital section but the hiding of new workers will create conflict in the financial activities and transactions of the hotel.
Section 4
Question 1
Based on the analysis of Lamperti, 2019, the central bank of the country needs to increase the current official interest rate because of the negative rate of the GDP and the inflation rate. The country to maintain years’ financial value concerning the GDP rate. Therefore, the country needs to increase the interest rate for combating the financial environment. The central bank of the country needs money in their account rather than into the account of the customer.
(a) If the central bank of the country increases the interest rate then the consumer spending will become less because the citizens of the country will deposit their money into the bank and through this, the central bank will be able to fluctuate the level of inflation in the country. On the other hand, the business investment will remain the same or slightly decrease due to the increase in the interest rate which is comparatively safer than an investment in any other business organisation. Therefore, it helps to maintain the level of inflation in the country.
(b) The rate of unemployment in the country will decrease due to the higher interest value which provides courage to the people for finding a job and depositing their salary into the bank account through which the rate of interest is higher compared to the current situation of the time.
(c) If the central bank of the country increases the interest rate then it motivates the citizens of the country to deposit their money into the bank and through this, the central bank will be able to fluctuate the level of inflation in the country. Similarly, if the rate of inflation in the country is managed then the purchasing and consumption power of the citizens of the country increases. As the purchasing and consumption power of the customer increases in the country, it will provide a sustainable and lower inflation rate for the country.
(d) As it is discussed in the above section if the rate of interest of the country increases then the value of the currency of the country will also increase. This factor is the impact of the rate of interest if the citizens of the country deposit their money into the bank accounts which helps the country to manage the value of the currency. The exchange rate of the currency will also increase due to the sound base of the company.
(e) If the value of the currency of the country increases then it also impacts the process of import and export of the country. As the value of the currency of the country increases then it will provide a positive impact on the exporting of the products and goods to the different countries. The increased rate of interest provides a circular during the time of export of the goods and services to the different countries. This process will positively impact the process of export in the country in the appropriate method.
Reference
.png)
Essay
Essay on Low Minimum Wage Assignment Sample
Question
Task: This Economics assignment's goal is to improve students' ability to construct arguments based on facts and organized reasoning, including ways for recognizing coherent group arguments that reach consensus.
The next step is to decide on the best course of action for both parties. That is, using comprehensive research and a minimum of six references from peer-reviewed journal articles, you must simulate what would be good arrangements that the affirmative and the negative teams are likely to propose. In an argumentative essay, your arguments must be organized. Be creative, engaging, and perceptive in how you present your message.
Answer
Introduction
As stated in the employment essay, the minimum wage in the employment sector refers to the least amount of compensation that businesses must give wage earners for the work they do during a specified time period and that cannot be reduced through an individual contract or collective agreement. Thus, the current employment essay tackles the issue of whether a low minimum wage increases employment using reasons that satisfy both the positive and negative elements and are supported by substantial data.
Framed argument from the affirmative side
Because employers with low minimum salaries will seek more labour in the competitive labour market and may be able to hire them for the necessary or required amount of money, low minimum wages increase employment. According to David Manning & Smith (2016) in their analysis of the employment scenario essay, businesses who have steady or low minimum wages have more opportunities to hire new employees since they have enough resources to provide them a living wage while also efficiently running their businesses. Low minimum salaries help businesses in labor-intensive industries, and they will see proportionately larger reductions in pay costs.
As a result, they will be able to expand their workforce without having to worry about paying higher labour costs. Furthermore, as shown by Dube, Lester, and Reich (2016), low minimum salaries make businesses more competitive than high minimum wages because higher wages drive up expenses that could force businesses out of business if they cannot afford the labour costs. Therefore, this becomes the main issue for businesses that compete on the global market since the higher minimum salary renders them less competitive than the lower minimum wage and forces the business to manufacture its goods in nations with inexpensive labour rather than its own. As a result, the unemployment rate declines, and the company tries to implement the low minimum wage approach.
According to Engbom & Moser (2018) in their employment essay, low minimum wage rates contribute to cost-push inflation because they force businesses to incur higher costs that are more likely to be passed on to clients. This is especially true if wage differentials are kept at a healthy level. As reputable businesses have the opportunity to hire them with an acceptable amount of legal salary because no one is deprived of their wage rights and improves their employment, the low minimum wage aids in the reduction of people working in the black market. By giving them secure employment and raising the income of the low wage groups, the low minimum wage helps the poor by giving them higher benefits. Thus, the low minimum wage benefits those who earn a second income because, if one member from each household is given the option to work for less than the legal minimum wage, they will be able to support their families and lift them out of poverty. Therefore, Harasztosi & Lindner (2019) believe that there are some benefits to low minimum salaries, which are covered in the following section of the employment essay.
• It affects jobs in the marketplace of international trade.
• It discourages the use of the illicit market by giving everyone access to legitimate jobs and wages.
• It enables any company in a given nation to pay employee wages and hire an increasing number of workers.
• As a result, prices dropped as the firm passed on stable or declining wages. Additionally, regional wage balances contribute to higher first-line effectiveness and productivity on the global market.
Can you provide a framed argument from the negative side in regards to the case scenario of employment essay?
According to Lindner, Zipperer, Dube, and Doruk (2019), a higher minimum wage has a greater impact on reducing unemployment than a lower minimum wage because it encourages workers to work more and earn more money in order to live luxurious lives and escape poverty. Consequently, the increased minimum wage has the following benefits:
Reduction of poverty: The lowest-paid worker's income is increased by raising the minimum wage to higher rates, which helps this worker achieve a stable income status and lessen relative poverty.
Increased productivity: According to the principle of efficiency pay, higher minimum wage rates encourage workers to put in more effort, which in turn boosts labour output (Meer & West, 2016). Thus, it is made clear in the employment essay that if businesses must pay their workers more wages, they may focus more on raising labour productivity, which boosts the effectiveness of the nation's economy.
Increases the incentive and job acceptance: With greater minimum wages come significant variations in the quality of benefits and take-home pay. The high minimum wage encourages participation because the benefits and facilities at work are better and more valuable.
Increase in investment: As labour costs rise, businesses will be more motivated to invest, which will also result in an increase in labour productivity. Long-term, the high minimum wage encourages more investment and higher labour productivity. Instead than only competing with the low minimum wage, that economy is founded on the high added value.
Knock-on impact of the minimum wages: The employment essay looked at Raissian & Bullinger's (2017) opinions on the knock-on effects of the minimum wages. They found that even though only 5% to 7% of workers are paid the minimum wage, this has an indirect impact on those workers' earnings who are paid more. In order to preserve the pay premium for the experienced and highly trained workers, the firms may need to raise the wages for those who are earning more than the minimum wage rates.
Counterbalance the impacts of the monopsony workers: If corporations have this power, they would employ far fewer people, which will drive down wages. As a result, the low minimum wages make it very difficult for labourers to work for the company. Therefore, the high minimum wage may benefit the amount of employment.
Conclusion
According to the evidence presented above in this essay on employment, it can be concluded that the low minimum salaries would contribute to the creation of jobs for people living in that country. The minimum wage helps the businesses incur the necessary funds to hire more and more workers, which helps to increase the employment level of the specific area and gives the worker the legal wage they deserve, as can be seen in the employment context essay above. Due to the population's benefits from employment in many industries and their ability to work hard to lower their families' poverty levels, this aids in reducing the level of poverty in the nation. While high minimum wages weaken businesses since they may run out of money to hire more and more staff while also needing to hire a lot of experienced personnel while forcing low-rated employees to depart from their positions because the company could not pay them.
Reference
.png)
Dissertation
Internet Use and Economic Development: Evidence and Policy Implications Assignment Sample
Introduction
In this dissertation, four different economic development outcomes from 202 nations are examined by our Economics assignment help during an eleven-year period, from 1996 to 2007, to determine the effects of Internet use on economic development. Panel data and panel data estimate methods are used. The main theory being examined is that rising Internet usage has a beneficial impact on the following development outcomes: GDP, exports, the growth of local equity markets, and overall welfare as assessed by the UN Human Development Index (HDI). However, depending on the country's income level, Internet use has different effects on economies. Compared to low- or high-income countries, the effect is probably more pronounced in middle-income countries. This may be partially attributed to the low adoption of the Internet in low-income nations and the declining marginal product of Internet use in developed nations.
Therefore, in order to construct the four samples of interest—the whole sample of all nations and samples for each income category—countries are grouped according to the World Bank's definition of income class. To investigate the effects of extra Internet use at various developmental stages, the effectiveness of Internet use is assessed on each sample, and the findings are compared. A production function framework with Internet usage as an additional input will be used for the econometric analysis.
As important a development in human history as the invention of the printing press may have been the rise and expansion of the Internet, a global network of computing resources. The way we communicate, conduct business, learn, and govern ourselves has been permanently altered by widespread and consistent access to the world's collective computer resources and Internet-enabled gadgets. The effects of the Internet on the economy are astounding. By lowering transaction and search costs and improving access to information about goods and services offered in domestic and global marketplaces, internet use improves market efficiency. Innovation is sparked by information access, which also makes it simpler to embrace new technology and boosts output.
There are numerous stories in the news about how technological advancements are altering how business is done in the developing countries. The evidence of the effects of Information and Communication Technologies (ICT) on economic growth abounds, and the possibilities seem limitless. From farmers in Kenya using cell phones for Internet access connecting with insurance agents to protect their crops (DAWN Media Group 2009), to Chinese Internet centers for remote villages (Fong 2009), to Indian fishermen using cell phones to locate markets with the greatest demand for their products (Jensen 2007), the examples of ICT's effects on economic growth are numerous.
As people and organizations use the Internet more frequently in developing economies' private and public sectors, this opens up potential for the development of new goods and services. In the end, more information availability leads to market transformation, where new markets may appear and current markets may change, enlarging their size, sphere of influence, and interacting with markets in other nations or regions. Internet access has the immense potential to revolutionize governance through information use, a prospect that plainly disturbs autocratic leaders because they promptly halt Internet access at times of popular disturbance, as was the case during the unrest in the Arab world in early 2011.
.png)
Figure 1 shows how quickly the Internet has expanded and become available to users all around the world in the past 15 years. Computers with network capabilities are now commonplace in offices, homes, and educational institutions all throughout the developed world. Almost every element of industrialised economies has been impacted by computers and the Internet. Similar to electrical electricity, municipal water, and public roads, Internet connectivity is increasingly seen by the populace in industrialised nations as a basic service. Internet access is widely available, dependable, and, for the most part, affordable. Both locals and visitors may anticipate being able to access the Internet on a regular basis, just like they do with power outlets, contemporary transportation options, and sanitary services.
If it is available at all, Internet connection in a substantial portion of the developing world is only found in densely populated areas. Only as improvements are made to the necessary electrical power and communication infrastructures is it becoming more generally available to connect to the global communication networks that permit Internet use in less developed countries (LDCs). It is difficult to connect to the Internet without restrictions without a wide range of electrical and communication resources. However, without access to this technology, the potential of the Internet to boost productivity and human welfare cannot be realised. The population's access to and affordability of computers and other devices with Internet capabilities is necessary for the Internet to have a materially positive impact on the economy.
In LDCs, political and social structures are frequently unstable, and incomes are insufficient to support the investment required to establish even the most fundamental reliable public utilities. Poor yet stable nations cannot maintain the infrastructure necessary to provide broad Internet access. In a developing nation, solid political and social structures, fundamental public utilities like the distribution of electricity, and educational resources are more basic requirements, while Internet use is a higher order need, according to psychologist Abraham Maslow (1943). Internet connectivity will not be a top priority, if it is even possible, in nations where the populace must prioritise basic survival owing to extreme poverty, a lack of or failure of public health institutions, an ongoing violent conflict, or generally unstable political systems.
The "One Laptop Per Child" initiative's underwhelming results in LDCs offer some anecdotal evidence of the inadequacy of technical solutions to produce replicable and significant benefits in nations lacking the requisite infrastructure and fundamental political, social, and economic institutions (Shaikh 2009). Of course, those who lack access to the Internet or who are illiterate will find little use in the information supplied there. This dissertation offers empirical proof that expanding access to and utilisation of the information and knowledge made available by Internet connectivity has a significant positive impact on development outcomes, and it shows how the size of this impact varies for economies at various stages of development.
In the literature on economic development, there is little empirical research on how Internet use affects development outcomes. The few studies that have been conducted on the topic have narrowly concentrated on either income growth or the productivity of a specific industry. However, economic development encompasses much more than just income growth rate. The goal of this dissertation is to empirically examine how using the Internet affects a variety of developmental outcomes. The literature is summarised in Section 2 along with a description of the research hole that this dissertation fills. There has not yet been a thorough empirical investigation of the potential productivity-enhancing effects of the global improvements in information dissemination that the Internet offers, particularly in LDCs.
In this research, I offer a straightforward theoretical framework for examining how Internet use affects economic growth. I then apply the model to a panel of data on numerous nations at various stages of development. ICT studies in the past have focused solely on growth effects, but development encompasses more than just GDP growth. By extending the scope of development outcomes evaluated, this study offers a more thorough understanding of how Internet use affects development.
Additionally, earlier research frequently makes use of dynamics-impervious cross-country regression approaches. I employ panel data and econometric estimators that can take into account dynamics and unexplained heterogeneity in this analysis. As a robustness test, I additionally estimate the models using mixture modelling methods. Studies already conducted on the effects of ICT on all countries or just one particular country presume linear responses. This is unlikely to be the case because, as was mentioned before, the ability to use and benefit from Internet use may vary according to the level of development. As a result, I divide the world into different income classes and take into account the effects on each class.
202 countries' worth of data from the World Bank, the International Telecommunication Union, and the United Nations are combined to create a rich data set for the econometric analysis using dynamic panel estimation techniques. These data cover the years 1996 to 2007 and come from a variety of sources. The analysis shows that in nations with sufficiently high income levels, Internet use has a considerable positive and possibly incidental impact on a number of development indicators. GDP, export revenues, and equity market capitalization per capita are the development outcomes taken into account in this research. A full examination of economic development must take this measure of economic production into account. Per capita GDP is maybe the most popular development outcome metric in the development literature.
Some significant studies on ICT and exports may be found in the literature on development and growth. To other development outcomes, there isn't much extension, though. By examining the connection between the Internet and exports using a model that accounts for dynamics, this dissertation expands on existing research. The comparison and assessment of the findings are presented in Chapter 5. A growing body of research on domestic financial markets and economic development has raised development financing as its main focus. This dissertation adds to that body of work by examining how Internet use affects domestic financial markets. It specifically looks into the connection between Internet usage and capitalization rates of domestic financial markets, which is undoubtedly a sign of how far along these markets are.
The United Nations Human Development Index (HDI) is used as a supplementary indicator of economic development in order to examine how Internet use affects a broader measure of societal well-being. The HDI is used in this study, as well as many others, as a stand-in for the population's overall wellbeing within a nation. Front-line healthcare professionals will have increased access to information, including innovative techniques and best practises, for handling urgent health crises as Internet connectivity becomes more widely available in developing nations. Internet usage can also improve academic results as indicated by literacy rates. The HDI index incorporates these elements, making it a unique proxy for overall wellbeing.
The empirical study tests the hypothesis by contrasting the outcomes of fitting various econometric models to each sample. In order to account for or adjust for endogeneity resulting from the potential simultaneity issue of jointly determined dependent and explanatory variables, dynamic panel data and finite mixture model estimate techniques are used. A case for the causal effects of Internet use on economic outcomes can be made by accounting for the potential endogeneity of the measure of Internet use.
The use of the Internet may have a favourable impact on economic outcomes via a variety of processes. By reducing the distances between people, businesses, and nations and increasing information flow, access to the Internet lowers the cost of transactions and transportation. The sharing of knowledge and ideas is essential for the advancement of technology. According to Granovetter (2005), social networks have a significant impact on economic outcomes, particularly when it comes to supporting innovation. Websites that offer social networking features, like Facebook, are one of the fastest-growing types of Internet communication. Access to the Internet has expanded information availability, which could improve institutions' efficiency and transparency, resulting in greater governance. As Acemoglu et al. (2001) have demonstrated, better institutions can have favourable economic results. Kalathil (2003) makes a compelling case for how Internet use might promote effective governance.
By lowering search and transaction costs, information exchange increases market efficiency, which in turn can enhance demand, domestic production, and trade opportunities since it connects buyers and sellers and therefore expands marketplaces. New markets and industries can be created using the internet and other information technology. Access to educational resources via the internet can result in the production of additional human capital and an increase in labour productivity. Similar to this, access to health care is being made possible for people who might not have had it otherwise thanks to online health information. Economic development outcomes can be stimulated and amplified by these kinds of effects in economies at all stages of development.
Studies emphasising the ability of growing Internet use to modify society are starting to appear more frequently in the literature. In order to access new markets, learn new skills through shared experiences, and create more robust supply chains, small rural farmers in Central America and India can use ICT, according to a detailed analysis provided by Parikh et al. (2007). Advanced ICT networks encourage Foreign Direct Investment (FDI), which enhances economic opportunities in nations of all development levels, as Reynolds et al. (2004) show.
Although the effects will probably be favourable at all income levels, they will probably vary based on the countries' economic classes. Before many of the positive effects of Internet accessibility can have a large impact on the economy, developing countries must have basic public infrastructure, such as energy distribution, sanitation, primary care, and education systems. It's possible that low-income nations lack the political and social institutions needed for their populace to truly benefit from Internet access. High- and middle-income nations have attained levels of economic stability (they are higher on the Maslow's hierarchy of needs applied to economies pyramid) and are able to draw investment in the communications infrastructure, which can help educational systems operate more effectively and result in a population with a higher level of literacy.
In the context of this investigation, investing in Internet use can be seen as a complement to both investments in physical capital and human capital, as it makes workers more efficient by giving them access to knowledge that improves their skills and more rapid ways to create, disseminate, and assimilate information. The evidence in this dissertation shows that Internet use has a favourable impact on economic growth and other development outcomes, even if it does not give a growth story per se.
This dissertation's main goal is to present empirical proof of the causal link between rising Internet usage and rising economic activity across a spectrum of development outcomes. I use the per capita GDP, exports, the size of domestic equity markets, and overall wellbeing as assessed by the HDI as development indicators in this dissertation. Domestic developing economies will change when more people and enterprises in those areas start accessing the Internet. The way people learn about goods and services through websites and email will change how things are produced and consumed. A greater flow of information about available jobs, production methods, and new goods will make resource allocation and human capital deployment more effective. Although there are many development outcomes, I concentrate on these four in part because of their close connection to human welfare and in part because data are readily available.
Domestic markets that are expanding and mature draw consumers from other nations, enhancing trade prospects. Domestic equities markets become increasingly accessible to international capital markets, expanding the breadth and depth of the market's offerings as more economic agents from the public and private sectors establish online presences. The efficient operation of financial markets depends on information flow, which is crucial for developing equity markets. The usage of the internet has perhaps improved information production and distribution more than the use of the phone and fax machine combined. The effects of financial market structure and maturity on international Internet diffusion are examined by Yartey (2008), who discovers a strong correlation. This line of inquiry will be expanded upon in this dissertation in order to examine the effects of rising Internet usage on the size of the domestic equities market.
This dissertation shows that not all countries experience the same marginal advantages from Internet use. It depends on the specific outcome being researched whether increasing Internet access and Internet users in the least developed nations has a substantial impact on all aspects of economic development. All of the study's examined metrics of economic activity show a significant increase in middle-income nations as the number of Internet users increases.
The findings indicate that although middle-income nations have strong positive and significant effects, low-income countries exhibit lower, less significant effects of increased Internet use on exports and market capitalization. Middle-income nations see a rise in per capita export earnings of 2.3% as a result of a 10% increase in Internet users, but low-income countries see no change (fail to reject the null hypothesis of no change). The results are significant in terms of per capita GDP. Grows in per capita GDP of 3.2% in middle-income nations and even higher 3.5% in low-income countries are statistically significant when Internet usage increases by 10%.
Since Internet use has different effects on economic development outcomes depending on the country's income level, the policy recommendations must likewise differ. In low-income nations, increased Internet use has a strong positive impact on both the HDI average and per capita GDP. In order to provide Internet access at a reasonable cost, policymakers should concentrate on cellular phone networks. Additionally, foreign direct investment can be used to build the infrastructure required for increased Internet deployment while promoting foreign aid for health and education initiatives.
The effects of increased Internet usage are especially noticeable in nations with middle-income status. All four indicators of economic development in these nations are positively and significantly impacted by rising Internet usage. This argues that middle-income country policymakers should concentrate on giving the service industry institutional and legal support so that mobile banking, insurance, and other Internet-enabled technical solutions can be given to the populace via the mobile Internet. Widespread Internet connectivity is necessary for developing exports and domestic financial markets in nations with economies that are only starting to function and expand.
The rest of this dissertation is divided into the following sections: In order to comprehend the significance of this dissertation, Chapter 2 surveys the literature of pertinent earlier works on economic development, ICT, and economic growth. While Chapter 4 analyses the data sources and details the variables used for the empirical analysis, Chapter 3 presents the broad theoretical model and empirical technique for this study. The econometric findings of each investigation are presented and discussed in Chapter 5, and a summary, policy repercussions, and prospective future research possibilities are explored in Chapter 6.
1. Literature Review
Although there is a wealth of literature on economic growth, academic academics are just now starting to pay more attention to the connection between economic development and ICT. Existing research only offers a narrow and fragmentary perspective on the contribution that Internet use makes to economic growth. The literature has largely ignored other facets of development in favour of concentrating on the connection between information use and income increase. By examining many processes via which Internet use can affect the well-being of nations at various stages of economic growth, this dissertation offers a far broader perspective on the relationship between Internet use and development. The current research that serves as the backdrop for this dissertation is discussed in this section of the dissertation.
A foundation for understanding the contributions made by this study can be found in the numerous significant publications on the relationship between telecommunications generally and economic growth. While there are few published comprehensive empirical analyses of the role that Internet use plays on economic development, this study adds to a body of knowledge on this topic. I quickly highlight a few research that look at the connections between various facets of development. The review is organised into sections that examine how ICT impacts growth, factor productivity, welfare, trade, and equity markets, among other economic consequences.
1.1 ICT, Development, and Economic Growth
The methodology used in this study is an extension of the ground breaking research of Papakek (1973), which used cross-country panel methodologies to isolate the effects of FDI, aid, and exports on economic growth. It is also comparable to Barro's landmark study from 1991, which found a positive relationship between human capital and political stability, which in turn promotes economic growth. Before the advent of the Internet, there are outstanding evaluations of the state of empirical cross-country growth research by Levine and Zervos (1993) and later Sachs and Warner (1997). ICT, the Internet, or information mechanisms are not examined in these research' analysis of growth determinants. According to the enlarged Solow model-based neo-classical growth theory, long-term growth is reliant on technical advancement and labour force growth (Grossman and Helpman 1994). By examining how Internet use affects various outcomes, including economic growth, as a gauge of technical advancement, this dissertation adds to the body of scholarship.
Studies have just started to look into how important institutions are to economic growth. Although Rodrik et al. (2004) and Acemoglu et al. (2001) concur that institutional quality is a crucial component in economic development; neither study takes technological aspects into account that can improve productivity, trade, and the development of human capital. It is crucial to take institutional quality into account since it explains why technical advancement varies between nations. This dissertation isolates the effects of Internet use on development outcomes while controlling for institutional quality and other variables. It's interesting to note that Audretsch and Keilbach (2007) introduce the concept of entrepreneurship capital, or "the capacity for economic agents to generate new firms," as a crucial component of economic growth in Germany and discover that ICT infrastructure is a sizable component of entrepreneurship capital.
While this dissertation examines the effects of new technology (particularly, Internet use) on development outcomes by using institutions as a control variable, the research discussed above all employ institutions to explain differences in technical advancement.
The challenges faced by the world's poor people are depicted in great depth by Banerjee and Duflo (2007). Technology-based solutions are frequently advocated as a tool to help low-income people find ways to raise their income and raise their standard of living. In low-income nations, Gulati (2008) argues that investing in ICT infrastructure for educational purposes may primarily help the already wealthy, and that there may be a greater immediate need for fundamental educational services. By concentrating on potential distributional issues, Gulati's opinion ignores the total welfare benefit that ICT access and Internet use bring to the population of developing countries. It can be challenging to envision how relief programmes that give people access to ICT and the Internet will be of immediate assistance to a population that is already battling to survive. Although the poorest people of a population might not immediately gain from ICT use, overall wellbeing is increased. Redistributive measures can be put in place once welfare is increased to aid the poor.
Rajan and Subramanian (2008) use dynamic panel data approaches to further explore the issue of how foreign assistance transfers affect economic growth and come to the conclusion that aid transfers have little impact on growth across a range of nations. They employ a range of measurement techniques to control for endogeneity. To counteract this, Mishra and Newhouse (2009) found that, as measured by a decline in newborn death rates, direct economic aid does have a significant impact on health outcomes. In nations with underdeveloped health care systems, expanding access to information through ICT and the Internet will probably have favourable effects on health outcomes that may directly and indirectly affect economic development. In neither of these cases, the use of technology is the type of Internet infrastructure in particular and ICT infrastructure in general. Although economic aid is not directly examined in this dissertation, it serves as a crucial control in the empirical analysis and is viewed as endogenous.
In the mid to late 1990s, the increased accessibility to computers and Information Technologies (IT) in general started to have a revolutionary impact on industrialised economies. In their non-empirical study, DePrince and Ford (1999) concentrate on the economic growth that has resulted from the rapidly developing Internet economy in the United States and draw the following conclusion: "The emergence of the Internet economy is a Schumpeterian event that may rival the introduction of printing, steam power, the telephone, and the assembly line as a growth enhancing innovation." Madon (2000) acknowledges that the Internet will have significant societal effects in underdeveloped nations and offers a conceptual framework for comprehending how the Internet and economic growth interact. In poor countries, he argues that there are "six important application areas of the Internet, namely economic productivity, health, education, poverty alleviation and empowerment, democracy, and sustainable development." I am not aware of any published research that empirically investigate how using the Internet affects any of these factors. I experimentally research a number of Madon's hypothesised Internet-related effects on economic development with an emphasis on low- and middle-income nations as separate classes. Therefore, this dissertation offers the most thorough empirical analysis of the connection between Internet use and development that has ever been conducted in a single study.
The impact of telecommunications infrastructure on economic growth in Organization for Economic Co-operation and Development (OECD) nations over a 20-year period is examined by Röller and Waverman (2001). They discover a significant causal effect of communications infrastructure on aggregate output after controlling for country fixed-effects and simultaneity. Despite the fact that this study concentrated on OECD nations, it's plausible that these effects exist in nations with various levels of development. In this study, I use government effectiveness as a proxy for institutional quality, which can affect the deployment of infrastructure.
Three distinct methods that ICT can increase economic output in developed economies are outlined by Jalava and Pohjola (2002). First, ICT products immediately boost production. Second, ICT capital is employed in the manufacture of different products. Third, the industries that produce ICTs themselves contribute goods and services. They show large productivity-enhancing effects of ICT in the United States in the 1990s using a macroeconomic growth accounting model, but weaker evidence in the other G7 nations. The effects are attributable to the US service sector's intense international competition. They don't try to look at the relationship in less developed nations.
Attempts to comprehend the slow economic growth rates in Africa and other low growth regions have been the focus of a lot of economic development study in the literature. The development literature hasn't typically focused on how ICT and the Internet might aid Africa's economic development. Even though the research of the effects of Internet use on developing economies is not primarily focused on Africa in this dissertation, the findings offer new information that can help in understanding the developing economies in Africa.
Ernst and Lundvall (1997) study whether new institutions may be required for developing countries to utilise cutting-edge IT solutions that may improve learning. Their stylized models are based on data from the United States and Japan. "For the majority of developing countries, the fundamental priority is to construct the essential institutions that provide incentives and externalities necessary for domestic learning," they propose understanding the impact of functioning institutions on economic growth in LDCs is made possible by significant studies like Acemoglu et al. (2001), Rodrik et al. (2004), and Banerjee and Duflo (2004). Using dynamic panel estimating approaches, Gyimah- Brempong (2000) discovers negative effects of corruption on growth in African nations during the 1990s. According to Kalathil (2003), having access to the Internet can aid in the formalisation of informal institutions and foster freedom in totalitarian regimes, which are frequently present in LDCs. It will be interesting to watch events in the Middle East and North Africa in 2011 to determine if the upheaval, sparked by communication over the Internet, results in more transparently operating institutions or if autocratic regimes just block Internet access to maintain power.
According to Decker and Lim (2008), political institutions play a key role in determining growth. These studies don't look into how communication affects institutions or how ICT influences income growth. The development and upkeep of efficient institutions depend heavily on the open flow of information. For instance, effective and responsible governance depends on both the open flow of information and transparency. Utilizing ICT and the Internet allows access to information that makes communication easier, and this information flow can only help institutions.
Czernich et al. (2009) examine the impact of broadband Internet infrastructure on economic growth in OECD nations in a recent study. They show the beneficial causal effects of more broadband Internet infrastructure in industrialised countries using a technology diffusion model and instrumental variable methodologies. Although there is no justification for limiting the application of this paradigm to just industrialised countries, the analysis is not extended to developing nations. The correlation between increased Internet bandwidth and economic growth in wealthy nations is highlighted by this result. The number of Internet users in poor nations might be viewed of as the sole indicator of ICT capacity. The direct impacts of increased Internet use on outcomes for development in underdeveloped nations are examined in this dissertation.
1.2 ICT, Internet, and Productivity
Numerous studies look into how ICT, IT investments, and information networks might increase productivity. Dedrick et al. (2003) give an extensive assessment of the literature encompassing fifty past firm and country level research on IT investment and draw the conclusion that IT investment significantly boosts economic growth and labour productivity. Other research have shown inconsistent results, notwithstanding Engel Brecht and Xayavong's (2006) conclusion that ICT does not definitely increase worker productivity in New Zealand. Using a stochastic-frontier production function estimation technique, Thompson and Garbacz (2007) discover that information networks, such as mobile and fixed-line telephones and the Internet, benefit both the "whole world" and some of the "poorest nations" by enhancing institutional functionality and business efficiency. In order to close the productivity and production gaps that exist between industrialised and developing countries, Stein Mueller (2001) draws the conclusion that investments in ICT may enable "leapfrogging" or "bypassing some of the processes of accumulation of human talents and fixed investment." The quick uptake and spread of cell phone networks to areas in developing nations with no history of fixed-line telephone infrastructure is one illustration of this leapfrogging. Ngwainmbi (2000) draws attention to the adjustments Africa must do in order to keep up with the technological advancements happening at the time of his study. Africa has to have access to energy resources and telecommunications infrastructure in order to compete in the global information industry. These studies, as well as numerous others, present evidence for the economic impacts of the Internet through casual observation, logic, and descriptive statistics. To better understand how the Internet affects economic development, this dissertation offers an empirical investigation utilising econometric techniques.
Goel and Hsieh (2002) argue that the Internet has the ability to increase competition and make markets more competitive by helping to eliminate information asymmetries, but they do not offer any empirical analysis to support their argument. Parikh et al. (2007) discuss how small-scale farmers might use a range of technical solutions to better integrate themselves into "global value chains," but they do so without offering any concrete evidence. Goyal (2010) demonstrates that when farmers are given access to information about market prices via Internet kiosks, rural soybean markets in India become more effective.
By enabling producers and consumers to interact and transact in novel ways, the availability of the internet can aid in the creation and expansion of markets. These studies offer convincing justifications for how and why access to ICT and the Internet might improve economic outcomes. The lack of micro level data in these investigations may be the cause of the absence of empirical proof. In order to remedy this vacuum in the literature, this dissertation uses aggregate country-level data to present empirical evidence of the effects of Internet use on economic development.
1.3 ICT, Internet, and Welfare
The body of knowledge about how ICT and the Internet affect societal well-being is growing. Both Crandall and Jackson (2001) and Prahalad and Hammond (2002) describe the large possibilities for commercial enterprises to profit from offering goods and services to rising markets in poor countries around the world, particularly by utilising ICT infrastructure. While it's possible that the poor areas of Chicago are not entirely comparable to developing nations, Masiet al(2003) findings that access to health information made the poor citizens of Chicago more powerful is an intriguing conclusion that might be equally applicable to LDCs. This dissertation makes an effort to investigate this link in the context of the developing world by looking at the effects of Internet use on several economic measurements and the UN HDI.
According to Jensen's fascinating and significant study from 2007, when Indian fishermen are given cell phones, price-dispersion in neighbourhood fish marketplaces is drastically decreased, improving both producer and consumer welfare. As a result, markets grow more effective as knowledge becomes more widely available. Using the internet is a useful way to spread information more widely. This is one of the ways that Internet use affects the state of the economy in developing nations.
ICT has a beneficial effect on advancing democracy and freedom of expression, according to Shirazi (2008), who examined eleven Middle Eastern nations. The widespread upheaval that occurred in North Africa and the Middle East in the early part of 2011 may be explained by the strong transformative power of populations connected through the Internet. Future research would be interesting in delving deeper into how institutions and corruption are affected by access to ICT.
Some researchers contend that ICT will have minimal effect on reducing poverty and promoting economic growth in LDCs using only reason and descriptive statistics. According to Kenny (2002), programmers shouldn't be used to create ubiquitous access to the Internet until it is made easier, less expensive, and literacy rates rise. His assertion that "LDCs appear ill-prepared to benefit from the potential that the Internet does present—they lack the physical and human resources, as well as the institutions required to leverage the e-economy" is reiterated (Kenny 2003). Kenny makes the claim that there is data showing that Internet use has little to no impact on the rate of income development in the lowest-income countries, but he does not conduct any actual research to support this claim. He contends that assisting with health, telephony, and literacy may benefit LDCs more than providing Internet access. In order to more fully explore these arguments, this dissertation extends them by examining the effects of the Internet using a thorough empirical study that isolates countries by income level.
Like Kenny indicates, Thompson and Garbacz (2007) show that expanding telecommunications networks improves organisational efficiency in nations of all economic development levels. More crucially, they clarify why the combination of institutional reform and growing information networks appears to help the poorest nations the most. This is probably a result of poor penetration, which raises the use of communications technology's marginal product. These findings support the study's central thesis, which holds that before the benefits of Internet accessibility can be realised, fundamental institutions and a strong social infrastructure must exist.
Chinn and Fairlie (2007) find that per capita income has a positive relationship with Internet use and raise the possibility of a simultaneity or reverse-causality issue with regard to income and Internet use by using "a technique of decomposing inter-group differences in a dependent variable into those due to different observable characteristics across groups." Neglecting this potential endogeneity will lead to skewed and contradictory empirical findings. This dissertation use dynamic panel data econometric methodologies and controls for the endogeneity concerns inherent in such cross-country empirical development research, whereas Chinn and Fairlie do not address the potential endogeneity problem. Chapter 5 provides a comprehensive description of the empirical findings.
Aker and Mbiti (2010) investigate the effects of increased mobile phone availability on the standard of living in Africa's low-income nations. They draw the conclusion that, despite not being an empirical study, the availability of mobile technology has the potential to advance economic development in sub-Saharan Africa. The potential advantages of expanding ICT accessibility to developing communities are explained by studies like this one, however they do not offer strong empirical support. This dissertation produces a thorough empirical examination where none now exists, so filling this gap in the literature.
1.4 Internet, Trade, and Investment
International trade, and more specifically exports, are one of the more well-developed fields of academic research on the economic effects of the Internet. Exports have a significant role in helping developing nations achieve rapid economic growth.
An analytical framework is provided by Feder (1982) for investigating the growth effects of exports on a cross-country panel of LDCs between 1964 and 1973. His findings imply that export-oriented policies help governments allocate resources more effectively and raise marginal factor productivity, which boosts economic growth in developing nations. Edwards (1998) examines the effects of economic openness (as determined by trade and policy indicators) on total factor productivity using a panel of 93 countries between 1960 and 1990. He discovers that economies with greater openness improve their production more quickly.
In a study concentrating on Canada and the United States, Zestos and Tao (2002) found causal correlations between the growth rates of exports and imports and the GDP of these two nations. This finding suggests that exports may be a substantial determinant of economic growth. Increased trade has been shown to significantly improve social welfare as evaluated by the UN HDI in a cross-country panel by Davies and Quinlivan (2006). It makes sense that Internet use would boost income growth through commerce if Internet use boosts trade.
Freund and Weinhold (2002) found that as Internet penetration rises in a nation, both import and export growth increase in the study of US trade in services. In particular, a 10% increase in Internet usage abroad is linked to a 1.7% rise in service exports to the US. In a later study on global trade (2004), they discover that having connection to the Internet—using Internet hosts8 as a proxy—helps to account for the expansion of trade. A 10 percentage point increase in the number of web hosts in a country causes around a 0.2 percentage point rise in export growth, according to this 2004 study's calculation of trade elasticity. They claim that using the Internet effectively eliminates transportation costs for services and reduces fixed costs. Both of these studies do not address potential endogeneity issues or focus on underdeveloped nations, thus they cannot draw any conclusions about causality. In this dissertation's empirical analysis of the effects of Internet use on exports, endogeneity is attempted to be controlled for utilising instrumental variables and dynamic panel estimating methods.
The study by Clarke and Wallsten (2006) aims to comprehend the extent to which the Internet encourages trade between industrialised and poor nations. Although they acknowledge that the direction of causality is ambiguous, their study reveals that having access to the Internet encourages exports from developing to developed nations. They provide a tool (a regulation dummy) for Internet users to account for this potential endogeneity, and they discover that their findings are unaffected by endogen zing Internet penetration. Using firm-level data from low- and middle-income nations in Europe and Central Asia, Clark's most recent work (2008) supports a causal connection between Internet use and exports and offers additional evidence of the high positive link.
To examine how FDI affects growth, Nair-Reichert and Weinhold (2001) used a panel of 24 developing nations using a mixed fixed and random effects estimate approach. They find evidence that growing FDI promotes growth in emerging nations, but the effects vary depending on the nation. This implies that research that presumes homogeneous effects could produce biassed results. This research investigates countries in sub-samples divided by socioeconomic level in order to examine the possibility of diverse effects on Internet use.
According to Choi (2003), there is substantial evidence that rising Internet usage encourages FDI inward. He argues that increased productivity as a result of Internet use makes the nation more alluring to foreign companies eager to invest. Choi makes no attempt to account for the possibility that FDI and Internet use could be determined concurrently or for the possibility that growing FDI could result in rising Internet use.
In their preliminary analysis of all nations from 1975 to 1998, Reynolds et al. (2004) found that information infrastructure is a significant driver of foreign direct investment. They employ the quantity of telephone lines as their infrastructure measure and apply a two-step residual estimator to try and account for endogeneity. Ko (2007) expands on this by utilising dynamic panel estimators and comes to the conclusion that rising Internet usage draws FDI when there are favourable network externalities in industrialised nations, such as reduced connectivity costs and new electronic markets. Negative network externalities like network congestion and rising Internet usage do not significantly boost FDI in developing nations. Ko's strategy of classifying nations into developed and developing samples is comparable to the strategy applied in this research. FDI is a key control variable in this dissertation's empirical investigation of how Internet use affects economic outcomes, even though the majority of research in the literature concentrate on the factors that influence FDI.
1.5 Internet and Equity Markets
The relationship between domestic capital markets and economic growth has been the focus of recent empirical research on equity markets in emerging nations. Levine and Zervos (1996) used cross-country panel methodologies to examine the impact of a market strength index on GDP growth and found indications of a positive association, but they were unable to establish a definitive causal link. In contrast, Arestis et al. (2001) used a vector auto-regression (VAR) framework to analyse five developed economies in order to investigate the connection between stock market development and economic growth. They discover that while stock markets may support global economic expansion, the banking sector has a higher overall impact. For the advanced economies under study, their findings imply that "bank-based financial systems may be more able to foster long-term growth than ones based on capital markets."
Bekaert et al. (2001) look into how the liberalisation of the financial sector affects the chances of economic growth in a sample of thirty emerging nations. According to their research, financial system liberalisation is linked to actual economic growth. These findings imply that there might be a connection between financial market size and economic outcomes, even if that was not the study's main aim. This dissertation investigates how Internet usage affects the size of the financial markets and makes the argument that the size of the capital markets is a sign of strengthening economic circumstances.
By defining financial globalisation as "the integration of a country's local financial system with worldwide financial markets and institutions," Schmukler (2004) expands on the concept. He argues that although financial globalisation might assist emerging nations, successful integration into the international financial system depends on robust institutions. The overall integration of developing nations into the global economy depends on their capital markets. This dissertation demonstrates how rising Internet usage can support the development of domestic equities markets, which in turn can support the acceleration of economic integration into the larger global economy.
Shirai (2004) examines the function of the domestic equities market and economic development in a thorough case study of China. He comes to the conclusion that China's market does not fulfil the requirements for supporting development because it falls short in three key areas: money raised from market issues is not used productively; state ownership is excessive overall; and questionable accounting practises render firm reports unreliable. This outcome might be a result of restrictions put in place by the Chinese government on the material that can be found online. Access to information is made possible via the Internet, and it is this open exchange of information that enables more effective resource and financial allocation.
Yartey (2008) finds that cross-country ICT diffusion is highly correlated with stock market development (measured by market capitalization to GDP) when investigating the factors influencing technology diffusion using a panel analytical technique. According to the report, ICT development funding is attracted to countries with substantial domestic market capitalizations from neighbouring ICT-enabled nations.
By demonstrating how rising Internet usage raises market capitalisation in developing nations, this dissertation offers fresh analyses to the literature. This could be attributed to the growing accessibility and transmission of information on domestic enterprises through Internet use, which piques the interest of foreign investors. Another mechanism might be the development of an appealing environment for new, tech-savvy enterprises that use domestic equity markets as a result of rising Internet usage.
1.6 Basis for this Dissertation
A foundation for understanding the contribution of this dissertation is provided by the research discussed in this succinct survey of the literature. These studies draw attention to the crucial connections between ICT, economic development, and economic growth that are made in this dissertation's investigation of Internet use and its effects on economic growth. This paper is the first comprehensive empirical investigation that offers a rich understanding of the causal relationship between Internet use and a diverse array of economic and welfare measures in developing countries, despite the fact that there are many academic studies exploring aspects of economic development and ICT.
2 Theoretical Framework and Estimation Methods
The two primary empirical techniques used to estimate the equations are presented in this chapter together with the theoretical framework that takes into account Internet use in a production functional form that can be used to investigate the relevant metrics of economic development. The theoretical framework is presented in the first section, and the estimating techniques are presented in the second.
2.1 Model Specification
Due to the ease of access, communication, and use of information offered by the internet, it has an impact on economic development. The efficient creation, improvement, and dissemination of information on the Internet has a variety of direct and indirect effects on economic development. Access to information can be used as a direct input to improve production decisions and labour and capital allocation. By lowering search and transaction costs and increasing export options, information can give businesses the chance to take advantage of economies of scale. The Internet offers a new mechanism for gathering and exchanging information that enables businesses to learn about new potential markets for finished goods and services, discover new inputs and production methods, and locate competitive prices for inputs that lead to more effective input ratios.
According to studies that have already been done, using the Internet to obtain more information increases both labour and capital productivity. Access to the Internet offers cutting-edge communication technologies like email and instant messaging that make the sharing of ideas easier. Knowledge is produced as a result of this information exchange, which is essential for technological advancement. Information therefore advances knowledge, which advances human capital.
I start with a country's production function, F, for an outcome Y, throughout period t, in a manner similar to the presentation in Barro and Salai-Martin (2004) that comes after Solow-Swan and Ramesy:
Yt = At · F (Kt, Lt, INETt, Xt) (1)
Yt is an economic outcome, At is total factor productivity (TFP), Kt is the capital stock, Lt is labour, INETt is the number of Internet users, and Xt is a vector of controls that might include a variety of elements, such as institutional policy initiatives. In this dissertation, I argue that Internet use, or INETt, has a favourable impact on the results of development.
∂Yt/∂INETt > 0. (2)
I model at as having both a deterministic and a stochastic component in accordance with what can be seen in the data. The stochastic component, ezt, produces random fluctuations around the trend growth path that are expected to follow an MA(1) process, whereas the deterministic component, egt, corresponds to an underlying trend with a constant rate of growth.
At = egtezt ; At > 0 (3)
where zt:
zt = ρzt−1 + t; t ∼ iid. (4)
As a result, egt+zt explain how technical advancements outside of the Internet behave.
This concept includes the consequences of both exogenous technological advancement and Internet use. Learning about new technology is made possible by having access to the internet. Additionally, having access to the Internet makes it easier for new technologies to be adopted and disseminated because it offers a variety of channels for discussing their training and uses, such as email, websites, online forums, and shared academic courseware.
ICT in general, and Internet use in particular, have been found to have a positive impact on economic production and factor productivity in nations at all levels of development to varied degrees, as can be observed from the earlier studies in the literature review. I build on this justification to investigate how Internet use affects a variety of outcomes related to economic growth.
Given that (1) lacks a clear functional form in economic theory, I take into account the widely-used Cobb-Douglas intensive (or per capita) type production function that takes into account the effects of Internet use, other technical advancements, and the vector of controls:
You'll see that this equation keeps a stochastic component and a trend component, gt component, zt. I model the trend and cyclical behavior as a time-invariant constant, α, plus the log of lagged realizations of the dependent variable, lnyt−1, and an iid stochastic shock, t:
gt + zt = gt + ρzt−1 + t = α + βlnyt−1 + t. (7)
Now substituting (7) into (6) and rearranging, I arrive at a log-linear model specifi- cation for an outcome yj, in country i, during time period t:
The major explanatory variable of interest in this generalised log-linear model specification is the number of Internet users in country I at time t, with coefficient. yjit is a specific per capita development outcome that is indexed by j, and inetit is now per capita Internet use. The lagged outcome variable lnyji, coefficient t1's is. Kit is the per-capita capital stock with coefficient, Xnit is one of the n row control vectors with coefficient, is the intercept, and it is a stochastic error term.
The variables in the vector X, which are defined for each equation, can change based on the specific development outcome being studied. The control variables are the same for three of the four models examined in this dissertation, though. This model employs log-linear models because the log transformation minimises the sensitivity of the resulting estimates to outliers and reduces the range of the data. Importantly, the log-log equation coefficients may be simply translated into elasticities, enabling direct comparison of the effects of Internet use on various outcomes of economic development.
In all of the estimation equations for each development outcome, the coefficient, on the measure of Internet users is of particular interest in this research because of its sign, magnitude, and statistical significance. In the presence of dynamics, the coefficient on the lag-dependent variable is anticipated to be positive, less than 1, and statistically significant. The elasticity of Internet use, will be non-negative with varying magnitudes and significance depending on the development outcome being researched and the specific sub-sample used, according to the study's premise.
he models used in the literature on economic development frequently use GDP as a function of the outcome under study. In this dissertation, I offer a general model specification that can be applied to empirical research on a variety of GDP-related economic development outcomes. As I view GDP as an economic development outcome measure that can be explained by the same controls as other measures, it is not included in this method as a control (for other outcomes). In fact, I think that this model's design might be helpful for investigating other development outcomes that I shall take into account in Chapter 6.
For the three per capita outcomes being examined here, the general log-linear estimating equation is:
lnyjit = α+βlnyji,t−1+γlinetit+δlcapit+ζ0laidit+ζ1secschit+ζ2lifexpit+ζ3instit+it. (9)
In this definition, lny is a logged per capita economic outcome that is indexed by j, linet is a measure of institutional quality, lcap is a natural log of per capita fixed capital formation, laid is a natural log of per capita net foreign aid, secsch is the length of secondary school in years, lifexp is a measure of life expectancy at birth, and laid is a natural log of per capita fixed capital formation. The variables chosen as controls are those that are frequently employed as proxies for the essential elements of economic development in growth and development empirics: fixed capital formation, foreign aid, education, health, and institutions. Since these models are estimating per capita results, there is no labour control.
Numerous empirical studies in the literature support the selection of control variables. At least since Pa- panek's ground breaking paper on the causes of economic development, controls for capital formation and aid have been in place (1973). Studies that include controls for human capital using educational attainment and health indices as proxies are common in the literature on economic growth. For instance, secondary education was taken into account in two important growth papers: Barro (1991) and Mankiw et al (1992). According to Sachs and Warner, life expectancy is a frequent proxy for health status (1997). Several significant articles have underlined the role of institutions in economic development, as was previously discussed in the literature review above, including Acemoglu et al. (2001), Rodrik et al. (2004), and Banerjee and Duflo (2004). Chapter 4 contains a detailed overview of the data sources and the particular control variables used.
The general model in (9) is followed by the log-linear model for logged per capita GDP, lgdp:
lgdpit = α+βlgdpi,t−1+γlinetit+δlcapit+ζ0laidit+ζ1secschit+ζ2lifexpit+ζ3instit+it
(10)
This approach differs somewhat from those frequently used in the literature for estimating the impact of ICT on exports. Typically, some measure of GDP is used as a control in empirical estimations of export growth. In this dissertation, I examine a variety of economic outcomes that are conditioned by the same variables as GDP. As a result, I apply the same model to estimate how using the Internet affects each of these metrics. Thus, the generic estimate equation (9) and the per capita GDP equation (10) above are both used in the log-linear model for per capita exports, lexp:
lexpit = α+βlexpi,t−1+γlinetit+δlcapit+ζ0laidit+ζ1secschit+ζ2lifexpit+ζ3instit+it
(11)
This expands on well-known models to investigate the impact of Internet use on exports.
The factors that influence capital markets in emerging nations have received scant empirical study. The majority of researches, as shown in the literature review, concentrate on financial markets as a predictor of economic growth rather than looking into the variables that influence financial market expansion. This dissertation introduces a novel idea: the size of domestic equities markets as an outcome of economic development. I contend that the same methodology that was used to examine other outcomes, like GDP and exports, may also be used to examine how the Internet affects market capitalization. The Capital Asset Pricing Model (CAPM) was expanded by the theory of arbitrage pricing in order to investigate the numerous factors that affect the pricing of individual stocks. By extending this notion and incorporating it into existing models, such as those used by Holzmann (1997), Perotti and van Oijen (2001), and Bekaert et al. (2001), I aim to investigate the effects of Internet use as a determinant of market capitalization, conditional on a number of economic development factors. As a result, the estimation equation for market capitalization per person, or lmcp, is represented similarly to the equations above:
lmcpit = α+βlmcpi,t−1+γlinetit+δlcapit+ζ0laidit+ζ1secschit+ζ2lifexpit+ζ3instit+it
(12)
I anticipate that the coefficients for fixed capital formation, education, health, and institutions will all be positive for all three of the aforementioned estimate models. Although there is still discussion over the impact of help on economic growth, I predict a negative correlation because underperforming nations receive more aid. One of the endogeneity issues covered in the section below on estimation methodology is this one. With the exception of low-income nations, I anticipate that the Internet use coefficient in all equations will be positive and statistically significant across all economic strata.
The UN Human Development Index (HDI) is a composite index that takes into account a number of welfare indicators, including GDP per capita, adult literacy rate, and life expectancy at birth (United Nations 2008). From 1980 to 2000, it was calculated every ten years, then starting in 2005, the UN started calculating the metric annually. In order to fill in the data for the sample's missing years, this dissertation added interpolated HDI values. The HDI cannot be represented in the same way as the other equations since it is a mix of several different development indices.
Due to the structure of the index and the timing of the measurement, the model for estimating the effects of Internet use on HDI takes a different form. Although the HID's underlying components clearly exhibit dynamism, the index has historically not been monitored annually or at set intervals; instead, the measurement period has changed during the course of the index's development. As a result, the lagged dependent variable is not used in this model. As per capita control measures may result in skewed estimates because we lack the necessary data to reliably assess variables in terms of per capita, the HDI equation is log-linear and the controls are not. Here, the terms "linetto" (total Internet users), "lcaptot" (total fixed capital formation), and "laidtot" (total overseas assistance) are all expressed in current US dollars. A control for the size of the labor force, labor, is introduced in place of the proxies for health and educational attainment since those are factors in the index.
hdiit = α + γlinettotit + δlcaptotit + ζ0laidtotit + ζ1llaborit + ζ2instit + it (13)
I anticipate that the coefficient on in the middle-income sample will be positive and significant, much like in the estimate equations for GDP, exports, and market size. While those for aid and labour are predicted to be negative, the elasticity for capital formation and institutional strength are predicted to be positive.
The model specifications employed in this dissertation are aesthetically pleasing on first glance since they incorporate key components from significant growth and development empirical investigations. The purpose of these specifications is to examine the causal relationships between Internet use and various metrics of economic development activities. They adopt, adapt, and extend the common standards. I offer a consistent empirical framework for assessing the variety of economic development outcomes reported in this dissertation and others that will be investigated in the future by merging the key components of the model specifications from across the growth and development literatures.
2.2 Estimation Methods
In these models, there are two possible sources of endogeneity. They are the endogeneity of economic assistance and the direction of causality of Internet use. As people with more disposable income become more sophisticated in their demands for goods and services and businesses modernise using increased profits, rising domestic production and productivity, as measured by the per capita GDP, can undoubtedly lead to an increase in Internet availability and use. Similar to this, low productivity (low GDP per capita) will lead to increased help. In order to identify a causal relationship between Internet use and economic development, estimate approaches that take endogeneity into account are required by these models' sources of endogeneity. By addressing these endogeneity issues as well as the presence of dynamics, which complicates the application of the standard panel estimators, this research adds to the earlier development and ICT literature.
For empirical economic analysis, estimation using Ordinary Least Squares (OLS) is the standard starting point. It can offer accurate initial estimates of the marginal effects of the variables being studied. The equations can be stacked, and pooled ordinary least-squares can be used to estimate this model specification with ease. If the conditional mean is accurately specified, the errors are independent and identically distributed, and there is no multicollinearity in the regresses, OLS estimation can identify the parameters of interest. However, OLS estimation is biased and inconsistent when endogeneity and dynamics are present—when there is a correlation between the error term and any of the regresses—which is likely to happen in cross-country panels when examining aggregated macroeconomic measures because some of these measures are probably determined simultaneously. The aforementioned equations are dynamic because they contain lag dependent variables and potentially endogenous control variables.
Because the lagged realisation of the dependent variable is linked with the nation fixed-effects, using OLS to estimate (9) will result in issues. Both the lagged realisation and the country effect will be impacted by a shock to a country in the prior period. This goes against an OLS presumption. In the social science literature, temporally demeaning the data and then estimating the model on the time-demeaned data using OLS is a typical method for solving this problem. This method is known as a fixed-effects (FE) estimator. Since yit is correlated with it, the error term in the FE regression model, (it I will also be correlated with the response variable, (yit-yi), which is the same issue as with the OLS estimation. Fixed-effects estimates for each of the models are presented for comparison even though they do not solve the endogeneity issue.
More sophisticated econometric methods are required to account for the endogeneity contained in the model. Two more estimating techniques are applied in the empirical study in this dissertation using equations derived from (8). The first addresses Internet use and helps endogeneity and dynamism of the response variable by using Dynamic Panel Data estimation, the most common cross-country panel data estimate technique utilised in the literature. The second method examines the response variables as draws from a distribution made up of groups of unique continuous distributions of subpopulations using Finite Mixture Model estimation.
2.2.1 Dynamic Panel Data (DPD) Estimation
When dynamics and endogeneity are present, the Dynamic Panel Data estimators—more specifically, the Dynamic Panel System and Difference General Method of Moments (GMM) estimators—are frequently employed in the literature to estimate models on cross-country data. According to Bandyopadhyay et al., there are three reasons why these estimators are favoured (2011). The first step is to incorporate the long-lasting effects of Internet use into a dynamic framework. Second, there are significant endogeneity issues with regard to Internet use, financial help, and the metrics of development outcomes being taken into account. Two-stage least squares methods cannot be used without clearly defined and understood instrumental variables. Third, it's critical to account for unobserved national heterogeneity that can be linked to the outcomes of the study.
If we refer back to the general autoregressive model mentioned in equation (8) from Cameron and Trivedi (2005):
yit = α + βyi,t−1 + γlinetit + δkit + ζnXnit + it (14)
n
where the error term it is composed of ηi, representing time-invariant country specific e?ects, and uit, an idiosyncratic error that varies across countries and time periods:
it = ηi + uit (15)
with:
E[ηi] = E[it] = E[ηiuit] = 0 (16)
then the autoregressive model can be specified:
yit = α + βyi,t−1 + γlinetit + δkit + ζnXnit + ηi + uit. (17) n
The fixed effects (FE) and random effects (RE) models are the two frameworks that are utilized to account for i. While random effects, or between, estimation implies that I is a country-specific disturbance in each time period, fixed effects, or within, estimation assumes that I is a country-specific constant in the regression model. While the random effects approach implies that I is uncorrelated with X at all times, the fixed effects approach presupposes correlation between the unobserved heterogeneity and the regressors in X. When all explanatory variables are strictly exogenous, which is not the case in this situation; these panel estimating procedures produce estimates that are consistent.
It is necessary to use an estimator that generates reliable results even when dynamics and endogeneity are present. Dynamic GMM panel estimation methods that make use of the linear moment limitations implied by the aforementioned dynamic panel estimation equation have been introduced and extended by Arellano and Bond (1991), Arellano and Bover (1995), and Blundell and Bond (1998). Lagged differences of the dependent variables, endogenous regressors, and current values of strictly exogenous regressors are used as instruments in the DPD, an instrumental variable GMM estimator.
Since it can amplify gaps in unbalanced panels, the system DPD GMM estimator is preferable in this application over the difference estimator. This serves as the inspiration for the forward orthogonal deviations transformation (used in the estimation of the models in this dissertation), which "subtracts the average of all future accessible observations of a variable instead of the prior observation from the contemporaneous one. It is computable for all observations except the last for each individual, regardless of the number of gaps, minimizing data loss (Roodman 2006). In the presence of non-spherical errors, the two-step estimator is recommended over the less effective one-step estimator, and I choose the two-step form because I believe models with endogenous regresses and dynamics will have non-spherical errors.
The robustness of the obtained estimates is assessed using the common DPD statistical tests of over identification limits and serial correlation of the errors terms. Following the regression findings for each model in the appendices are tables with the test statistics.
2.2.2 Finite Mixture Model (FMM) Estimation
According to the World Bank's classification of countries by income, there are three distinct categories of development that can be identified: low, middle, and high income. In this dissertation, I make the assumption that Internet use affects countries differently depending on their level of economic development. This suggests that there may be some uniformity within each of the three distinct income classes that would enable a separate analysis of each income class. This estimate problem is ideally suited to use Finite Mixture Model (FMM) techniques since it is assumed that the distribution of outcomes under consideration is distributed into a finite number of reasonably homogeneous classes.
The FMM estimation technique assumes that the variable of interest is derived from a distribution that is made up of an additive mixture of distributions from several sub-populations or classes in order to model unobserved heterogeneity. FMM estimate is employed in various economic applications even if it is not yet widely used in development literature. In that it offers an alternative method of modeling heterogeneity, mixture modeling is appealing.
FMM estimation is used by Owen et al. (2009) to investigate the issue of country growth rates. They examine a number of latent class predictors, including models with two to five different classes and measures of latitude, settler mortality, and country landlocked status. They discover that, among the variables considered, institutional quality is the best predictor, and that a two-class model best fits the data. They come to the conclusion that country growth rate heterogeneity is ignored by single class pooled analysis. I propose that, contrary to their strategy, the latent class membership is determined by one's degree of income.
The identification of the precise, perhaps latent classes can be challenging without some natural interpretation, Cameron and Trivedi (2005) indicate, despite the fact that I have assumed a finite number of classes that account for country het- erogeneity. The latent classes have a theoretical foundation because they directly match to the World Bank country income classifications. This is because I am assuming that the effects of Internet use on economic development outcomes differ depending on the income level of the country.
The FMM estimate approach may model the various elasticity between income class even though it does not directly address endogeneity and dynamics issues. It models a different distribution for each class. Low, medium, and high income component densities are each represented by proportions c, where:
A probabilistic mixture of the densities from the three income classifications can be used to generalize the densities of the economic metrics in this study (or components.) This is represented by the equation below:
g (y | Θ) = π1g1 (y | Θ1)+ π2g2 (y | Θ2)+ π3g3 (y | Θ3) (20)
where gc (y | c) is the individual class density of the variable y given the parameter vector c and c is the percentage of the mixture density as defined previously. The following equation, where the mean of the distribution for the income class is discovered using equation (8), can be used to explain each distinct class density since each one is normal by construction:
This equation is not explicitly estimated; rather, the parameters for the means of the various class distributions used for mixing are provided by the linear estimation equations deriving from (8). The standard deviations, c, the regression coefficients, and the mixing probabilities can all change for each class when using this estimate method. Based on the income classification of each country, the model is estimated using maximal maximum likelihood estimation with set mixing probabilities.
The elasticity (or marginal effects), which are calculated at the means of the covariates indicated in the models, are then determined after the models have been estimated. Similar to how the coefficient estimates from the OLS and DPD estimators are interpreted, these values. As I anticipate finding a comparable sign, magnitude, and significance for the elasticity on Internet use regardless of the estimation method, using FMM to estimate each of the models provides a robustness check to the model parameters.
3 Data Sources and Panel Construction
A variety of socioeconomic variables are needed in order to conduct an empirical examination of the effects of Internet use on global economic development. To conduct this inquiry, data on Internet usage, macroeconomic indicators, institutional effectiveness of the government, and population health status are all required. The panel utilized in the empirical analysis had to be constructed from a variety of data sources.
This study focuses on the period from 1996 to 2007, which saw a dramatic increase in global Internet usage. There are two major reasons why this time frame was chosen. First, due to the low penetration rate of the Internet outside of a few wealthy nations, data on Internet use in general, and on low and medium income countries particularly, prior to 1996 are not generally available. Second, as of the date of writing, the data sources that are currently available only provide information on Internet usage for a wide number of nations as of 2007. Although there are some observations for 2008 and 2009 in the data used, most countries' data coverage is incomplete. Therefore, observations made after 2007 are not included in the economic projections.
The number of Internet users in a nation is the primary explanatory variable of interest for this study. The metrics for GDP, exports, assistance, and fixed capital creation are all expressed in current US dollars. All four of these variables are normalized by the population to obtain the per capita measurements. The life expectancy at birth in years serves as a proxy for health, while the number of years spent in secondary school serves as a proxy for educational achievement. Both the Institutional Quality Index and the HDI are indices that are used to assess the general wellbeing and quality of institutions, respectively. In the sections that follow, each variable and the specific data sets it was obtained from will be examined in detail.
The quality of the data available determines the robustness of any empirical research, and this study is no exception. Aggregated country level statistics are present in all the data sources used in this inquiry. Data that has been combined for each nation and year is relevant because this study examines phenomena at the aggregate country level. Undoubtedly, there is measurement error in these data, but since they are the main sources for cross-country panel studies in the economic literature, we rely on the supposition that the errors are random and not systemic and do not, thus, add bias into the samples.
In order to offer the macroeconomic measures required for this study, four primary data sources were chosen. The panel that results from fusing these data sources includes details on 202 nations and observations on economic, sociological, governance, communications, and health characteristics for the years 1996 to 2007. The identification, description, and examples of use in the literature for the variables used in this investigation are provided in Table 1. Appendix B contains descriptive data for both the complete sample and the low- and middle-income sub-samples. In Appendix C, you'll find histograms of the major metrics applied in this investigation. The four datasets used in this dissertation's analysis are briefly described in the sections that follow, along with the variables that were taken from each.
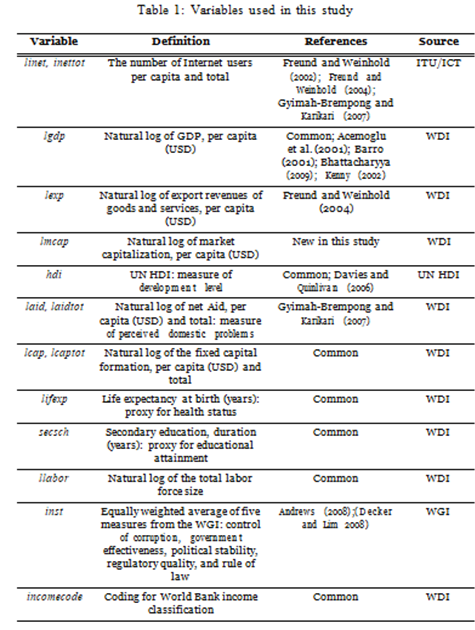
3.1 International Telecommunications Union: ICT Indicators
One of the most complete sources of statistics on telecommunications is the 2008 International Telecommunications Union World Telecommunication ICT Indicator (ITU/ICT). This database offers comprehensive global information and communication technology indicators. The International Telephony Union (2008) states that "the data are gathered by an annual questionnaire submitted to official country contacts, typically the regulatory authority or the ministry in charge of telecommunication and ICT."
The number of Internet users in a nation, the primary explanatory variable of interest for this study, is taken from this data collection. The number of Internet users per capita (or the percentage of the population having Internet access) gives the level of detail required for this inquiry, even if other measures are also employed in the literature to comprehend the implications of the Internet's rapid growth.
3.2 World Bank: World Development Indicators
The World Bank World Development Indicators (WDI) 2009 (World Bank 2009) was chosen to provide the comprehensive measures of economic activity covering hundreds of development indicators on 208 countries covering the years of interest: 1996-2007. It is the leading data source for empirical development economic investigation. The macroeconomic variables and income groupings for the 202 nations utilized in this analysis are provided by this data set. Due to insufficient information or uncertainty surrounding their classification as independent nations, the following six nations—Hong Kong, Macao, Puerto Rico, the US Virgin Islands, American Samoa, and West Bank and Gaza—were removed from the WDI data collection.
This data set is where the majority of the economic metrics used in the study were found. A thorough investigation into the effects of Internet use can be done using a variety of measures of economic activity, such as GDP, export value, and domestic equity market capitalization. As controls, a number of the data set's measurements are used. Net foreign aid offers a way to counteract outside economic impacts. Fixed capital formation is used to account for domestic investment. To reduce the potential skewing effect of very big countries, all of these indicators are normalized by population size to provide per capita measures.
Every financial indicator is expressed in dollars of the current year. The local currency is converted into US dollars using current year exchange rates. The World Bank's national accounts data are the source of the GDP, exports, and fixed capital creation metrics. Information from the Organization for Economic Cooperation and Development (OECD) is used to calculate net official aid amounts. Statistics on market capitalization are sourced from Standard & Poor's.
I utilize the life expectancy at birth expressed in years to account for health status in the investigated nations. This metric is based on population data from the United Nations. The length of secondary schooling in a nation, which is also measured in years, serves as a proxy for educational achievement (or grade levels.) Data from the Institute for Statistics of the United Nations Educational, Scientific, and Cultural Organization (UNESCO) are used by the World Bank to measure educational outcomes. Two often used indicators of health and education in the development literature are life expectancy and the number of years spent in secondary school.
In order to isolate the effects of the Internet on nations at various stages of development, the sample was stratified using the World Bank's classification of income for each nation. Three income levels are used to categories nations, with upper and lower income levels being subdivided into high and medium.
The World Bank Atlas method21 was used to determine the 2009 Gross National Income per capita for each economy. Low income is defined as $995 or less; lower middle income is defined as $996 to $3,945; upper middle income is defined as $3,946 to $12195; and high income is defined as $12196 or more (2009).
These income categories were used to construct three sub-samples for this study: low, middle (consisting of lower and upper middle income), and high income.
3.3 World Bank: Worldwide Governance Indicators
The World Bank Worldwide Governance Indicators (WGI) compile aggregated data on 212 countries between 1996 and 2007 on six aspects of governance: voice and accountability, political stability and lack of violence, government effectiveness, regulatory quality, rule of law, and corruption control. These aggregate indicators, according to Kaufmann et al. (2009), are weighted averages of the underlying data, with the weights representing the accuracy of the various data sources.
In line with Decker and Lim (2008), this study substitutes the maturity and stability of governmental institutions with an equally weighted average of five WGI components. The Voice and Accountability metric, which may be a better proxy for democratic representation in government than the strength of national institutions, is the component left out of the weighted average.
The body of empirical evidence in the literature makes it abundantly evident that effective governmental institutions are essential for economic development in emerging nations. A government needs functioning institutions in order to offer ICT infrastructure and make Internet access available to its citizens. The created index serves as a gauge of institutional efficiency and a crucial check for the empirical studies.
3.4 United Nations: Human Development Index
The Human Development Index (HDI), produced by the United Nations Development Programme in 1995, 2000, and 2003–2007 and released in 2008, is a composite indicator of income, education, and literacy for 176 countries.
The HDI, or human development index, analyses a nation's average performance in three fundamental areas of human development: health, knowledge, and a respectable quality of life. A person's level of knowledge is determined by their life expectancy at birth, adult literacy rate, and combined primary, secondary, and tertiary gross enrollment ratio, while their standard of living is determined by their GDP per capita (PPP USD) (United Nations 2008).
In order to assess the broadest measure of economic progress and population well-being, the UN HDI is employed.
The sample size is greatly decreased when utilizing the UN HDI as a response variable because it is not calculated annually. Cubic spline interpolation techniques are utilized to fill in the missing observations for years where the UN did not compute HDI values in order to increase the number of observations available for the empirical study. Both the original indices and the extended measures following interpolation and extrapolation are covered in the descriptive statics supplied in Appendix B.
3.5 Panel Construction
Variables from all four of the aforementioned data sets are present in the panel that was developed for the empirical inquiry in this dissertation. In order to enable merging, each country observation in each data set is given a consistent number value based on the UN country name and the three-character World Bank country code identification. Prior to panel building, each individual panel is first processed to remove unnecessary variables, fix formatting issues, and set the shared numerical country identifiers.
Very minimal processing is necessary to prepare the two World Bank data sets for incorporation into the panel. Prior to the integration, region identifiers that are missing for some nations in the WDI database must be added.
Both the UN WDI and ITU ICT databases need to be redesigned before merging. Reshaping is the process of rearranging panel data so that all variables for a given subject are contained in a single observation rather than in a lengthy format, where variable entries are distinct observations. Wide panels are typically used for panel econometric analysis, as they are in this study. A custom Python script was used to reshape the data by reading comma-delimited files containing information from the relevant sources, compiling and rearranging the data, and producing new comma-delimited files suitable for econometric analysis.
The indicator variables for area and country income levels were produced after the four main data sets were combined. The logged per capita values of the relevant variables were then generated.
3.6 Variables and Sample Stratification
With the countries stratified by income level, all estimations are performed on both the whole sample and reduced samples. The countries are divided into high, medium, and low income groups based on the 2007 World Bank income level. This coding is reflected by the introduction of a variable income code. I employ the three main categories, High, Medium, and Low Income, to identify the sub-samples for this study, despite the fact that the World Bank also defines five additional income sub-categories in addition to the three basic categories.
For the entire sample as well as each of the three sub-samples, each model is calculated. The coefficients from the regressions on each sample are then compared to the variable of interest, linet, which is the natural log of the number of Internet users per capita in a particular nation and year. In this study, log transformations are employed for a number of significant reasons. By using the observation logs, one can lower the sensitivity of the models to outliers and the data range. Additionally, elasticity can be inferred from the coefficients of the log converted approximated equations.
The availability of data poses a significant challenge, particularly for empirical assessments of developing nations. In the early years of the sample used for this study, this issue exists for several of the nations. Additionally, data on a few economic variables from various years within the study period is unavailable.
3.7 Summary Statistics
The whole data collection spans the years 1996 to 2007 and includes indicators for 202 nations. If all of the indicators were accessible for all nations and all years, there might be a maximum of 2,424 observations. With the exception of the market capitalization measure and the UN HDI, the majority of variables had decent coverage across the study period.
The summary statistics indicate that there are considerable differences in Internet use across the panel and sub-samples because the standard deviation is much higher than the mean. This is probably because Internet usage has changed quickly over time.
A list of the nations covered in this study is provided in Appendix A, arranged according to World Bank income categories. The three samples under investigation—the overall data set, the sub-sample of middle-income countries, and the sub-sample of low-income countries—are all summarised statistically in Appendix B. Histograms of the data distributions for the main variables of interest may be found in Appendix C.
4 Empirical Results
This dissertation's major goal is to examine how Internet use affects four different development outcomes: per capita GDP, exports, equity market size, and a composite index of human welfare, or UN HDI, as a stand-in. The data from the complete multi-country panel data set and three sub-samples based on income level (high, middle, and low) from the data set mentioned in Chapter 4 are presented in this chapter together with the empirical findings of estimating the four models indicated in Chapter 3 on them.
I covered the theoretical underpinnings of the empirical inquiry in Chapter 3 and demonstrated the presence of dynamics and endogeneity in the estimated equations that were provided. As a result, the DPD estimator is the most suitable because it can take into consideration these circumstances. The effects of Internet use on these outcomes may have error disturbances that vary depending on income class. In these circumstances, the FMM estimator offers an alternative method for assessing the effects of Internet usage by modeling the distribution of the outcomes as a combination of the component distributions and using the income classes as distributions. So as a robustness check, I estimate the equations using the FMM estimator. I've also included the outcomes of all equations' OLS and FE estimations for comparison's sake.
The presence of first order autocorrelation and the absence of second order autocorrelation in the error terms are critical conditions for the consistency of the DPD GMM estimator. For each estimated equation, the outcomes of the Arellano-Bond tests for first and second order autocorrelation in the errors are presented.
Lagged values of the endogenous variables as well as current and lagged values of the exogenous regressors are used as instruments in the differenced equation by the Arellano and Bond system GMM DPD estimator. The use of the Internet, assistance, and lifespan are all considered to be endogenous in all of the models that follow. All of the exogenous variables, as well as the lags of the endogenous and predetermined variables, are used as instruments in the DPD estimator.
The Sargan, Hansen, and Difference-in-Hansen tests are three examples of statistical tests that can be used to assess the validity of the instruments. The over identification limits are tested using both the Sargan and Hansen statistics, which serve as joint tests of model specification and instrument validity. The erogeneity of the instruments is examined using the Difference-in-Hansen statistics. The outcomes of these tests are presented for each DPD estimation in the table that follows the regression results in order to assess the model specifications in the estimated equations.
The estimated elasticity on Internet use are introduced for each of the four models shown below in a table with a column for each estimation technique: The OLS estimate is shown in column (1), followed by the FMM marginal effects estimate in column (2), the panel fixed effects (FE) estimate in column (3), and the DPD estimate in column (4). Under each coefficient, heteroskedasticity-robust standard errors are presented in parenthesis. Appendices D–G contains comprehensive tables of regression results and test data for each estimated equation for each model.
There are five sections in this chapter. The GDP equation is discussed in Section 5.1, the exports equation is presented and discussed in Section 5.2, the market size equations are presented and discussed in Section 5.3, and the HDI equation is discussed in Section 5.4. The statistical findings are compiled in the final subsection, 5.5.
4.1 GDP Per Capita (lgdp)
Estimates of the impact of Internet use on per capita GDP are provided in this subsection. A scatterplot of the correlation between log per capita GDP and log Internet use is shown in Figure 2. Table 2 shows, for the entire sample and for each of the three subsamples of low, middle, and high income countries using all four estimators, the elasticities of log per capita Internet use on log per capita GDP. Appendix D contains all of the regression test statistics as well as the complete regression results.
.png)
The model fits the data reasonably well, according to the DPD test statistics for the entire sample (Table D2). According to the Arellano-Bond tests, there is first-order autocorrelation present in the mistakes but not the necessary second-order autocorrelation. Valid instrument over identification limits are not ruled out by the Sargan or Hanson tests, and the Difference-in-Hansen measures do not rule out instrument erogeneity. These tests show that the model is recognised and the instruments selected are reliable.
Starting with the estimation on the entire sample, the coefficient on Internet use is positive and statistically significant for each estimation technique; as predicted, the only difference between the estimates is their absolute magnitude. The results consistently demonstrate that growing Internet use considerably has favourable effects on per capita GDP, regardless of the model estimation technique. The latter techniques, which account for country-specific effects, dynamics, and endogeneity, result in a larger rise in the elasticity on Internet use between the OLS and FMM estimators and the FE and DPD estimators. For instance, the absolute magnitude difference between the DPD estimate and the OLS estimate is 27%. Due to endogeneity, it is plausible that OLS is underestimating the effects of Internet use. According to estimates made using the DPD approach on the entire sample, a 10% increase in Internet users results in an average 3.2% rise in per capita GPD. This supports the fundamental thesis of this dissertation, which holds that rising Internet usage improves both overall development outcomes and GDP per capita in particular.
The coefficient on the lagged realisation of per capita GDP is positive and significant, demonstrating the presence of dynamics, as expected, as seen in the full regression findings of the DPD estimator shown in Table D1. Even though the elasticity of help is negligible and modest, it has a negative sign. The idea that aid does not contribute to economic progress as measured by per capita GDP may be poorly supported by this. Again as predicted, the coefficient for per capita fixed capital formation is positive and substantial. Secondary education has favourable effects, but it doesn't appear to have any impact on life expectancy (statistically indistinguish- able from zero.)
Surprisingly, the estimate of the effects of improving institutional quality, The elasticity is considerable and negative.
.png)
This may imply that offering high-quality schools has a direct cost that may be calculated as a drop in per capita GDP. It's also conceivable that more advanced institutions could result in lower revenue at less developed stages of development. Before increases in institutional quality result in revenue increases, nations might need to reach a certain institutional threshold. Present research is being done in this area.
I estimate the model with three extra control variables: time, income level, and an interaction term for time and income level taken together in order to separate the effects of Internet use from any temporal or income class effects. These findings are displayed in Table D1's column (5). We can observe that the model is tolerant of the inclusion of these controls because the coefficient on Internet usage is still appreciably positive. This lends more credence to my claim that there is a connection between Internet use and per capita GDP.
All of the coefficients on the model's variables have consistent signs and magnitudes, as shown by comparing the findings of the OLS, FMM, and FE estimates to the DPD estimates. Obviously, depending on the estimator, a particular coefficient's absolute value and importance will vary. This indicates that the model is resistant to the different estimating techniques.
There are quantitative differences even if all of the coefficient estimates for Internet use are qualitatively identical. The FMM estimation method appears to have captured the average marginal effect across all income levels because the results of the FMM closely resemble the OLS results across samples and in the middle-income estimates of the other estimators as well. Although the DPD estimator's estimates of elasticity tend to be bigger in size, they share the same sign, accuracy, and significance as those from the other estimators. The FE estimates' coefficients' signs likewise line up with those of the other estimations.
Depending on the level of development, Internet use may have different effects on income. So, using three subsamples of rich, middle, and low income nations, I estimate the equations. The output of these estimations is displayed in Table 2's panels (b) through (d). High-income country estimates are shown in panel (b), middle-income country estimates are shown in panel (c), and low-income country estimates are shown in panel (d).
I generate indicator variables for the high and middle income classes and interact these with the measure of Internet use to test the hypothesis that the effects of Internet use vary by income class. The high-income interaction term is found to be significant after I estimate the entire sample GDP equation with these interaction terms. This demonstrates that Internet effects differ depending on income level.
We observe varying degrees of the effect for each sub-sample when we examine the estimates of Internet use on the three sub-samples in Table 2 (the complete results are in Tables D3-D8). Contrary to the OLS and FE results, the magnitude of the Internet use coefficient in high-income nations is bigger than that in low- and middle-income countries, as would be expected, but it is not statistically significant. This may be partially attributable to the DPD estimator's shortcomings due to the DPD estimator's tiny sample size.
Surprisingly, increasing Internet use by 10% raises per capita GDP in low-income nations by 4.2% on average, a higher effect than the 3.2% rise in middle-income nations. This might be because Internet use is more prevalent in low-income nations, where there are labour and resource surpluses, but the information flow required to make efficient allocations is constrained. Using the Internet more frequently gives you access to information that can enable more effective allocations. The DPD estimates of Internet use on per capita GDP are compared in Figure 3 for each income class, with the statistically negligible high-income estimate shown as 0.
The results reported here are consistent with the expanding body of research on the advantages to economic growth from ICT and Internet deployment, even if there are no other empirical studies looking into the direct causal effects of Internet use on GDP at the time of writing. According to Röller and Waverman's (2001) research of telecommunication infrastructure in OECD nations, there is a causal relationship between the expansion of ICT infrastructure and the increase of total production here sented.
.png)
More intriguingly, according to Czernich et al. (2009)'s analysis of broadband Internet penetration in OECD nations, a 10% increase in broadband Internet access improves per capita GDP growth by 0.9% to 1.5% on average. The magnitude and importance of the effects of Internet use on per capita GDP show a positive effect, even though it is challenging to directly compare this estimate to those provided in this dissertation.
Overall, these findings provide a consistent picture of the benefits of increased Internet usage on per capita GDP, independent of the nation's income level. According to expectations, the amount of the effect varies by the country's income class. This firmly backs up the thesis statement for this dissertation. Chapter 6 presents assessments of the results' policy ramifications.
4.2 Per Capita Exports (lexportspc)
The estimated impacts of Internet use on real export income in US dollars are covered in this subsection. The scatter plot of the correlation between Internet usage and export revenue for the entire sample in 2007 is shown in Figure 4. The estimated elasticities of the log of per capita Internet use on the log of per capita export revenue, calculated using all four estima- tors, are shown in Table 3 for both the entire sample and each subsample. In Appendix E, the complete set of regression findings and regression test statistics are shown.
.png)
The Arellano-Bond tests for autocorrelation in the errors discover the sufficient first order autocorrelation and the necessary lack of second order autocorrelation in the error terms, according to a review of the DPD test statistics for the entire sample estimation shown in Table E2. The exogeniety and identification measures all show correct specification, according to the results of the Sargan, Hansen, and Difference-in-Hansen tests for instrument validity. These statistical tests indicate that the instruments and model are both reliable.
The results of the four estimation methods are all consistently positive for the effects of Internet use on per capita export revenues on the entire sample, as shown in Table 3. However, the majority of sub-sample estimates are typically non-significant whereas the whole sample estimates are typically significant. While the OLS estimates are comparatively smaller and unimportant, the FMM, FE, and DPD estimates have equal absolute magnitudes and importance. According to the elasticity derived using the DPD estimates for the entire sample, a 10% increase in Internet use is expected to result in an average rise in per capita export income of 2.2%. These findings support the dissertation's claim that growing Internet usage increases export earnings, however the magnitude of the effects varies depending on the economic development of a nation.
The complete regression findings for the entire sample are shown in Table E1 for all four estimators. As we can see, the coefficient on the lagged realisation of per capita exports is considerable and positive, supporting the notion that dynamics are at play. Aid has a negligible, tiny, and minimal elasticity. The life expectancy coefficient has an extremely small, negligible, and negative sign. Theoretically, there is no justification for anticipating a substantial elasticity on this control. As might be predicted, both the fixed capital formation and secondary education coefficients are positive and substantial. The coefficient on institutional quality is interestingly negative and substantial once more, adding support to the claim made in the preceding section about the expense of building institutions.
To separate the effects of Internet use from any specific time period, as in the GDP model
.png)
I estimate the model with three extra control variables: time, income level, and a term that acts as an interaction between time and income level. These findings are displayed in Table E1's column (5). Given that the Internet use coefficient remains substantial and positive, it is obvious that the model is resistant to the inclusion of these controls. The claim that there is a causal link between Internet use and per capita Exports is strengthened by this estimate.
In this dissertation, I propose that, depending on the level of development, the impact of Internet use on per capita export revenues varies. As a result, I estimate the equation on three subsamples of high, middle, and low income nations using all four estimators. In Table 3, the results are displayed in panels (b) through (d). High-income country estimates are shown in panel (b), middle-income country estimates are shown in panel (c), and low-income country estimates are shown in panel (d).
Returning to Table 3, we can see that the DPD estimates for how Internet use affects exports varies significantly depending on the income class. While the estimate in low-income nations is negative and virtually equal to zero, it is marginally greater in high-income countries than in middle-income countries. The test statistics do not offer the same level of confidence with the complete and middle-income samples, therefore the DPD estimates for both the high and low income sub-samples are rather shaky. To highlight the findings on the full and middle income samples, which are of key importance, the results from the OLS, FMM, and FE estimators provide sufficient context.
The most remarkable finding is that a 10% increase in Internet usage is linked to a (statistically significant) 2.5% rise in per capita export earnings in middle-income nations. The premise of this dissertation, that Internet use will have different effects on export performance of countries at different levels of development, is supported by these estimates. Figure 5 illustrates how increased Internet usage has a considerable impact on export performance in middle-income nations, but has little to no effect on exports from low- or high-income countries.
These dissertation's findings are in good agreement with earlier studies in the literature. Freund and Weinhold (2004) discovered a correlation between an increase in Internet hosts of 10% and an increase in total export revenue growth of 0.2%. Although direct comparisons between the estimations are challenging, both point to a direct positive relationship between rising Internet usage and exports. In a previous investigation, Freund and Weinhold (2002) discovered that a 10% increase in Internet usage abroad is connected to a 1.7% rise in service exports to the US. Once more, despite these estimates.
.png)
Cannot be directly compared, the results discovered in this dissertation complement and extend Freund and Weinhold’s earlier studies.
The findings in this dissertation build on earlier investigations of exports and Internet usage. For instance, a 2006 study by Clarke and Wallsten found that developing nations with higher Internet access penetration export more to developed nations, and a 2008 study by Clarke discovered a strong correlation between Internet access and exports at the firm level in Eastern Europe and Central Asia. While earlier works gave examples of specific instances when using the Internet had a favourable impact on exports, this dissertation analyses the topic more generally and draws similar results.
In conclusion, this dissertation shows evidence that, under equal circumstances, Internet use favourably increases export profits, although the effects vary depending on the economic development of the countries under consideration. According to income class, countries that have advanced from the low level base to the middle level of a Maslow-like developmental hierarchy exhibit convincing evidence of the beneficial effects of Internet use on export performance.
4.3 Market Capitalization Per Capita (lmktcappc)
.png)
The estimated effects of Internet usage on the size of domestic equities markets (market capitalization) are shown in this subsection in US dollars. The scatter plot showing the correlation between market capitalisation and Internet use for the entire sample in 2007 is shown in Figure 6. For the entire sample and each subsample using all four estimators, Table 4 shows the elasticities of log per capita export revenue in US dollars on log per capita GDP. Appendix F contains the complete regression results as well as the regression test statistics.
.png)
We find consistent positive and substantial elasticities for per capita Internet use on per capita market capitalization starting with the full sample estimates using all four estimation methodologies presented in Table 4. According to the DPD estimate based on the entire sample, a 10% increase in Internet usage is correlated with an average increase in per capita market value of 24%. The statistically insignificant estimate for low-income nations is shown as zero in Figure 7, which compares the DPD estimates for the three subsamples. This finding is consistent with the dissertation's premise that, for nations with middle- and high-income levels, Internet use has a significant impact on domestic equities markets' size as shown by market capitalization per capita.
The full regression results from the model estimation on the entire sample using all four estimators are shown in Table F1. No matter the estimation technique, the coefficient on the lagged realisation of per capita market capitalization is large and positive, indicating that dynamics are present as anticipated. Additionally, just like in the previous two models, the elasticity of Internet use is constantly positive and significant. The only variation is in magnitude. The positive (albeit insignificant) coefficient on aid may indicate that increased aid may contribute to the growth and expansion of local capital markets.
.png)
Life expectancy's elasticity as a health proxy is negligible and inconsequential. While secondary education is insignificant and typically positive, but weakly negative (and insignificant) in the DPD estimate, the estimates of the effects of capital production are positive but insignificant, presumably indicating reverse causality. The reduced sample size used in this study may have contributed to this conclusion. In estimators that do not account for endogeneity and dynamics, institutional quality effects are positive but not statistically significant. The DPD assessment reveals a negligibly small, unimportant effect.
By evaluating the model with three extra control variables—time, income level, and an interaction term for time and income level combined—I isolate the effects of Internet use from any temporal or income class effects, just like in the GDP and export models. These findings are displayed in Table F1's column (5). We can observe that the Internet use coefficient is still substantial and positive, indicating that the model is resilient to the inclusion of these extra covariates. This lends more evidence to my claim that there is a link between per-person market capitalization and Internet use.
I analyse the idea that the impact of Internet use on income varies depending on the level of development, much like in each of the models examined in this dissertation. I re-estimate the equations on three subsamples as a result. The output of these estimations is displayed in Table 4's panels (b) through (d). High-income country estimates are shown in panel (b), middle-income country estimates are shown in panel (c), and low-income country estimates are shown in panel (d).
Tables F3–F8 show the results for the three subsamples. All income classes and estimators show positive significant effects of increased Internet use on market capitalization, with the exception of the low-income country sample where the elasticity from the DPD estimator is statistically insignificant. This is compelling evidence of the correlation between domestic market size and Internet use, which varies across income strata.
It is evident that, for high and middle income nations, Internet use consistently has a considerable positive impact on stock market size, whereas these effects are negligible across estimators for low-income countries. Due to the very small sample sizes, the test statistics on the DPD estimates for the high and middle income samples do not consistently show that the model specification is correct. However, these estimates serve as comparison points together with the OLS, FMM, and FE estimations.
The literature on the factors that influence the growth of equities markets is not very well-researched. The majority of currently conducted research focuses on either the connection between capital markets and economic growth or the role that capital markets play in the spread of technology. According to the reported findings, financial markets and ICT in general (and the Internet in particular) are interconnected and both contribute to economic growth. However, this dissertation is the only one that has looked at the connection between rising Internet usage and the size of domestic equities markets as assessed by per capita market capitalization as of the time of publication.
The findings in this subsection support the claim that Internet use has a favourable impact on domestic market capitalisation in nations of all income levels, but that these effects are only truly noticeable in middle- and high-income countries. Chapter 6 contains the outcomes' political ramifications.
4.4 UN HDI (hdi)
The Human Development Index (HDI), a combined measure of education, literacy, and income published by the United Nations Development Programme, is used in this subsection to quantify the effects of Internet use on overall welfare. The scatterplot association between Internet usage and the HDI is represented graphically in Figure 8. The elasticities of Internet use on the HDI for the entire sample and for each subsample using all four estimators are shown in Table 5. Appendix G contains all of the regression test statistics as well as the complete regression results.
.png)
The fit is not excellent, according to the test statistics for the DPD estimations on the entire sample. Although the Sargan and Hansen tests both reject the legitimate overidentification limits, the Arellano-Bond test statistics find evidence of first order autocorrelation and the absence of send order autocorrelation, as required. The exogeniety of the instruments divides the Difference-in-Hansen tests. Nevertheless, all four estimators have marginally significant and positive coefficients on Internet use, which lends some credence to the thesis of this dissertation—that rising Internet use will lead to higher HDI measures of welfare.
The sample sizes are significantly reduced when the UN HDI is used as a response variable because it is not calculated annually. Cubic spline interpolation and linear extrapolation were used to produce estimates for the missing observations in order to increase the number of observations available for the empirical study.
.png)
Since there is insufficient data to adequately measure these covariates in terms of per capita, per capita control measures are not employed for this model, as explained in Chapter 3. Furthermore, because the index includes measures for these determinants, the proxies for health and educational attainment (life expectancy and time spent in secondary school) are not included as controls. Since the level measures utilised are not per capita measures, an additional control for labour force size is included.
Starting with the estimates of the four estimation methods for the impacts of Internet use on the HDI for the entire sample, Table 5, we observe consistent positive significant effects. According to the elasticity estimates made by the DPD estimator for the entire sample, a 10% increase in Internet use should, on average, result in a modest but considerable increase in the HDI. A visual comparison of the DPD estimations for each subsample is shown in Figure 9. These findings offer some support for the dissertation's central claim that rising Internet use improves overall welfare as indicated by the HDI.
.png)
The complete regression findings for the entire sample are shown in Table G1. Aid has a negative and substantial co-efficient. This offers more evidence in favour of the claim that help does not increase general welfare and presents a promising subject for future research. Both the coefficient on fixed capital formation and the estimate of labour force size are positive and substantial, as would be expected. We can observe from this model that the impacts of institutional quality on the HDI are often estimated to be positive and significant. This is an intriguing counterweight to the findings presented above about the variable influences of institutional quality on the results of economic progress.
By estimating the model with three extra control variables—time, income level, and an interaction term for time and income level combined—I once more isolate the effects of Internet use from any temporal or income class effects. These findings are displayed in Table G1's column (5). We can observe that the Internet use coefficient is still substantial and positive, indicating that the model is resilient to the inclusion of these extra covariates. This lends more evidence to my claim that there is a causal connection between Internet use and overall welfare as determined by the HDI.
The GDP model has shown that the income level coefficient is significant and negative (increasing income levels corresponds to decreasing income class.) This suggests that the HDI is affected by income class.
By estimating the equations on the three subsamples of high, middle, and low-income nations using all four estimate methods, I continue to investigate the possibility that the impact of Internet use on income varies depending on the level of development. In Table 2, panels (b) through (d) show the estimates for high-income, middle-income, and low-income nations, respectively. Panel (b) in Table 2 depicts the estimates for high-income, middle-income, and low-income countries.
Tables G3–G8 illustrate the findings of the estimates of Internet use on the HDI for each of the subsamples, and they consistently demonstrate minor, favourable, and significant effects. The estimated effects are almost the same for low- and middle-income countries, but they are greater for high-income countries. These findings provide more proof for the dissertation's conclusion—that using the Internet significantly boosts economic growth.
Since there are no published studies on the welfare effects of ICT and the Internet in poor nations, there are no empirical studies to compare the findings of this dissertation with. Nevertheless, other researches contend that an increase in Internet users has a positive impact on welfare.
Prahalad and Hammond (2002) and Crandall and Jackson (2001) both discuss how businesses may gain from the development of ICT infrastructure in developing nations. Technology can boost welfare even in underdeveloped locations, according to a Jensen study published in 2007 that examined the influence of cell phones on rural Indian fisherman. According to Thompson and Garbacz (2007), developing information networks are beneficial for underdeveloped nations. Although Aker and Mbiti's (2010) argument lacks empirical backing, they contend that expanding mobile phone connectivity in Africa's low-income nations has a significant potential to improve welfare.
My initial attempt to research the impact of Internet use on economic welfare is presented in this subsection. Although it is challenging to estimate models using aggregate measures on an index that is made up of aggregates, this investigation does succeed in supplying some additional evidence in support of this dissertation's hypothesis that increased Internet use has a positive impact on economic development.
4.5 Concluding Observations
The premise of this dissertation that increased Internet use has favourable effects on economic development as assessed by GDP, exports, market size, and the UN HDI, is supported by evidence across all of the models and estimation findings. When estimates are run on stratified groups of countries—high, middle, and low-income countries as separate subsamples—it is evident that the effects of more Internet users vary in absolute magnitude and significance across income classes. Results across the full sample of countries frequently show significant positive effects.
My initial thought was that more Internet users wouldn't have much of an impact on developing nations. A surprise outcome was produced by the model's results when it was applied to per capita GDP. The elasticity on the low-income sample was positive and slightly bigger, however the elasticity on the complete sample estimate closely matched the estimate for the middle-income sample as was expected. This unexpected finding implies that even in the least developed nations, increased Internet use affects per capita income.
The model's projections of per-capita export earnings confirmed my suspicions that middle-income countries would benefit most from increased Internet usage. Once more, the elasticity calculated for the entire sample was fairly close to the calculation for the middle-income sample. The elasticity of Internet use in low- and high-income countries was negligible, but it was considerable and positive in middle-income nations.
My only prediction for the effects of internet use on market size was that lower income countries would likely show no effect because newly created markets might not be integrated into the global financial system. However, there has been little research on the factors that determine the size of markets in developing countries. This was supported by the results, which showed that the elasticity in middle- and high-income countries was significantly positive whereas it was negligible in low-income countries. The estimate for middle-income nations was higher than the elasticity of Internet use in high-income countries. This may imply that as economies develop and wealth levels rise, more people will have access to the Internet and domestic financial markets, opening up new investment options.
Unexpected model estimations resulted from the investigation of Internet usage on the UN HDI. Although I have less faith in the model fit in this instance, the data suggest that there might be intriguing effects that call for more investigation. Similar to the other models, both the full sample's and the middle-income sample's estimates of elasticity were positive and statistically significant. My broad expectations for this inquiry were met by this.
Surprisingly, the low-income sample's estimated elasticity was positive and substantial. It is reassuring in a way that this conclusion is supported by the findings in the model outlined above regarding the effects of Internet use on GDP since the HDI is an aggregate measure that also accounts for per capita GDP. Additionally, given that the UN also takes life expectancy and literacy rates into account when calculating the HDI, possibly increased Internet usage will help low-income nations have better access to information about health and education. Future research in this area should be exciting.
An extensive framework for comprehending the effects of Internet use on economic development outcomes is provided by the results of these four models of Internet use on four different economic development outcomes, applied to the entire sample of countries and to each of the three subsamples stratified by income class.
It is challenging to deny the evidence showing the significant beneficial effects of more Internet users on all four economic outcomes for middle-income nations, as well as the evidence of the clear differences in the degree and significance of the effects depending on the income class. These findings support the research hypothesis of this dissertation, which holds that Internet use is a significant positive predictor of economic development. However, the magnitude of these effects varies by country's position along a Maslow-like hierarchy of economic development stratified by income level.
5 Policy Implications and Future Research
5.1 Dissertation Summary
The impact of Internet use on economic growth is examined in this dissertation. According to the hypothesis under consideration, growing Internet usage has a beneficial impact on a number of development outcomes, including per capita GDP, export income for products and services, the size of domestic equity markets as evaluated by the UN Human Development Index, and overall welfare. However, depending on the country's income level, Internet use has different effects on economies.
I take into account an economic hierarchy of demands (based on Maslow's famous work on human psychology) where Internet use will have a measurably different impact at each degree of development. It is unlikely that Internet would be accessible at the lowest level of development where the population struggles to survive because of extreme poverty, absent or failing public health institutions, on-going violent conflict, or generally unstable political systems. If it were, however, people could use it to better their circumstances.
Countries that have made some progress toward economic growth (and into the middle-income bracket) are more likely to have the infrastructure and operating institutions required to sustain extensive Internet use. In this group of nations, I anticipate finding the strongest effects of Internet usage on outcomes of economic development. In the most developed nations, the marginal impact of increased Internet usage might not have any discernible effects.
The World Bank World Development Indicators and World Governance Indicators (WGI), the International Telecommunications Union World Telecommunication ICT Indicators, and the United Nations Human Development Index were used to create a panel data set that was used to conduct this empirical investigation. Over the course of an eleven-year period, from 1996 to 2007, these data were gathered and merged to generate a panel of economic statistics on 202 countries. Four econometric methodologies (Ordinary Least Squares, Finite Mixture Modeling, and Dynamic Panel Data) are used to analyse each sample's effectiveness in utilising the Internet, and the findings are compared to examine the effects of increased Internet use at various developmental stages.
For each of the four economic outcomes—per capita GDP, per capita export revenue, per capita equity market capitalization, and UN HDI—the econometric study employs a production function framework with Inter-net use as an additional input. The main controls for this framework are sourced from the academic literature and include life expectancy at birth, secondary school attendance duration in years, per capita fixed capital formation, per capita net foreign aid, and a measure of institutional quality for the WGI. The variables chosen as controls are those that are frequently employed as proxies for the essential elements of economic development in growth and development empirics: fixed capital formation, foreign aid, education, health, and institutions. Since these models are estimating per capita results, there is no labour control.
For the four outcomes, four different econometric estimate methods are applied to each of the four samples. The baseline estimating method is Ordinary Least Squares (OLS), but in the presence of endogeneity and dynamics, this estimator will yield skewed and contradictory findings. As a result, estimators for Finite Mixture Modelling (FMM) and Dynamic Panel Data (DPD) are also utilised.
The FMM estimate approach may model the various elasticities between income classes even though it does not directly address endogeneity and dynamics issues. It models a different distribution for each class. When dynamics and endogeneity are present, the DPD General Method of Moments (GMM) estimators are frequently employed in the literature to estimate models using cross-country data. There are three advantages to using these estimators. The first step is to incorporate the long-lasting effects of Internet use into a dynamic framework. Second, there are significant endogeneity issues with regard to Internet use, financial help, and the metrics of development outcomes being taken into account. Two-stage least squares methods cannot be used without clearly defined and understood instrumental variables. Third, it's critical to account for unobserved national heterogeneity that can be linked to the outcomes of the study.
The premise of this dissertation that increased Internet use has favourable effects on economic development as assessed by GDP, exports, market size, and the UN HDI welfare index, is supported by evidence across all of the models and estimation findings. When estimates are run on stratified groups of countries - high, middle, and low income countries as separate subsamples - results across the full sample of countries frequently show significant positive effects, but the effects of additional Internet users vary in absolute magnitude and significance across income classes.
A startling finding emerged from the calculation of the impact of Internet use on per capita GDP. The elasticity on the low-income sample was positive and slightly bigger, however the elasticity on the complete sample estimate closely matched the estimate for the middle-income sample as was expected. This implies that even in the least developed nations, increased Internet use has a beneficial effect on per capita income. Future studies should look into the process by which this occurs.
The model's projections of per-capita export earnings confirmed my suspicions that middle-income countries would benefit most from increased Internet usage. Once more, the elasticity calculated for the entire sample was fairly close to the calculation for the middle-income sample. The elasticities for low- and high-income countries were negligible, while for middle-income countries, the elasticity was both positive and considerable.
The effects of Internet use on market size indicate that there is no effect in lower-income countries. However, the findings show that Internet use is far more elastic in middle- and high-income countries. The estimate for middle-income nations was higher than the elasticity for high-income countries. This may imply that as economies develop and countries move toward higher income levels, increased Internet connectivity opens up more domestic capital markets and creates more chances for investment.
Unexpected model estimations resulted from the investigation of Internet usage on the UN HDI. Despite the fact that the model fit is not as good as it was for the previous three models, the findings suggest that there may be intriguing effects that call for more investigation. The elasticity estimate for the entire sample was similar to that of the middle-income sample, and both were positive and significant, as observed in the three other estimations. Surprisingly, the low-income sample's estimated elasticity was positive and substantial. The findings from the estimation of Internet use on GDP confirm this result because the HDI is an aggregate measure that also accounts for per capita GDP.
The results of this dissertation confirm findings from earlier studies that looked into the effect of Internet use on comparable economic outcomes. The positive and significant effects of Internet use on per capita GDP are particularly intriguing because they are consistent with findings from Czernich et al. (2009) that demonstrate a comparable impact of broadband Internet on GDP growth in OECD nations. Additionally, the findings in Freund and Winhold’s studies on the effects of broadband internet on exports are supported by the results of this dissertation, which demonstrate the effect of the Internet on export revenues.
It is significant to remember that Internet usage estimates are resilient to different specifications and estimating techniques. Regardless of the specific estimating method, the estimates of the effect of Internet use are constant for each sample and specification.
5.2 Policy Implications
The policy recommendations drawn from these results vary according to the country's income level since Internet use has different effects on economic development based on the country's income level and the particular outcome.
Increased Internet usage generally improves per capita GDP and overall welfare as assessed by the HDI in low-income nations. This argues that in order to improve job development, health care services, and programmes to raise literacy, policy initiatives should concentrate on providing more Internet connectivity, probably based on new or current cellular phone infrastructure. Importantly, given that I have demonstrated the benefits of ICT and Internet use for development, LDCs can benefit from the chance to use aid and FDI to quickly deploy new technological infrastructure, such as wireless telephone and Internet, in order to advance from outmoded technologies.
Institutions are required to provide and manage these services, but as we have seen, in certain nations, establishing effective institutions may come at a preliminary expense. Policymakers might encourage foreign aid to support services like health and education while directing local and international capital deployment toward building out the Internet infrastructure, for instance. Additional Internet usage had no appreciable effects on exports or market size in low-income nations. As a result, until the economy has reached higher income levels, policymakers should refrain from Internet-based development programmes aimed at developing exports or capital markets.
The most dramatic increases in economic and societal well-being outcomes are seen in middle-income nations. The findings of this dissertation imply that the four indicators of economic development in these nations are positively and significantly impacted by rising Internet usage. As a result, policymakers in nations that have started to leave the lowest level of economic development may want to promote the widespread installation of Internet connection. In order for the service sector to offer the populace mobile banking, insurance, and other Internet-enabled technical solutions, policymakers must provide the appropriate institutional and legal backing.
5.3 Future Research
The goal of this dissertation was to establish a comprehensive framework for future study on the impact of Internet use on economic growth. The findings provide convincing proof of the favourable effects, which vary depending on the amount of development attained. However, this dissertation has omitted a number of intriguing and crucial research issues and areas that are worthwhile exploring, as in any developing field of study.
Although I have uncovered evidence that internet use has an impact on a number of development outcomes, I do not look into the factors that influence internet use. What promotes or restricts Internet usage? What effects do the political, institutional, and economic circumstances in a given country have on not only the likelihood of access to the Internet but also its actual use? The process of ex- act transfer is another intriguing query. What are the actual mechanisms by which using the Internet affects these results?
This work has uncovered new fields of study that will expand on the findings. The additional information that becomes available on the years after 2007 will be useful for future analyses into the effects of Internet use in developing countries. Spatial econometric techniques, involving contiguity measures based on data and voice transmission networks, may offer another way to look into how Internet use affects economic development because the Internet is delivered to developing economies through fibre optic backbones that cross specific borders.
The findings of the effects of Internet use on per capita GDP reveal an intriguing growth story. This relationship might be examined in a later work using a more conventional macroeconomic growth modelling approach.
Remote areas are now receiving health care services because to technology. Telemedicine enables untrained doctors in rural Kenya to communicate with specialised experts who are hundreds of kilometres away (Independent News and Media 2010). These findings may imply that in developing nations, Internet access may have a more direct impact on particular health and educational outcomes. According to the UN HDI, there may be a direct relationship between Internet use and outcomes in terms of education and health.
Technology adoption in emerging nations will inevitably take place in phases rather than all at once across the entire nation. Randomized controlled trials, or random evaluations, may be an effective method for examining the effects of Internet use in field investigations. The same ethical issues that plague health or education treatments do not apply to providing access to the Internet as a treatment. In addition, it will be exciting to investigate these models using firm-level data as data from developing nations becomes accessible. Data at the country level may hold the key to unlocking some of the mysteries surrounding transmission techniques or the likelihood of Internet use.
The most fascinating arena to investigate how technology affects developing economies is quickly developing as the discipline of economic development study. My modest attempt to advance the discipline through this dissertation is to present thorough empirical proof of the obvious economic advantages of growing Internet usage in developing nations.
References Cited
.png)
Thesis Writing
Impact of Globalization on Socio-Economic and Political Development of the Central Asian Countries
Chapter One
Introduction
This study of this economics assignment thesis aims to comprehend how the socio-economic development of two specific former Soviet Union nations—Kyrgyzstan and Kazakhstan—as well as all Central Asian nations—which are still figuring out how to fit into the highly interconnected and globalized world—is affected by global political, economic, and social processes. One of the reasons for selecting these particular nations is that, of all the Central Asian republics, only Kazakhstan and Kyrgyzstan were able to establish relatively favorable investment climates that, in theory, should hasten the development of their economic integration with the world market (Marat, 2009). However, Kazakhstan and Kyrgyzstan significantly differed from one another in starting economic conditions, including such an important factor as natural resources, abundant in Kazakhstan and absent in Kyrgyzstan. These two republics, with populations ranging from 5 to 16 million, were similar in that they shared a common socioeconomic space that was determined by a common Soviet legacy (Primbetov, 2006). It has affected the rate of their development and their capacity to respond to globalization's difficulties. To successfully participate in the contemporary political system, these nations made the decision to open their markets, liberate their economies, and adopt democratic structures. However, there have been several challenges that have delayed their changes along the path to modernization and the shift to an open market economic system. The primary objective of this thesis is to examine how Kazakhstan, Kyrgyzstan, and Central Asian republics in general have responded to current political and socioeconomic trends while operating within the socioeconomic constraints inherited from the Soviet legacy as well as from the geopolitical reality.
How these policies have affected their country's political and socioeconomic development. In my perspective, the best way to comprehend the dynamics of growth in the Central Asian region is to analysis this process through the prism of globalization.
To further explain my findings, I draw on a number of theoretical perspectives related to the overall issue of social development, such as dependency theory, functional approach, push-pull theory, liberal democratic theory, and liberal institutionalism. I have employed a number of ideas since neither the political nor the socio-economic effects of globalization can be explained by a single theory. Later in the chapter, these are further developed.
Defining Globalization
Globalization is a multifaceted phenomenon that affects not only the political, economic, social, and cultural aspects of any nation but also changes how "social world and human nature" are traditionally studied (Robinson, 2005). Global economic integration, deterritorialization, and time-space compression are all terms that are frequently used to describe globalisation (McGrew, 2008). It is necessary to examine each of these features separately in order to gauge its extent and effect on a specific community. In light of the phenomenon's complexity, I would want to focus solely on the political and socioeconomic impacts of globalisation on the socioeconomic growth of Central Asian nations, especially Kazakhstan and Kyrgyzstan. This study's objective is to examine the effects of globalisation rather than to speculate about its nature or demonstrate whether it is generally a beneficial or negative phenomenon.
Growing socioeconomic and political interdependence brought on by globalisation has an impact on the development of nations that are still figuring out where they fit into the global political system. My main goal is to investigate how Central Asian nations that are still in a transition process respond to and adapt to the rapidly escalating conditions of globalism, which are represented by inclusion in the global economy, the removal of trade barriers, extraordinary mobility of human capital, goods, and services, as well as by the interconnectedness of ideas and norms that reshape not only our understanding of current social and political institutions but also the way we live (Bhandari and Heshmati, 2005). By adopting and applying western political and economic models, such as democratising political regimes and liberalising economies in the former Soviet Union region, one might observe this shift.
I examine economic, social, and political elements of globalisation that deal with issues of free movement of capital and people as well as with concerns of global political and economic integration based on this understanding of globalism. I investigate how these elements impact the political and socioeconomic advancement of Kazakhstan, Kyrgyzstan, and other Central Asian nations.
Measures of globalization: migration; remittances; liberal democracy; cooperation and regional integration
I examine worker remittances and international migration movements, which have increased over the past few years, notably in the Central Asian region, to study the socioeconomic effects of globalisation. Components of modern globalisation. I want to find out how the rapid migration of people and the influx of remittances into the countries of origin of migrants affects their socioeconomic advancement. Foreign direct investment is a different indicator of the effects of globalisation (FDI). However, this measure mostly applies to nations with a wealth of natural resources or access to skilled labour at reasonable prices. Since the majority of Central Asian nations lack natural resources, their FDI per capita is low, and as a result, FDI is not indicative of any economic improvement in these nations. Additionally, political stability is a prerequisite for a consistent FDI influx, which is not the case throughout much of Central Asia. On the other hand, remittances are common in all of the countries examined. The political impact of globalisation is examined by looking at it from the standpoint of liberal democracy, which is based on the notions of imposing and expanding the principles of capitalism, neoliberalism, industrialism, and other ideologies throughout developing world (Scholte, 2005). I wish to focus on whether Central Asian countries' adoption of the liberal democracy model (open markets and democratic institutions), as is claimed to be the case by Smith, Baylis, Ownes (2008) as well as Huntington, Shin, and Diamond, results in effective economic development (Scholte, 2005). Additionally, I consider the political effects of globalisation from the angles of regional cooperation and integration. Globalization, which reinforced new regional and global issues, set off these processes. These challenges had a profound impact on the region's political processes and compelled Central Asian countries to reevaluate their foreign policy goals. I examine how the introduction of new political actors in the region affects the development of these countries' foreign policies (cooperation and integration) by examining regional organisations like the Eurasian Economic Community and the Shanghai Cooperation Organization (SCO) (ECC).
Research Questions
I have a number of research questions since I examine the effects of globalisation from both an economic and political standpoint. The economic ramifications of globalisation are the subject of my first two research questions. I start by looking at how globalisation has affected the socioeconomic advancement of the Central Asian republics as measured by remittances. In this work, I quantify socio-economic development by analysing whether remittances have positive or negative effects on it using the Human Development Index, a broad indicator of circumstances for education, health, and income. Although there is evidence that worker remittances have favourable short-term effects on the growth rate of GDP, my hypothesis contends that their rise may have a negative long-term effect on economic growth. The likelihood that remittances don't bring about any structural changes to the nation's economic and political systems can help to explain this argument. Remittances instead breed reliance, which cripples a nation's ability to produce. The Dutch sickness is the name given to this phenomenon.
I attempt to examine how migration influences social and economic development in my second research question. I examine the "socio-economic structural changes" (Economic Development, 2009) in the migrant-sending nations and the potential effects they may have on their laws and public policies. According to my theory, sending countries are negatively impacted by labour migration. One justification for this assumption is that labour migration causes a decline in the supply of labour and intellectual capital.
"Brain drain" capital, which has negative consequences on social metrics like life expectancy and human development, is one type of capital.
The political ramifications of globalisation are the topic of my third research question. In order to assess the effects of globalisation, I consider both the Economic Freedom Index and the Democracy Index. This is because, in some definitions, globalisation and the process of democracy are mutually exclusive or frequently go hand in hand (Scholte, 2005). (Huntignton, 1991; Shin, 1994; Diamond and Plattner, 1996). By comparing the levels of socioeconomic growth in democratic and nondemocratic nations, I look for a relationship between the degree of democratic regimes and development. My premise is that effective socioeconomic development does not necessitate democracy. By examining a number of non-democratic nations that exhibit efficient economic growth, this statement can be examined.
The descriptive examination of the political effects of globalisation is the subject of my final research topic. I work to comprehend how the political roles of the Central Asian nations both within and outside the area are impacted by the current processes of globalisation related to the political, economic, and social interdependence among adjacent countries, including such titans as China and Russia. My hypothesis is that the Central Asian republics' leaders have chosen political collaboration, which will lead to stability in the region. Countries in Central Asia actively participate in organisations for regional cooperation like the Shanghai Cooperation Organization or the Eurasian Economic Community. Up until now, it has been a successful tool for addressing local and international issues that have the potential to undermine the region's political and security stability.
In order to continue with the chapter, I must first accept that there are the outcomes of my study are liable to change and have certain limitations in both the procedures and each of the measurements that I used. The following chapters will go over those restrictions.
Significance of the study
The importance of this research is that I attempt to examine the macroeconomic and sociopolitical effects of globalisation in a specific geographic area. By offering practical methods for forming public policies that can foster favourable conditions for economic development or mitigate short-term negative effects of globalisation, this technique can considerably contribute to improving our understanding of the true scope and impact of globalisation (Ratha, 2004).
Additionally, I combine qualitative and quantitative analysis to identify causal relationships or correlation effects between migration, remittances (which result from labour migration), economic and political liberalism, and socio-economic factors in Central Asian countries. This work has already been done by a number of political scientists.
Another crucial aspect of my research is its attempt to reframe the mainstream liberal theories that have dominated contemporary political science. For instance, a lot of liberal researchers think that having democracy automatically results in good socioeconomic development. The foreign policies of hegemonic powers toward developing countries have been greatly affected by this strategy.
Understanding that democracy does not always equate to steady socioeconomic development, however, can help to explain why emerging nations prefer alternate forms of government to the western ones. These choices consider the political, social, and cultural diversity that exists between nations, which can help avoid potential cultural confrontations.
On the other hand, this study makes the case using liberal doctrine (Liberal Institutionalism) that although embracing liberalism does not always have a positive impact on the socioeconomic development of the Central Asian countries; it can still be used to explain regional patterns of political and economic cooperation.
Theoretical Framework
The primary theoretical underpinning of this study is based on dependence theory, which contends that significant modifications to the social and political systems of emerging nations brought about by globalisation have a detrimental effect on socioeconomic development.
This approach contends that the emergence of previously unheard-of levels of labour migration and the adoption of neo-liberal principles are responsible for the "development of the underdevelopment" because they lead to the outsourcing of human capital and labour resources from the developing world's periphery to the developed world's core, which has a detrimental impact on the economic development of developing nations (Haas, 2007).
There are two basic theoretical perspectives on migration that emerged from the dependency and social development themes (Mahmud and Sabur, 2009).one of them represents a structural or dependence approach that contends that the growth of the periphery is unachievable because of a "unique insertion in the world economy" where the developed countries (the core) entirely extract the capital accumulation of the periphery (Mahmud and Sabur, 2009; Vernengo, 2008). According to this perspective, migration is seen as a "capitalist phenomena that not only harms the economies of undeveloped or emerging countries, but actively contributes to their underdevelopment" (De Haas, 2007).
"Migration and remittances simply support the capitalist system that is based on inequality," claims Hass (2007). According to academics who belong to this perspective, migration alters the social structures of the countries that send their migrants, changing the traditional types of households (Hayes, 1991). Additionally, they contend that remittances—a byproduct of labour migration—cannot be regarded as a reliable source of income (Hass, 2007). The most recent economic crises, which nearly cut in half the amount of remittances flowing into nations like Kyrgyzstan and Tajikistan, provided some support for this assertion (Marat, 2009). Given that remittances account for 27% and up to 30% of each country's GDP, respectively, it is a sizeable sum (Marat, 2009).
The functional approach is another theoretical perspective (Mahmud and Sabur, 2009; Vernengo, 2008). According to Cardoso and Faletto (1967), "progress in the developing world is achievable" because foreign capital can be "re-invested in the host country," which could result in economic growth (Vernengo, 2008). The underlying assumptions of this theory are drawn from "neo-classical development economics," which sees migration and remittances as factors in economic progress. The "process of shifting excess labour from poor countries to the global industrial sector" is how it describes migration. It establishing a balance between host nations, where wages decline, and sending migrants countries, which begin to receive remittances that reduce existing economic inequities, should promote economic growth in sending migrants countries.
I discuss the beneficial and detrimental effects of migration and remittances on the development of the Central Asian countries using both theoretical perspectives.
However, I examine and analyse numerous aspects of globalisation in this study that call for incorporating a number of scholarly perspectives into the overarching issue of globalisation and development, including push-pull theory, structuralism, and rational choice.
When evaluating the issue of migration, I draw on some of the "livelihood methods" that arose in the fields of geography, anthropology, and sociology in the 1970s (Hass, 2007). It draws attention to the significance of human agency in examining the causes of migration (rational choice, push-pull theory), as well as potential effects on the general social, economic, and institutional development of the nations from which migrants are being sent (Haas, 2007). I use the push-pull theory of migration in particular to comprehend the migratory trends in the Central Asian region. The British thinker Ernest Ravenstain, who published "Laws of Migration" in 1885, is credited with developing this strategy. According to his research, migration is a process that is influenced by push-pull factors (Ravenstain, 1985). He defined push factors as particular political or economic circumstances, such as famine or military and civil conflicts, that compel people to relocate to areas with better socioeconomic conditions, which operate as "pull" causes (Theories of Migration). I include some socioeconomic concepts to demonstrate how remittances have an economic impact.
Economic development theory that give me access to several analysis methods, including societal, international, and individual. For the sake of my research, I focus on the global analysis and calculate the effects of remittances, which may be thought of as financial flows (Jaffe 1998), on the socioeconomic advancement of recipient nations in the Central Asian region.
I look at democratic theory, which is not monolithic and covers all facets of a society's socio-political existence, to comprehend the political ramifications of globalisation. I focus especially on the liberal democratic theory's economic parts that deal with economic freedom, which includes private property and business ownership, free markets, and a limited role for the government. The fundamental tenet of this strategy is that developing nations' adoption of democratic political and economic systems creates the conditions for successful economic development.
I employ the Liberal Institutionalism approach in conjunction with liberal democratic theory to comprehend how globalisation has affected the political evolution of the Central Asian republics, notably the formulation of their foreign policies. According to this view, international institutions might encourage governments to forego short-term gains in favour of long-term rewards from collaboration (Walt, 1998). Due to the diversity of interests and economic development levels among the member nations, organisations like the SCO or ECC in this scenario may not be effective in the short term, but they may have positive long-term benefits on the growth and stability of Central Asian nations (Guger, 2008).
These methods can be useful in explaining why migration and remittances affect a country's socioeconomic development in diverse ways. I likewise think that combining these theoretical frameworks can greatly increase our understanding of the true breadth and impact of globalisation.
Methods and research design
This study's methodological framework combines qualitative and quantitative techniques. I combine the case-study method with panel data regression analysis and simple regression. By measuring socioeconomic development indicators like GDP, the Human Development Index (HDI), life expectancy, and the Index of Economic Freedom at the same moments several times, I can use empirical methods to track cumulative changes in a particular phenomenon, like the socioeconomic development of Central Asian countries over time, and determine how they are impacted by globalisation. It also enables the generation of more accurate findings and judgements (Johnson and Reynolds 2008). I can better comprehend the effects of specific socioeconomic indicators of globalisation for one country with the aid of a thorough case study. That might help me comprehend the true effects of globalisation on development.
For calculating the economic effects of globalisation as assessed by remittances and migration, I employ panel data regression analysis. In particular, a fixed effect model with country-specific fixed effects is employed. These observations are not independent since many observations are associated with a single nation. The use of fixed effects enables the correlation of observations from the same nation. However, because the slope coefficients are what I am most interested in, I do not mention the estimated fixed effects. The Hausman test revealed that the fixed effects model is the preferred specification in spite of my attempts to estimate the random effects model. In each circumstance, I use databases given by the World Bank, IMF, International Labor Organization (ILO), Eurostat, UNESCO, UNDP, and MPI annual reports to compile my raw data on migration and remittances. These databases are accessible on the websites of these organisations. The United Nations Statistical Division's Population Census Questionaries’ is used to derive official data for migration from the Demographic Yearbook data collection system. To reduce the burden on governments, different organisations pool their resources to collect data on international migration (UNDP). After testing numerous model specifications, the final panel data analysis results are shown for the three model specifications that I believe to be the most suitable. The major finding is that only one economic development measure, GDP, is significantly positively impacted by labour migration and remittances. Their effects, however, are statistically marginally less significant than the impact of inward FDI flows. The findings also indicate that migration and remittances have little influence on social development metrics.
By applying the data I utilised for my empirical analysis to Kyrgyzstan, I undertake a case study for one nation as a complement to the empirical research of the effects of remittances and migration on the development of Central Asian countries. It enables me to gain a better knowledge of how remittances and migration impact several socioeconomic development indices, including GDP, FDI, export as a share of GDP, unemployment, private consumption, and life expectancy. Eight graphs that show the connection between migration/remittances and socioeconomic progress provide the final results. I observe that the remittances have two consequences on Kyrgyzstan. On the one hand, they do raise the GDP per person. But they do have an adverse impact on the industrial sector, which could, in the long run, have a very substantial negative impact on the Kyrgyz economy.
I investigate the political effects of globalisation using a case study methodology. The degree and scope of democracy are used in my study to gauge the level of globalisation. My information on democracy includes measures like the Economist Intelligence Unit's Democracy Index, the Wall Street Journal's Economic Freedom Score, the Heritage Foundation's Economic Freedom Score, and the Human Development Index, which can be found on the HDR's official website.
In this thesis, political growth is represented by patterns of collaboration and integration in the Central Asian region. I also utilise a case study to analyse the effects of globalisation on these patterns of cooperation and integration. I use regional organisations like the Eurasian Economic Community (EEC) and the Shanghai Cooperation Organization (SCO) to assess the foreign policies of the Central Asian nations.
I analyse the degrees of development of democratic and authoritarian nations using these metrics, focusing my study on Ukraine and Kazakhstan while using India and China as a benchmark for comparison.
To discover a haphazard association between socioeconomic progress and democracy, I also employ simple regression analysis. By calculating the effects of democracy on GDP growth rates and levels as well as the effects of democracy on the Human Development Index, I develop two models that examine data from 154 different nations. The study discovers a statistical relationship between democratic participation and economic growth, but further empirical data is presented to indicate that this relationship is simply statistical. As I contend, it is challenging to assert that there are causal linkages between these two variables, and graphs that support this assertion are shown.
Structure of the thesis
The structure of the thesis is as follows. The second chapter examines academic literature that aids in my comprehension of current scholarly tendencies, their developments, and their drawbacks. Additionally, it gives me theoretical tools that I can utilise to develop hypotheses and find solutions to my research concerns. By conducting an empirical analysis of remittances and their effect on the growth of the Former Soviet Union and Eastern European countries, I examine the socio-economic effects of globalisation in my third chapter. The fourth chapter conducts yet another empirical analysis to investigate the socio-economic effects of migration on the nations of the former Soviet Union. I undertake a case study to complement my qualitative research in which I examine the socioeconomic effects of migration and remittances on Kyrgyzstan. In the fifth chapter, it is finished. The sixth chapter looks at how globalisation has impacted Kazakhstan and Ukraine's political development. It is done by contrasting nations like China with India, which picked its own particular course for political and economic development whereas India adopted a liberal democratic model. I compare democratic Kazakhstan and powerful Ukraine using both nations as my main benchmarks in order to assess the effects of democratisation on the socioeconomic progress of each nation. In the end, I evaluate my research and talk about how globalisation has affected the successful growth of the Central Asian nations, especially Kazakhstan and Kyrgyzstan. The sixth chapter provides a detailed analysis of how global difficulties brought on by globalisation have an impact on Central Asian foreign policy republics. It studies the nature of regional cooperation institutions like the SCO and EEC and looks at regional cooperation as a tool to build foreign policies.
Chapter Two
Literature Review
The topic of globalisation, which leads to unprecedented levels of migrant movements, prompts the emergence of new types of migrant-related financial institutions (remittances), leads to a wide spread of democratic regimes, and hastens the process of regional cooperation and integration, is covered in a substantial body of scholarly literature. This body of scholarship aims to examine the effects of these circumstances on socioeconomic development globally, with a focus on the former Soviet Union. The academic literature on this topic can be divided into several categories, and each one focuses on a different issue, such as the effects of migration, democracy, or worker remittances on socioeconomic development. It also examines the effects of globalisation on the integration and regional cooperation of the Central Asian countries.
The issue of migration and remittances, which are frequently experienced together but may or may not have the same impact on the process of development, has received substantial attention in academic literature since the Central Asian governments gained independence at the beginning of the 1990s. Three intellectual factions have emerged from the scholarly research in this field, each with significant contrasts and similarities.
The first group of academics is in the camp of political scientists and economists who contend that remittances harm developing nations. Several thorough research can serve as representations for this academic group (Agunias Mechthil (2006), Shelburn and Jose Palacin (2007), Cohen (2005), Haas de Hain (2007), and Stuart (2006). These studies are based on claims that worker remittances may have a short-term positive impact on development but are unrelated to or have a long-term detrimental impact. Remittances, according to these experts, are such a complicated phenomenon that it is important to consider both their economic and other related socio-political components. To find the effects of remittance on development, they also try to apply other qualitative methodologies, such as partial and temporal scales of study, in addition to economic analysis of this phenomena. For instance, Haas de Hain (2007), who employs this specific technique, claims that the remittances have the ability to stimulate the economy, improve well-being, and reduce poverty. Their impacts on social development are unclear, nevertheless. Furthermore, despite the fact that remittances and immigration are advantageous for certain households or small towns, regional and temporal examination of this topic shows that they cannot significantly contribute to social or economic development, especially in unfavourable investment climates. Governments must therefore enact certain social, political, and economic policies that will enable remittances and immigration to reach their full potential if they are to be effective.
Other academics, including Stuart (2006) and Palacin (2007), who contend that specific macroeconomic circumstances must be met for remittances to be advantageous to an economy, support this viewpoint. Additionally, rather than at the level of the entire country, where the macroeconomic implications of remittances are less obvious due to a lack of complete and adequate statistical data, a positive effect of remittances can be seen in micro-household studies that involve specific individuals or local communities.
I believe that the tendency of the adherents of this academic camp to see worker remittances from broader socio-political settings as well as from economic viewpoints sets them apart. For instance, Cohen (2005) examines how migration perspectives might be used to study how remittances affect socioeconomic growth. He examines the results (positive or negative) of remittances on developing nations using micro and macroeconomic techniques. The author contends that migration and remittances may be detrimental to developing nations based on the use of these methods. They can first exert more downward pressure on the countries where migrants are going (in the Commonwealth of Independent States, migration is known as "south to south" movement because it occurs between developing nations). Second, migration causes home countries to lose talented employees. Thirdly, according to some data, returning immigrants (especially in metropolitan regions) have greater unemployment rates than non-immigrants since their skills don't match those of the region. And finally, as migrants' levels of education rise, remittances fall. Other authors who adopt the same strategy, such as Leon-Ledesma and Piracha (2004), contend that international migration and remittances immobilise nations and make them remittance-dependent. Dependence on remittances stunts progress and widens social inequality.
Researchers who believe that remittances have a favourable effect on socioeconomic growth make up the second group of academics. Workers' remittances and remittances in general, according to authors like Korobkov and Lev V. (2005, 2007), Ivakhnyuk (2006), Jones, Black, and Skeldon (2007), Admos, Piesse and Pinder (2003), Marlene (2007), and others, can be particularly advantageous for developing nations. Additionally, they use a variety of strategies and techniques, such as time series cross to research these topics, use case studies or sectional analyses.
Some of them have a propensity to see worker remittances in a broad sense. For instance, Devesh and Singer (2005) contend that remittances help recipient nations by opening up new markets. They contend that nations with bigger remittance inflows have a stronger chance of effectively integrating into the world economy. Remittances, which are more predictable and do not impose restrictions on governmental policies or decisions, they contend, constitute a replacement for government spending that reduces market uncertainty. This is in contrast to FDI and other capital inflows, which do.
Advocates of remittances' beneficial effects on development also employ panel data techniques to analyse the factors that influence remittances. For instance, Mechthild (2006) focuses on the factors that determine remittances rather than explicitly examining the effects of remittances on development. His paper's study is supported by panel data analysis. His research's findings show that remittances are ongoing and increasing in tandem with domestic unemployment. They also demonstrate that the volume of migrant flows declines as GDP per capita rises and markets become more open as a result of global integration.
Korobkov V. and Lev V. (2005, 2007) are two scholars who favour examining remittances from a socio-economic perspective. In their analyses, they make the case that migrant money flows, through reducing poverty and eliminating hunger in some locations, have a considerable positive impact on stabilising the economic and political structure of the CIS. However, they contend that for it to be successful, governments must enhance their labour laws and regulations as well as their policies governing the flow of money.
Migration the authors contend that weak civil societies and inadequate governmental policies prevent remittances from reaching their full potential. Because of this, it's crucial to put into action specific political and financial efforts that can help to increase the impact of remittances, such as limiting labour movement or growing the financial sector to facilitate transactions.
This method is used by academics like Ivankhnyuk (2006) and Jones, Black, and Skeldon (2007) who attempt to investigate this problem in the context of migration and by using a case study methodology.
For instance, Ivakhnyuk (2006) evaluates current immigration trends, including the difficulties and advantages they present for both sending and receiving countries. Remittances, which are closely linked to migration, have an effect on sustained economic development, according to the author, especially for smaller nations like Kyrgyzstan or Tajikistan. Additionally, the author contends that they are even more significant than FDIs.
Tajikistan's progress is the subject of a case study by Jones, Black, and Ronald Skeldon from 2007. The authors contend that in Tajikistan, migration and remittances have served as a "shock absorber," easing socioeconomic pressures in this particular developing economy. The writers analyse the effects of globalisation and the post-Soviet Union era's economic and demographic factors on migratory trends. Additionally, they contend that remittances from migrants continue to be important sources of income for keeping individual homes afloat (because they are heavily depending on them). They conclude in their report that the Tajik government must encourage migration by enhancing the banking industry and developing foreign migrant employees are aware of their rights.
The scholarly group's authors unanimously agree that remittances have a favourable impact on socioeconomic development. They all concur that if appropriate governmental laws are put in place, it is a significant source of consistent financial flows that has an impact on reducing poverty and inequality.
Scholars who contend that remittances can have both favourable and unfavourable effects on effective growth make up the third academic group. According to scholars like Maimbol and Ratha (2005) and Laruelle, Chami, and Barajas (2008), in order to understand the true significance of worker remittances, it is necessary to examine the factors that influence them in a variety of contexts, including the global and socio-economic. This kind of study shows that remittances can buffer economic shocks during a crisis, but they can also seriously harm local production, which will have an impact on a country's economic growth, such as Tajikistan (Chimomhowu,Piesse and Pinder 2003).
Another body of academic research focuses on the political effects of globalisation, which are frequently linked to the extension of democracy and the uptake of neoliberal values by developing nations, both of which promote modernization and socioeconomic development. This academic study's central tenet is that the foundation for effective economic development is provided by democratic political and economic institutions (Thaker, 2007; Halperin, Siegel, and Weinstein, 2005; Grosgean and Senik, 2008; Prezworski, 2004). A compatibility perspective is the name given to this method. It contends that fundamental civil liberties and democratic institutions provide the social atmosphere most conducive to economic growth (Sirowy and Inkeles, 1990). However, a conflict perspective reflects another scholarly viewpoint on this matter.
That implies democracy impedes progress and economic growth. Studies by political scientists and economists like Walter Galenson (1995), Karl de Shweinitz (1959), Huntington and Dominguez (1975), as well as Huntington (1968), Barro (1996), and O'Donnell (2001), contend that as democracies spread, there is a problem with redistribution and an increase in the influence of interest groups. This method views democracy and economic development as opposing forces. Weak democratic institutions are unable to implement economic programmes effectively, hence economic progress requires a strong authoritarian regime (Sirowy and Inkeles, 1990)
A modernization thesis approach to democracy contends that economic expansion, not democracy, is what actually fosters democracy (Lipset, 1959).
Both qualitative and quantitative methods have been used to test all of those theoretical frameworks. Case studies that examined the effects of democracy on emerging nations in Latin America, Eastern Europe, Africa, and Asia were used in qualitative research (Chen, Liang-chih, 2007; Bruce Bueno de Mesquita and George Downs, 2005; Morton H. Halperin, Joseph Siegle, Michael M. Weinstein, 2005)
Cross-sectional analysis (Neubauer, 1967; Diamond, 1992; Muller, 1995; Przeworzky and Limongi, 1993; also Przeworzky, 2005) and simultaneous equation models were used in quantitative investigations (Rafael Reuveny and Quan Li, 2003).
Additionally, a number of significant studies have examined the factors that led Central Asian nations to choose cooperation over conflict in order to preserve regional stability. Some of them are only interested in theorising about how cooperation and regional integration work. The papers here employ a realism methodology to explain current patterns of synchronisation in Central Asia. For instance, Eric Miller's 2006 essay "To Balance or Not to Balance" uses the security risk and the weaker Central Asian nations' economic dependency on Russia as a basis to explain current collaboration (Jervis, 1999). Scholars frequently employ the "balance of power" and "balance of danger" theories by Kenneth A. Waltz and Stephen M. Walt to describe the foreign policies of the countries of Central Asia (Michael Mandelbaum, 1994; Roy Allison and Lena Johnson, 2001). These authors' writings, such as "Central Asian Security: The New International Context" (2001) and "The Rise of nation in the Soviet Union: American foreign policy and disintegration of the USSR" (1991), suggest that greater international cooperation in the Central Asian region is not feasible because each state is focused on maintaining its current status quo and maximising its power, making it difficult for those nations to reach common interests (Brown, 1996). However, the Central Asian nations' current participation in regional institutions and the relative stability of the area imply that cooperation is feasible.
A different group of studies is focused on regional cooperation in practise. They examine the effects of globalisation on patterns of cooperation in Central Asia from the viewpoints of economic interdependence, the advent of new political actors like China and the US as well as the reemergence of old ones like Russia. The analysis of these studies is based on a review of several regional organisations, including the Shanghai Cooperation Organization (SCO), the Eurasian Economic Community, and the Commonwealth of Independent States (CIS) (Bogaturov, 2004; Tolipov, 2005 and 2006; Weitz, 2006; Annand, 2006; Primbetov, 2006; UNDP 2005; Germanovich, 2008).
Chapter Three
Economic impact of globalization: the impact of remittances on socio-economic development
This chapter examines how inward remittances immediately affect socioeconomic growth. It is based on broader data that includes countries in Eastern Europe and the former Soviet Union in addition to one particular country in Central Asia.
Remittances became one of the most significant sources of external financial flows in developing countries over the past 20 years (Kapur, 2006). Remittances are regarded as the third-largest financial source for the majority of former Soviet Union countries, after foreign aid and foreign direct investment (Mansoor and Quillin, 2007). Remittances are almost always linked to labour migration, which has increased over the past few years as globalisation has accelerated and a record-breaking volume of international migration has taken place.
There are approximately 200 million people living temporarily or permanently outside of their home countries, according to Schiff and Ozden (2005) and updated estimates from the World Bank. The CIS region's 5 to 15 million official irregular migrant workers, the majority of whom live in Russia and Kazakhstan, are among them (Marat 2005). Remittances are frequently used to examine labour migration trends and their effects on the host countries of migrant workers.
Remittances are funds that migrant workers send, formally or unofficially, to their home countries (US Congress 2005). International migration flows rose from 76 million in 1965 to 188 million in 2005, according to Taylor (2006). The majority of remittances—roughly 70%—go to less developed nations.
The main issue this chapter addresses is whether remittances have a favourable or unfavourable effect on recipient countries' socioeconomic development. The Human Development Index (HDI), which measures the conditions of education, health, and income as well as on other social indicators like migration and life expectancy, is used here to represent socioeconomic development.
I examine socioeconomic development theory, which contends that dependence on them slows rates of socioeconomic development, to find an answer to this question (Jaffe 1998). I employ this method to calculate the effects of remittances, which can be thought of as financial flows, on the socioeconomic development of the ECA region's recipient countries.
I also review the academic literature that focuses on migrant remittances and how it might affect sustainable development, which involves alterations to the socioeconomic structure of a nation (Economic development 2009). The improvement of living standards, including rising income and bettering health and educational systems, is a sign of these changes (Jaffe 1998). Additionally, some academics contend that these private financial flows influence poverty reduction and promote social stability by reducing unemployment.
This study's importance, in my opinion, stems from the fact that I will not only attempt to examine the significance of remittances from macroeconomic perspectives—which have already been thoroughly examined by other economists—but also from social perspectives, by taking social indicators of development and examining how they are affected by remittances. I'm using quantitative techniques to carry out my analysis. This strategy will enable me to identify marginal effects and causal relationships between the
Most political scientists who previously looked into this issue by using qualitative methods did so instead of simply establishing a simple correlation understanding how worker remittances affect development, whether positively or negatively, can be useful in a number of ways. First of all, it can offer practical tools for developing public policies that can foster favourable circumstances, such as lowering transaction costs or "strengthening a formal remittances infrastructure" for luring even more inward remittances, particularly in those nations that heavily rely on them (Ratha 2009). Second, it can aid in the development of strategies that will avert or reduce potential long-term negative effects of remittances on socio-economic development.
Remittances are a complex socio-political phenomenon that calls for knowledge of various social, political, and economic factors, as shown by the analysis of previous academic work. Remittances from workers serve as alternative sources of income and consumption that stimulate the economy by investing in or contributing to local economies. Due to the fresh perspectives and knowledge that immigrant workers bring, local communities can also benefit from positive structural changes. Even so, an excessive reliance on remittances can have unfavourable effects, such as brain drain or the Dutch disease, which paralyse nations and make them dependent on remittances, which stunt development and widen income gaps (Leon-Ledesma, Piracha 2004).
A thorough review of the literature also reveals some of the shortcomings of earlier research. I contend that a sizable number of the studies I've cited use qualitative analysis to gauge how remittances affect socioeconomic development. In my opinion, the qualitative approach fails to identify a coincidental link between these phenomena. Instead, it makes an argument for already-observed correlations without actually naming them. Furthermore, these studies do not examine any additional variables that might affect socio-economic development in addition to remittances.
Hypothesis
Following the dissolution of the Soviet Union, newly independent states made a variety of socioeconomic development decisions that were influenced by historical and economic factors that shaped their current circumstances. Significant differences in the level of development among the former Soviet Union countries are the result of weak political systems combined with the presence or absence of priceless natural resources. New patterns of population movement within the CIS region have been prompted by the economic stagnation in some republics. One illustration of these patterns is labour migration. It is linked to social and economic discontent that drives people to relocate to areas with better job opportunities.
Remittances made as a result of labour migration rank second only to foreign direct investment as a source of new money flows (Mansoor and Quillin 2006). According to data from the IMF and the World Bank, migrant workers contribute significantly to a country's GDP. For instance, remittances account for 36.2% of GDP in Tajikistan, 27.4% in Kyrgyzstan, and 18.3% in Armenia (IMF 2008). Workers' remittances are not only an external source of finance for nations like Tajikistan, Kyrgyzstan, and Armenia where remittances make up a sizable portion of GDP, but they are also a tool for addressing unemployment, which is a major issue in these nations.
According to the theory of socio-economic development (the international approach), a nation's inordinate reliance on receiving financial flows hinders its ability to develop its economy. Remittances, according to the argument, can harm social-economic development by causing a "brain drain" effect or the Dutch disease, which raises the prices of non-tradable goods, appreciates exchange rates, and drives out of business producers of tradable goods. They can also lead to social problems like widening economic disparities.
Based on the conclusions mentioned above, I have developed a hypothesis that claims that despite all the advantages of worker remittances, they have a detrimental impact on socio-economic development over the long and short terms. I contend that sizable inward remittances may have a favourable immediate effect on the economies of recipient countries by boosting GDP. However, due to the Dutch disease phenomenon, which affects production, its long-term economic impact will be detrimental. Economists have thoroughly examined this phenomenon. It demonstrates how excessive remittance flows can increase household incomes and, consequently, the consumption of goods produced for domestic markets or nontradeable goods, such as real estate, services, water, and electricity, at the expense of the sector that deals in goods that can be traded. It increases price pressure on non-tradable sectors, which may lessen the positive role that remittances play as a tool for reducing economic inequality (Acosta, Lartey and Mendelman 2007).
Additionally, I contend that remittances have a negative effect on social indicators like the Human Development Index and life expectancy. That can be explained in part by the fact that an overreliance on remittances may result in a decline in labour and intellectual forces.which is referred to as "brain drain," which could have an impact on social indicators like life expectancy or human development.
I have focused on the immediate effects of inbound remittances on the socioeconomic development of receiving countries in this chapter.
Research Design
I use official statistical databases provided by the World Bank, IMF, Human Development Report (HDR), UNDP, International Labor Statistics (ILO), Eurostat, and UNESCO in the process of gathering data on remittances. I am aware that the databases on remittances I used for my research can be subjective because they only use official data provided by domestic governments using data from Census surveys or bank statistics and do not include undocumented remittance transactions. Because of this, it does not accurately reflect all of these financial flows to assess the developmental effects of remittances I decided to use remittance volume as an independent variable and socioeconomic development indicators as a dependent variable.
In this paper, remittances are measured in millions of current US dollars and are defined as "formal and informal payments that are sent by migrant workers to their home countries" (IMF, 2008).
The Human Development Index, created in 1990 by the United Nations Development Program, is used in my research to gauge social and economic development. It does so by "combining indicators of life" to measure socioeconomic development a composite human development index based on life expectancy, educational level, and income (Human Development Report).
"To give adult literacy more weight in the statistic, the gross enrolment ratio for primary, secondary, and tertiary education is combined with adult literacy rates in the educational component of the HDI. Since the adult literacy rate ranges from 0% to 100%, the combined gross enrolment statistic is calculated in a similar way. For example, a country with a literacy rate of 75% would have a literacy component of knowledge of 0.75. The longevity component for a country with a 55-year life expectancy would be 0.5 since the HDI calculates life expectancy using a minimum value of 25 years and a maximum value of 85 years. The minimum income goalpost for the wealth component is $100 (PPP), and the maximum is $40,000 (PPP). The HDI uses the logarithm of income to reflect how income is becoming less significant as GDP rises. (Report on Human Development).
It primarily evaluates three facets of human development: education, health, and adequate living conditions. As independent dependent variables, I also include the GDP per capita, literacy rate, and life expectancy. Life expectancy is defined as "an average number of years of life remaining at a given age," the literacy rate is defined as "a percentage of the population that can read and write," and GDP is defined as "a total value of all final goods and services produced in a particular economy; the dollar value of all goods and services produced within a country's borders in a given year" (Sullivan and Sheffrin 2003). (Sullivan and Sheffrin 2003). The availability of these variables and their fit with the definition of socio-economic development, which states that it is a process of "changes in the socio-economic the nation's economic structure, such as increasing income or enhancing the health and educational systems, I will use FDI (measured in millions of current US dollars) as my control variable to make sure there are no auxiliary variables or fictitious relationships between the primary variables. Foreign Direct Investment (FDI), as defined by the Economy Watch website (2009), is an investment "made to serve the investor's business interests in a company, which is in a different nation distinct from the investor's country of origin."
My primary analytical units are the nations I've tracked over a number of years. I examine the 27 nations of Eastern Europe and the former Soviet Union. I conduct an 18-year analysis of my variables, from 1990 to 2008. Due to data limitations and missing values for some countries and years, I instead use 24 countries and 4 time periods for some of my models that specifically examine HDI and literacy rates.
The fixed effects panel data model, which is based on "observation of multiple phenomena observed over multiple time periods," is another tool I use. By measuring all subjects at the same time multiple times, this technique enables me to "observe cumulative changes in particular phenomenon over time. It also enables the generation of more accurate findings and judgements (Johnson and Reynolds 2008).
Empirical Analysis
Panel data regression analysis is used I have found three models that explain the causal link between remittances and the socioeconomic development-related dependent variables. Three different dependent variables (Human) are matched with three different models. Different sets of independent variables, such as remittances and FDI, are used, such as the Development Index, GDP per capita, and life expectancy.
Model 1
My first model identifies how inward remittances unintentionally affect GDP per capita, a measure of economic development. This model also accounts for FDI, another variable that may have an impact on GDP.
GDP is a dependent variable.
Remittances are a separate factor.
Additional regulating factors: FDI.
.png)
.png)
The one-way fixed effects model's ANOVA results show that all of the model's individual fixed effects (remittances and FDI) are jointly significant. It determines if at least one of them is not equal to zero or whether they are all equal to zero (proving the null hypothesis) (it proves the alternative hypothesis).
The F test score of 20.07 is significantly higher than the threshold value (at 0.01 level of significance it is 2.327). The null hypothesis, which states that all individual specific fixed may be removed or set to zeroes, is strongly refuted by the test's P value, which is less than 1%. F test shows that at least one of my independent variables (FDI or remittances) has a statistically significant impact on GDP, to put it simply.
.png)
R Square is the percentage of variation in the dependent variable (GDP) that can be accounted for by each independent variable in the model (remittances and FDI). With an R square of 0.7125, FDI and remittances account for 71.2% of the volatility in GDP.
These coefficients show that GDP is impacted by both of our independent variables. With their t-values above 1.97, the data show that remittances and FDI have a large impact on GDP. However, FDI has a larger t-value than remittances. These findings support the notion that FDI and remittances both raise GDP. Numerous economic research' findings concur with this hypothesis.
Model 2
The impact of remittances on life expectancy, one of the social indicators used to gauge social development, is examined. To rule out the potential of a fictitious association between life expectancy and remittances, I additionally control for FDI.
Expectancy of life is a dependent variable.
Remittances are a separate factor.
Additional regulating factors: FDI
.png)
F test is 16.73, as shown by an ANOVA, with a significance level of less than 1%. At least one of my independent factors significantly affects life expectancy, rejecting the null hypothesis. According to this hypothesis, FDI, not remittances, is the major factor influencing life expectancy.
.png)
The life expectancy dependent variable's R square, which measures the amount of variance that can be explained by the model's independent variables, is 0.9222. (remittances and FDI). According to the R square of 0.9222, FDI and remittances account for 92.2% of the difference in life expectancy. The findings indicate that remittances have a t value of 1.49, indicating that they do not significantly affect life expectancy (dependent variable).
Model 3
The third model calculates how remittances affect HDI (Human Development Index). The HDI is the weighted average of GDP, literacy rate, and life expectancy.
HDI is a dependent variable.
Remittances are a non-dependent variable.
Controlling factors: FDI
.png)
F test = 8.26, as shown by an ANOVA, with a significance level of less than 1%. It proves that the null hypothesis is rejected and that the Human Development Index is affected by at least one independent variable (FDI or remittances).
.png)
According to this model's R square, which is equal to 0.9124, remittances and FDI account for 91.2% of the variation in HDI.
As a result of their t-value being smaller than 1.97, the findings indicate that remittances have no discernible impact on HDI. On the other hand, FDI has a strong, positive impact on human development.
Conclusions
The panel data analysis results support my claim that inward financial flows have an immediate positive impact by showing that remittances have a significant positive impact on just one economic development measure, such as GDP. However, compared to the impact of inward FDI flows, its influence is statistically somewhat less significant. The findings also disprove my alternative hypothesis, according to which remittances have a detrimental influence on the socio-economic development of ECA, that remittances have a large negative impact on social metrics of development like as the Human Development Index and life expectancy. This is based on a smaller collection of data, though. Due to data limitations, I am unable to make additional observations that would raise the statistical significance of the findings. These findings also suggest that FDI, for example, may have a greater impact on socioeconomic development in Eastern European and former Soviet Union countries than remittances, with the potential of the existence of other determinants.
On GDP, remittances have a favourable impact. The idea that remittances can raise living standards in those nations that rely largely on these financial flows is questioned by the fact that they have a weak impact on social indicators.
There are a number of reasons why remittances have neither a detrimental nor a good impact on the socioeconomic development of ECA counties. One of them is the fact that the data I used for this study came from official sources and did not include unofficial remittance numbers (especially for Central Asian countries). It might affect the findings I've come to, reducing the true influence of labour migrant payments on the development of recipient countries.
Many of the countries under study are still in the process of switching from central planning to more effective economic systems in their political systems. That might be yet another reason why remittances still have limited effects. In order to increase remittances and improve the efficiency of this process, political and financial institutions must continue to develop in a way that will efficiently govern the financial sectors.
I conduct a case study on the significantly dependent Kyrgyzstan in order to conduct a more thorough analysis of this issue and advance this research. It enables me to more correctly assess the effects of migrant payments on the socio-economic structures on a case-by-case basis and incorporate additional socio-economic variables. It is completed in chapter 5.
Chapter Four
Social Impact Of Globalization: migration
Migration is a tool for measuring globalisation in this chapter. It, in my opinion, properly captures how growing economies and labour markets result in benefits and drawbacks for various nations. By generating new phenomena that are related to migration, globalisation has also changed its current characteristics. One example of how modern globalisation allows people to freely migrate from one place to another "without altering their permanent place of life" is economic-voluntarily migration (Korobkov and Paley, 2006).
Research Questions
An extraordinary increase in worldwide migratory movements has been occurring over the past few decades of accelerating globalisation. The "globalisation of the world economy and its labour market" (Salt, 1992), which has produced a system that forces economically marginalised people to leave their home countries and move to places where human capital is treated as another profitable resource, is one of the explanations for this process. Around 200 million people, either temporarily or permanently, are estimated to be living outside of their native nations by Schiff and Ozden (2005) and the most recent estimate from the World Bank. The former Soviet Union's region is not an exception.
The USSR's dissolution has made it easier for the region to transition from the forced migration of the 1990s to voluntary economic migration (Tishkov, Zainchkovskaja, Vitkovskaja 2005). Members of the CIS share cultural similarities (language), similar educational systems, and freedom of movement within CIS boundaries. However, they also have contrasts, including as varying levels of economic development. Labour migration has a wonderful starting point thanks to economic development. Today, 5 to 15 million people make up the official undocumented migrant workforce from the CIS, most of who live in Russia and Kazakhstan (Marat, 2005).
In this chapter, I examine how this process affects the political, social, and economic growth of the countries that receive migrants. I focus in particular on the nations of the former Soviet Union and Eastern Europe where labour migration is on the rise. It is also crucial to note that in this chapter, I examine migration independently of the remittances category, which economists occasionally use as a stand-in for labour migration. I define labour migration primarily in terms of population outflow and attempt to quantify its social impact on migrant countries. Only in this chapter do I distinguish between migration and remittances as two distinct factors.
My main research subject is how migration affects social and economic growth, which I define as a process that involves "socio-economic structural changes" in those nations and what effects it might have on the public and governmental laws of sending countries for migrants.
Knowing whether labour migration has a good or negative impact can be useful in a variety of ways. First of all, it can offer practical tools for developing public policies that can better govern the migration process, which frequently takes the form of uncontrolled movement of people and can be detrimental to both the sending and receiving countries of migrants. By reducing or preventing the spread of phenomena like brain drain or the loss of skilled workers, which can have a long-term devastating effect on the economies of sending countries, it can also help to develop policies that will prevent or minimise a potential negative impact of labour migration on socio-economic development.
It is also necessary to examine how contemporary migration patterns in Eastern European and former Soviet Union nations have been impacted by globalisation processes and what new characteristics they have today in order to respond to my research topic and develop a thorough hypothesis. I also need to consider the factors that contribute to migration in the area because different factors, such as the need for temporary labour or long-term migration, result in different types of population flows. I'll do this by drawing on the push-pull theory of migration created by British thinker Ernest Ravenstain in 1885 for his book "Laws of Migration." According to his research, migration is a process that is influenced by push-pull factors (Ravenstain, 1985). He defined push factors as particular political or economic circumstances, such as famine or military and civil conflicts, that compel people to relocate to areas with better socioeconomic conditions, which operate as "pull" causes (Theories of Migration).
Understanding that migration is not a recent occurrence on the soil of the former Soviet Union and Eastern Europe is made easier by analysing academic literature. Different types of migratory movements have been evolving over time, from pre-modern and early modern types that reflected historical occurrences like "invasions from the steppes by nomadic Turk tribes, spread of Islam, mediaeval conquest, and later colonisation," events that caused massive and frequently forcible movements of people throughout that region (Held and McGrew, 1999), to modern types of migration that reflect contemporary issues like globalisation and the spread of information technology. Following the demise of communist ideology in the ECA region, new types of migratory movements within the region might be categorised as economic, labour, and illegal migration.
Following the fall of the Soviet Union, newly independent governments made a variety of socioeconomic development decisions, which in turn influenced the contemporary conditions of those states. Significant gaps in progress between the Soviet Union and Eastern European countries have been caused by weak political systems as well as the economic stagnation of some nations. These circumstances have acted as "push" factors, causing new patterns of population movement within the ECA region. As a result of this process, there is labour migration. It is linked to social and economic unhappiness, which drives people to relocate to new locations with better job possibilities and other "pull" reasons. A fuller investigation of this phenomenon's impact on the socioeconomic growth of ECA countries will hopefully result from my focus on temporary labour migration, which I shall do because the topic is so complex.
Hypothesis
In this essay, I'm interested in examining the effects of labour migration as a phenomenon that has the potential to cause significant social and economic issues in the host countries of migrants. Labor migration could have a number of detrimental effects on development. One of these is a "brain drain," or a loss of labour and intellectual force, which frequently affects nations with tiny populations, like Kyrgyzstan or Bulgaria (Mansoor and Quillin, 2006). Additionally, it alters the dynamic and structure of migrant family households, which may result in a decline in fertility rates or a drop in children's educational achievement if mothers are the ones who migrate because they do not provide their kids with sufficient supervision to enable them to attend school (Mansoor and Quillin, 2006). Because of this, I consider labour migration to be a distinct category from remittances, which will enable me to evaluate this issue from both an economic and a social standpoint.
I have developed my hypothesis, which claims that migration has a detrimental impact on the socioeconomic growth of migrant home nations in the ECA region, based on the conclusions presented above. I contend that labour migration causes a "brain drain" that lowers the labour and intellectual forces and may have an impact on social indices like life expectancy or human development.
In addition, I contend that because of remittance inflows, migration may have an immediate favourable effect on economic indices in the home nations. However, due to the Dutch disease effect, which reduces production, its long-term economic impact would be detrimental. Economists have thoroughly investigated this phenomenon. It highlights how excessive remittance flows can harm the tradable sector by increasing household incomes and, consequently, the consumption of items produced for domestic markets or nontradable goods like real estate, services, water, and energy. It can potentially lessen the good impact of remittances as a strategy for reducing economic inequality because it increases demand pressure on nontradable sectors, driving prices to increase (Acosta, Lartey and Mendelman 2007).
In order to investigate how labour migration has impacted socioeconomic development, I will look at economic and social "push" factors like GDP, unemployment, or overall human development as measured by the Human Development Index (positively or negatively).
Research Design: Variables and Methods
I use official statistical databases offered by the World Bank, IMF, Human Development Report (HDR), UNDP, International Labor Statistics (ILO), Eurostat, and UNESCO in the process of gathering data on remittances. I am aware that the databases I used for my research on labour migration and remittances can be arbitrary. These datasets don't include undocumented transactions or remittances because they rely on official data from domestic governments and use information from census surveys or bank statistics. Because of this, it is unable to accurately depict all of these financial movements.
I used migration rate as an independent variable and socio-economic development as a dependent variable to analyse the effects of labour migration on socio-economic development.
The term "migration rate" is defined as "the number of migrants arriving and departing a country in a year, per 1000 midyear population. As percentages, the migration rate can also be described. A net immigration rate is a positive number, whereas a net emigration rate is a negative number (International Data Base).
A complex process called social-economic development involves shifting a nation's social and economic structures. The Human Development Index, created in 1990 by the United Nations Development Program, is used in my research to gauge progress. By "combining metrics of life expectancy, educational attainment, and income into a composite human development index," it assesses socioeconomic development (Human Development Report).
"To give adult literacy greater weight in the statistic, the gross enrolment ratio for primary, secondary, and tertiary education is coupled with adult literacy rates in the educational component of the HDI. Since the adult literacy rate ranges from 0% to 100%, the combined gross enrolment number is derived in a similar way. For example, a country with a literacy rate of 75% would have a literacy component of knowledge of 0.75. The longevity component for a country with a 55-year life expectancy would be 0.5 as the HDI calculates life expectancy using a minimum value of 25 years and a maximum value of 85 years. The smallest income goalpost for the wealth component is $100 (PPP), while the maximum is $40,000 (PPP). The HDI employs the logarithm of income to represent how income is becoming less significant as GDP rises (Human Development Report).
It primarily evaluates three facets of human development: education, health, and adequate living conditions.
As independent dependent variables, I also include the unemployment rate, GDP per capita, and life expectancy. Measured as a percentage, the unemployment rate is the proportion of jobless people in the labour force (Nation Master statistical database). Life expectancy is defined as "an average number of years of life remaining at a given age," the literacy rate as "a percentage of the population that can read and write," and GDP per capita as "an approximation of the value of goods produced per person in the country, equal to the country's GDP divided by the total number of people in the country" (Sullivan and Sheffrin 2003). (Investor Words).
Since these variables are readily available and meet the definition of socio-economic development, which is a process of "changes in the socio-economic structure of the country," such rising income or bettering health and educational systems, I have chosen to use them.
Ensuring that the primary variables do not have any erroneous relationships or intervening variables As my control variable, I'll look at FDI, which is expressed in millions of current US dollars. Foreign Direct Investment (FDI), as defined by the Economy Watch website (2009), is an investment "made to support the investor's commercial interests in a company, which is in a separate nation distinct from the investor's country of origin."
My primary analytical units are the nations I've tracked over a number of years. I examine the 27 nations of Eastern Europe and the former Soviet Union. I conduct an 18-year analysis of my variables, from 1990 to 2008. Due to data restrictions and missing values for some countries and years, I instead use 24 countries and 4 time periods for several of my models that specifically examine HDI and literacy rates.
The fixed effects panel data model, which is based on "observation of various phenomena observed over multiple time periods," is another tool I use. By monitoring all subjects at the same time multiple times, this technique enables me to "observe cumulative changes in certain phenomenon across time. It also enables the generation of more accurate findings and judgements (Johnson and Reynolds 2008).
My raw data are taken from databases that are provided by annual reports from the IMF, World Bank, HDR, ILO, UNDP, and MPI that are accessible on these organisations' official websites. The "Demographic Yearbook data collection system," established by the United Nations Statistical Division, uses data from the Population Census Questionary to compile official data on migration. To lessen the burden on nations, data on international migration are gathered jointly by a number of agencies. (UNDP)
Data Presentation
I have discovered 4 models that explain the causal association between migration and the dependent variables of socio-economic development using panel data regression analysis. Human Development Index, GDP per capita, life expectancy, and unemployment rate are four dependent socioeconomic development variables that correspond to four alternative models. Migration rate and foreign direct investment are two sets of independent socioeconomic development variables.
Model 1
In my first model, I analyse the haphazard impact of migration rate on GDP per capita, one of the economic measures of socioeconomic growth. This model also accounts for FDI, another variable that may have an effect on GDP per capita.
GDP is a dependent variable.
Unbiased factor: migration rate
Controlling factor: FDI
.png)
Model 2
A second model examines how migration affects the unemployment rate, which is a further economic development metric. Additionally, I take into account FDI as a potential factor affecting unemployment rates.
Unemployment rate is a dependent variable.
Movement rate is a dependent variable.
Controlling factor: FDI
.png)
Model 3
The third model calculates the impact of migration on life expectancy, one of the social development indicators. To rule out the potential of a fictitious association between migration and life expectancy, I additionally adjust for FDI.
Expectancy of life is a dependent variable.
Unbiased factor: migration rate
Controlling factor: FDI
.png)
Model 4
The final model calculates how migration affects HDI (Human Development Index). The HDI is the weighted average of GDP, literacy rate, and life expectancy.
HDI is a dependent variable.
Unbiased factor: migration rate
Controlling factor: FDI
.png)
Analysis Of Data
Model 1
The first model examines the effects of migration on economic growth, which is here represented by GDP. The panel data regression shows the results below. The one-way fixed effects model's ANOVA results show that the model's two individual fixed effects (FDI and migration rate) are jointly significant. The first model's F test score is 18.22. The null hypothesis, which states that all individual specific fixes might be removed or set to zeroes, is strongly refuted by the P value less than 1%. F test proves that at least one of my independent variables—FDI or migration rate—has a statistically significant impact on GDP, to put it in plain English.
R square reveals the percentage of variation in the dependent variable (GDP) that can be accounted for by each independent variable in the model (FDI and migration rate). The R square of 67.88 demonstrates that in this model, FDI and migration rate account for 67.8% of the variation in GDP.
Because the model's coefficients have t-values more than 1.97, it can be seen that the GDP is significantly impacted by the migration rate and FDI.
Model 2
The influence of migration on the unemployment rate is estimated by a second model. For this model, the ANOVA test shows that the F test equals 84.22, with a significance level under 1%. It demonstrates that at least one of my independent variables has a meaningful impact on unemployment and that the null hypothesis is rejected.
R square measures the proportion of variance in the dependent variable (unemployment) that can be accounted for by each independent variable in the model (FDI and migration rate). The R square of 0.8912 demonstrates that in this model, FDI and migration rate account for 89.1% of the variation in GDP.
The findings show that migration does not significantly affect unemployment because of its low t value. However, FDI affects migration in a statistically significant way. According to its t-value, significant FDI inflows slow down migration.
The outcomes of the panel data analysis of the first two models show that FDI and migration both have a significant effect on GDP. Migration, however, has no impact on unemployment. The influence of FDI on unemployment is significant. It is possible to infer from these findings that there is no connection between migration and unemployment, casting doubt on the notion that migration relieves governments of pressure and addresses the issue of unemployment in the sending countries, which typically have high unemployment rates (18% for Kyrgyzstan, 13.6% for Georgia, and 34.9% for Uzbekistan).
Model 3
My third model calculates how migration affects life expectancy. ANOVA test results for this model indicate that F test equals 18.58, with a significance level under 1%. This shows that the null hypothesis is not true and that at least one of my independent variables—FDI or migration rate—has a statistically significant effect on life expectancy. This model's R square is equal to 0.8756, which indicates that FDI and migration rate account for 87.5% of the variation in life expectancy. The model coefficients show that migration has no appreciable impact.
Adversely affects life expectancy (migration rate t value is negative but less than 1.97 in magnitude). On the other hand, FDI significantly increases life expectancy in a favourable way.
Model 4
My most recent model calculates how migration will affect HDI. The panel data regression findings show that F test is equivalent to 12.79 with a significance level less than 1%, indicating that the null hypothesis is rejected and at least one of the independent variables significantly affects HDI.
According to the model's coefficients, HDI is not significantly impacted by migration. FDI, however, does. The research of how migration affects social variables like life expectancy and HDI shows that, in contrast to FDI, which benefits these metrics, migration has no effect on them. It also implies that migration is not a significant factor in determining whether socioeconomic development is improving or declining.
Conclusions
The panel data analysis results confirm my theory regarding an instant positive effect of migration by showing that labour migration has a strong positive influence on just one economic indicator of growth, GDP (presumably because of the remittances). However, compared to the impact of inward FDI flows, its influence is statistically somewhat less significant. The findings also disprove my alternative hypothesis that migration has a large negative influence on social markers of progress, illustrated here by the Human Development Index and life expectancy.
Negatively impacts the socioeconomic growth of ECA. This is based on a smaller collection of data, though. Due to data limitations, I am unable to make additional observations that would raise the statistical significance of the findings. These findings also suggest that there may be other factors at play in the socioeconomic development of former Soviet Union and Eastern European nations, with FDI, for instance, having a more significant influence.
On the GDP, labour migration has a favourable impact. The idea that migration can raise living standards in nations with large migration rates, however, is called into question because of its weak impact on social variables.
There are a number of reasons why migration has neither a detrimental nor a positive impact on the socioeconomic growth of ECA counties. One of them is the fact that the data I used for this study came from official sources and did not include unofficial labour mobility numbers (especially for Central Asian countries). It might have an impact on the findings I came to, minimising the true influence of labour migration on the economic growth of recipient nations.
Many of the countries under study are still in the process of switching from central planning to more effective economic systems in their political systems. That could be another another reason why the effects of labour migration and remittances are still insignificant. In order to increase remittances and improve the efficiency of this process, political and financial institutions must continue to develop in a way that will efficiently govern the financial sectors.
Chapter Five
Case study: Impact of Labour Migration and Worker’s Remittances on Socio- Economic Development of Kyrgyzstan I examine the economic and social implications of labour migration and remittances on the socioeconomic growth of Kyrgyzstan in this part of my thesis.
Introduction
In Central Asia, migration is not a recent phenomenon. It has existed there historically in a variety of ways. The Great Silk Road, which linked several regions of Asia with Europe and "served as a transit corridor for people flows," passed through Central Asia (Schmidt and Sagynbekova, 2008). The nomadic tribes that resided there were likewise accustomed to the idea of seasonal movement from one area to another. Migration during the Tsarist and later Soviet Union eras took the form of Central Asian colonisation, which moved numerous people groups from the centre to the edges of the occupied lands (Schmidt and Sagynbekova, 2008). Then, during the Stalinist era, there was a forced exodus from the "European section of the Soviet Union to Central Asia" as a result of significant political and economic considerations (Schmidt and Sagynbekova, 2008).
This chapter investigates the effects of later kinds of migration and the remittances that followed them on the socioeconomic growth of Central Asian nations, with a focus on Kyrgyzstan. I'll start by outlining the main migration patterns throughout Kyrgyzstan's history. After that, I'll talk about the remittances phenomena and how it relates to labour migration. Following that, I'll try to
By examining the existing academic literature and utilising the dependency theory, make connections between remittances and socio-economic growth. By examining changes in Kyrgyzstan's socio-economic indices, I will also examine how remittances affect development. I'll wrap off with talking about the findings from this chapter.
History of migration in Kyrgyzstan
One of the 15 sovereign republics to form since the Soviet Union's collapse in 1991 is Kyrgyzstan. However, the history of the Kyrgyz people dates back to the year 840 AD, when nomadic Kyrgyz people occupied and ruled over the Tian-Shan mountain region.
The Kyrgyz nomadic tribes were known for their seasonal migration from one location to another in search of vegetation for their animals or during tribal conflicts. After the Central Asian region was colonised and added to the borders of Tsarist Russia in 1876, this way of life changed (Schmidt and Sagynbekova, 2008).
The process of colonisation was characterised by movement, which transported colonisers from the heart of the Russian Empire to its edges. Russian peasants were dispatched to Central Asia to take possession of native peoples' former lands. This is how the far boundaries of the Russian Empire were guarded. Native Americans resisted the occupation, which sparked a revolt in 1916. However, this opposition was brutally put down, and many Kyrgyz people were forced to flee by moving to nearby nations like Afghanistan and China.
Migration trends under the Soviet Union underwent another modification. The Soviet authorities determined that a nomadic lifestyle was ineffective, and the Kyrgyz people began the process of forcible settlement. During this time, numerous ethnic groups were forcibly transported to Kyrgyzstan, including Meschetian Turks, Germans, Koreans, Chechens, and others (Polian, 2004). This significant influx of individuals altered the ethnic makeup of the Kyrgyz population by reducing the proportion of native people.
With the fall of the USSR, new migration patterns appeared. When non-titular populations in Kyrgyzstan returned to their countries of origin, repatriation migration, which was based on the displacement of certain minority groups, replaced forced labour migration. Later, voluntary labour migration emerged during the post-Soviet era (Aidyngu, Hardin, Kuznetcov, 2006).
Following the fall of the Soviet Union, the newly independent states made varied decisions about their socioeconomic development that were influenced by the historical and economic forces that moulded their contemporary circumstances. Significant differences in the socioeconomic growth of the former Soviet Union countries have been caused by weak political systems, the presence or absence of valuable natural resources, and both.
One of the Central Asian nations that suffered greatly from the economic crises that followed the dissolution of the USSR was Kyrgyzstan. Kyrgyzstan's economy is stagnating as a result of a broken agricultural sector that was dependent on the "collective state farming" mentality, deindustrialization in the manufacturing, mining, and construction sectors, and the rise in the number of people who are working age (Marat, 2008).
The Kyrgyz government's inability to establish efficient political and economic structures was a factor in the nation's high unemployment rate, which led to a significant exodus of citizens. In 2002, statistics show that 1.3 million people relocated at least once in search of employment both domestically and abroad (Schmidt and Sagynbekova, 2008). The UN estimates that 20% of Kyrgyzstan's population is currently engaged in economic activity (UNIFEM, 2009).
New patterns of domestic and international migration emerged in conjunction with this process. One illustration of these tendencies is labour migration. It is linked to social and economic discontent that drives people to relocate to areas with greater job possibilities. According to the Government of the Kyrgyz Republic (2007), one of the main causes of widespread labour movement is still unemployment. There are between 500,000 to more than one million Kyrgyz working overseas, according to estimates (Marat, 2008). Kazakhstan, where Kyrgyz immigrants make up 30% of the overall immigrant population, and Russia, where they represent 50% of the whole immigrant population, are two of their preferred destinations (Tishkov, Vitkovskaja, 2005).
It is crucial to recognise that it is challenging to gauge the true extent of labour migration in Kyrgyzstan. One of the causes of such is the existence of unreported or illegal migration, as well as the Kyrgyz government's inability to address the urgent problem of the large-scale exodus of citizens from the nation (which is at ease with the current statistics) (Llense, 2008).
Labor migration and remittances
Labour migration has produced new types of socioeconomic phenomena and created new dynamics within Kyrgyzstan and Central Asia in general. The movement of labour is not a recent historical development. However, the outcomes brought about by economic migration are.
Remittances are the ideal illustration of the recent socioeconomic phenomenon connected to labour migration. The term "cross-border payments made by migrant workers to support people in their home countries" is used to describe them (Schrooten, 2006). Remittances are two different kinds of migrant transfers: wages paid to migrants who have lived abroad for more than a year or for a shorter period of time (Schrooten, 2006). The majority of migrant households view them as their primary sources of support (Tishkov, Vitkovskaja, 2005).
In terms of financial inflows, remittances are second only to foreign direct investment (Mansoor and Quillin, 2006). According to data from the IMF and the World Bank, migrant workers contribute significantly to a country's GDP. For instance, remittances account for 36.2% of GDP in Tajikistan, 27.4% in Kyrgyzstan, and 18.3% in Armenia (IMF 2008). Workers' remittances are not only an external source of income for nations like Tajikistan, Kyrgyzstan, and Armenia where remittances make up a sizable portion of GDP, but they are also a tool for addressing unemployment, which is a serious issue in these nations.
The economy of Kyrgyzstan is now mostly based on remittances. Although the actual amount paid by migrants is uncertain, official and alternative estimates indicate that it ranges from US$ 322 million to US$ 800 million (Aitymbetov, 2006). The quantity of remittances, which account for 27.4% of GDP, already exceeds the amount of FDI that comes into Kyrgyzstan, according to several World Bank research (Schrooten, 2006).
It is necessary to examine current theories of development, academic literature, studies in the field of migration and remittances, as well as define what socio-economic development is in order to properly comprehend the impact of remittances on the development of Kyrgyzstan.
The majority of the literature review for this work is based on my earlier research on this topic. Within academia, there are two ways to comprehend the significance of remittances and migration.
The first strategy is predicated on the notion that migrant payments have a favourable impact on social development. Workers' remittances and remittances in general, according to authors like Korobkov and Lev V. (2005, 2007), Ivakhnyuk (2006), Jones, Black, and Skeldon (2007), Admos, Piesse and Pinder (2003), Aitymbetov (2006), and others, can be particularly advantageous for developing nations. They contend that remittances can stabilise the economy by stimulating new investment, reducing poverty, averting hunger, and addressing unemployment issues. This group of academics employs case study or time-series cross-sectional analysis as methods. Samangan Aitymbetov, for instance, employs a case study methodology to examine how changes in consumption, income, and investment might help us understand how remittances have impacted the economic growth of Kyrgyzstan. Others, like Mechthild (2006), show through the use of panel data approaches that remittances are permanent and rise in correlation with domestic unemployment. They also demonstrate that the volume of migrant flows declines as GDP per capita rises and markets become more open as a result of global integration.
The second strategy is predicated on the notion that remittances have a detrimental effect on socioeconomic development (Dutch disease or brain drain). This academic pattern of thought is reflected in a number of thorough investigations (Acosta, Lartey, Mandelman, 2009; Agunias 2006; Cohen, 2005; Haas de Hain, 2007; Mechthil 2006; Shelburn and Jose Palacin 2007; Stuart 2006). These studies are based on claims that worker remittances may have a short-term positive impact on development but are unrelated to or have a long-term detrimental impact. Remittances, according to these authors, are a complicated phenomenon. They necessitate examining both the economic and other socio-political aspects of them in addition to the economic ones. To find the effects of remittance on development, they also try to apply other qualitative methodologies, such as partial and temporal scales of study, in addition to economic analysis of these phenomena.
The examination of the academic publications shows the complexity of this phenomena and the need to apply various scientific methodologies and methods that can support the creation of solid links between remittances and socioeconomic progress.
Socio-economic development
In Kyrgyzstan, "socio-economic structural changes" (Economic Development, 2009) that have an impact on the political, social, and economic realms of the nation are what I mean when I refer to a process as "socio-economic development." Improvements in living standards, including rising income and bettering health and educational systems, serve as indicators of these changes (Jaffe 1998). Development is based on advancements in the economy, politics, and society. Peterse (2002)
In order to calculate the effects of migration and remittances on Kyrgyzstan, I also use structural as well as functional methodologies from dependency theory and social development theory. Each of these strategies represents divergent views on how migration and remittances affect society. According to me, both viewpoints can be used to assess the positive and bad effects of remittances on the socioeconomic development of Kyrgyzstan. The functional approach, which suggests that foreign capital (in this example, remittances) can be re-invested in the local economy to stimulate economic growth, is a compelling argument made by certain scholars, can be used to explain the positive benefits of remittances (Aitymbetov, 2006).
The structural approach, which contends that reliance on foreign money thwarts development by posing major long-term economic and social repercussions, can be used to explain why remittances have negative effects. Remittances are a form of financial flow, and a nation's capacity to grow its economy is hampered by an excessive reliance on them. Remittances, according to the argument, can harm social-economic development by causing a "brain drain" effect or the Dutch disease, which raises the prices of nontradable goods, appreciates exchange rates, which drives out of business producers of tradable goods, and also leads to social complications in the form of widening economic disparities. According to some authors, excessive remittance flows in a nation enhance household earnings and, consequently, consumer spending on non-tradable items like real estate, services, water, and energy, among other things, at the expense of the tradable sector. It can potentially lessen the good effect of remittances as a strategy for reducing economic inequality by pushing prices up in the nontradable industries (Acosta, Lartey, and Mendelman, 2007).
In my earlier research on this subject, I tried to gauge the overall impact of remittances by performing a panel data regression analysis of 18 ECA nations. Here, I examine the effect of remittances on Kyrgyzstan particularly. I'm interested in seeing how some socio-economic metrics change as remittance inflows rise.
Gross Domestic Product (GDP) per capita, Foreign Direct Investment (FDI), exports as a percentage of GDP, output by sectors as a percentage of GDP, unemployment, private consumption, net migration rates, and life expectancy as social variables is all indicators of socioeconomic development and serves as my dependent variable.
Remittances in US dollar millions make up my independent variable. I'll examine how changes in those dependent variables are impacted by increases in remittance volume.
My first graph contrasts variations in GDP with variations in remittance inflows. The graph shows that there is a significant correlation between rising remittances and rising GDP. My earlier empirical work that discovered a link between these two variables supported this observation.
.png)
Figure 1. Impact of remittances inflows on change in GDP
The second graph compares changes in remittance inflows to changes in unemployment. According to the graphic, unemployment does not alter (it does not decline as anticipated) in response to increases in remittances, indicating that there is no clear relationship between them.
.png)
Analysing changes in FDI in relation to remittances is shown in the third graph.
.png)
From the graph, it can be seen that when remittances rise, the amount of FDI stops expanding, indicating that remittances have an impact on FDI inflows into the nation as a separate financial source. The fourth graph illustrates the evolution of net migration in relation to remittances. According to the data, remittance growth does not appear to have a significant impact on net migration, indicating that there is little correlation between these two variables.
.png)
The fifth graph describes changes in life expectancy with respect to remittances.
.png)
It demonstrates that raising remittances has no effect on the life expectancy variable, indicating that there isn't a direct correlation between the two. The impact of rising remittance inflows on private consumption is depicted in the sixth graph. As can be seen from the graph, private consumption rises as remittances rise. (Remittances are shown here in thousands.)
.png)
The next graph demonstrates how remittances affect export.
.png)
The graph's data demonstrates that rising remittance inflows have a marginally negative impact on exports inside the nation. The last graph shows how remittances have changed across various economic sectors.
.png)
According to the data in this graph, growing remittance inflows benefit the services sector more than the industry sector.
Remittances therefore only have a significant impact on GDP growth and increases in private spending; they have a negligible but nevertheless beneficial impact on the expansion of the portion of the Kyrgyz service sector. Other socio-economic indices are not significantly improved by them overall. Furthermore, remittances may have a long-lasting detrimental impact on economic growth, particularly in sectors like industry and exports. These conclusions are in line with my earlier empirical research for a panel of nations.
The importance of this case study, in my opinion, stems from my attempt to examine remittances not only from macroeconomic perspectives, which have already been thoroughly explored by other economists, but also from social perspectives, by examining how they affect social indicators of development like migration and life expectancy.
I used a case study approach to conduct my analysis, which allowed me to focus on Kyrgyzstan as one country and include several socio-economic variables that were not accessible for a group of nations. Additionally, it enabled me to more precisely assess individual cases' effects of migrant payments on socioeconomic systems.
There are many advantages to comprehending how worker remittances affect the economy. First of all, it can offer practical tools for developing public policies that can foster favourable circumstances, such as lowering transaction costs or "strengthening a formal remittances infrastructure" for luring even more inward remittances, particularly in those nations that heavily rely on them (Ratha 2009). Second, it can be useful to create plans that will avert or lessen the long-term detrimental effects of remittances on socioeconomic growth. The results for Kyrgyzstan indicate that remittances have two distinct effects. They do, in fact, raise the GDP per capita. On the other hand, they have a detrimental impact on the industrial sector, which may have a long-term, extremely detrimental impact on the Kyrgyz economy.
Chapter six
Political Impact of Globalization. Liberal Democracy and socio- economic development: China and India as a model for comparison of Kazakhstan and Ukraine
I examine the subject of globalisation and development from the viewpoints of political regimes in this chapter. I examine the phenomena of (Western model) democracy as a tool for gauging globalisation and examine the relationship between emerging nations' adoption of liberal democratic forms of governance and their economic progress.
Contrary to what some academics assume, this chapter makes the case that liberal democracy is not a need for effective economic development (Held, Goldblat, Perraton, 1999). For a comparison analysis of former Soviet Union nations like Kazakhstan, an authoritarian nation with a powerful economy, and democratic Ukraine, with significant economic issues, I use economically successful China (authoritarian regime) and India (the greatest democracy), which is currently lagging behind.
According to my theory, there are other economic factors that contribute to development in addition to a democratic political system, which is an important component of progress but is not a requirement for it. I use democratic theory, which aids in the analysis of various variables that could affect development, to support my claim. According to preliminary findings, democracy has no negative effects on effective socioeconomic development.
The previous few decades have seen an unparalleled rise in globalisation, which is frequently linked to the doctrines of neo-liberalism and democratisation. It is a complicated phenomenon that affects many different facets of society. I try to simplify it by focusing on only two aspects of globalisation: politics and economics.
I also focus on Central Asian nations who are still figuring out how to fit into the globalised, capitalist world. The socio-economic effects of globalisation, including migration and remittances, as well as how they affect the development of Central Asian nations, were covered in earlier portions of the thesis. Based on a panel data analysis of the nations that made up the former Soviet Union and a case study of Kyrgyzstan, I came to the conclusion that globalisation, as measured by migration and remittances, has had no positive impact on those nations. Additionally, there are detrimental long-term effects that could hinder successful socioeconomic growth.
I want to examine the political side of the globalisation phenomena in this chapter and how it affects socioeconomic growth. I choose democracy as a proxy for globalisation because, in certain definitions, it is either synonymous with or frequently occurs alongside it (Scholte, 2005). By examining and contrasting democratic and nondemocratic nations, as well as the degree of their socioeconomic development, I seek to establish a link between democratic regimes and development. I'm attempting to demonstrate that democracy cannot be the only important factor influencing progress. To support my claim, I combine quantitative (basic regression analysis) and qualitative (analysing social and economic variables of specific nations) methods. Then I conduct a case study by examining socioeconomic indicators in China and India and later contrasting them with Kazakhstan and Ukraine, nations that have some political and economic characteristics with China and India.Globalization's political aspects are frequently linked to ideas of democracy, international organisations, social movements, and NGOs ( Thorup, Sirensen, 2004).
This understanding of globalisation is based on liberal/neoliberal traditions, which contend that democratic institutions are a requirement for development (Smith, Baylis and Ownes, 2008). According to scholars like Huntington, Shin, and Diamond, the rise of democratic governance since the end of the Cold War has accelerated globalisation, which has not only helped topple military and communist regimes around the world but also accelerated economic development in many developing nations (Scholte, 2005).
Here, I want to take a new tack on a liberal philosophy that asserts democracy fosters growth. The existence of non-democratic nations that have seen significant economic growth led me to propose my major research issue, which aims to establish a link between democratic system and development.
My primary method for gauging globalisation is democracy. The Economist Intelligent Unit's Democracy Index, which was created to symbolise democracy, is used here. Utilizing aggregate indices like the Human Development Index (HDI) and Index of Economic Freedom, socioeconomic development is quantified.
Because they are congruent with the criteria of liberal democracy and socioeconomic development used in my thesis, one of the reasons I chose to utilise these indices as my primary political indicators of globalisation is because they are employed in the study. I am aware, however, that there are several constraints that have an impact on my findings and prevent me from drawing firm conclusions regarding the connection between democracy and socioeconomic progress. One of them is the application of the Index of Economic Freedom and the Democracy Index to the nations of the former Soviet Union. Some Central Asian nations are still regarded as being in the process of shifting from a centrally planned to a market economy, despite all statements that they are moving in that direction. Because of this, several of the indices' indicators are unable to accurately reflect the political or economic climate in various Central Asian republics. The fact that aggregated indexes often do not always cover all pertinent components is another issue. For instance, the Index of Economic Freedom takes into account a number of variables that are crucial for economic growth, but it ignores the power of entrepreneurship, which is a crucial component of economic growth in China, the country I used as a comparative comparison model in my thesis. One of the greatest issues with the Human Development Index is that it does not take into account "a gap between industrialised and underdeveloped countries" (Anand and Sen, 1994).
The importance of this study, in my opinion, is in its attempt to investigate liberal principles from a fresh angle rather than drawing conclusions about the benefits or drawbacks of democracy for economic growth. A result of that could be important, particularly if it is in line with empirical research conducted by eminent political scientists and intellectuals. The foreign policies of hegemonic powers toward the developing world may be changed in the future as a result. Regarding developing nations, realising that democracy does not equate to steady socioeconomic development can influence their decision to adopt alternative forms of governance to the western model that will take into account the political, social, and cultural diversity among nations and perhaps avert the possibility of cross-cultural conflicts.
Before I can analyse how political regimes affect development, I need to identify the terms that will be used in this chapter and evaluate the literature to find the theories and methodologies I can utilise for my research.
Definitions of democracy, authoritarianism and socio-economic development
Democracy is a very complicated phenomenon with many different views and definitions that represent different situations (Fish, 2008). Many of them were created within the topic of comparative politics. Joseph Schumpeter created one of the most popular definitions of democracy, seeing it in the context of free elections (Fish, 2008). Later, a number of well-known academics, including Huntington, Di Palma, Sartori, Shapiro, and Dahl, adopted this strategy to further their own definitions and ideas about democracy. In my view, the 1982 definition of democracy by Robert Dahl encompasses all variations on this theme. It states unequivocally that for a society to be considered democratic, there must be elections, the right to vote and run for office, the freedom to engage in political activity, access to the press, and freedom of speech (Fish, 2008).
A different meaning of democracy is closely related to Dahl's idea. Stephen Fish, who measures political regimes (which democracy is) in terms of levels of openness, came up with the concept. He argues that a system is democratic if everyone is free to participate in politics, there is open competition, and political discourse is free to flow (Fish, 2008).
He also provides a definition of authoritarianism, implying that this idea is not quite a suitable contrast to democracy. In contrast to the idea of democracy, which entails a rule by the people, it suggests a strict rule but makes no mention of the ruler (Fish, 19). Fish proposes using the notion of monocracy, a sort of supposedly authoritarian government centred on "ruling of a unified collective actor (person or party) and where political life is closed to everyone else" (Fish, 2008).
I refer to the nations in my case study—China, India, Kazakhstan, and Ukraine—as monocracies and democracies based on these categories.
As a gauge of democracy, I also use the Democracy Index. It examines civil freedoms, the operation of the government, political engagement, and political culture in addition to the electoral process and pluralism (Economist Intelligent Unit, 2008).
Another key idea that is relevant for my research is socio-economic development. According to Economic Development (2009), socio-economic development refers to a process of "socio-economic structural changes" that have an impact on a nation's political, economic, and social realms. Improvements in living standards, including rising income and strengthening health and educational institutions, serve as a proxy for these developments (Jaffe, 1998). Development is built on economic expansion, political modernisation, and social progress (Pieterse, 2001).
In my research, the Human Development Index—which was created in 1990 by the United Nations Development Program—is used to measure socioeconomic progress. By "combining metrics of life expectancy, educational attainment, and income into a composite human development index," it assesses socioeconomic development (Human Development Report). It primarily evaluates three facets of human development: education, health, and adequate living conditions.
I also gauge progress using the Index of Economic Freedom. It was created in 1995 by the Wall Street Journal and the Heritage Foundation, and it includes categories such financial freedom, investment freedom, business freedom, trade freedom, government size, property rights, anti-corruption, and labour freedom (Wall Street Journal and Heritage Foundation, 1995). In essence, "these categories constitute the essential components of the concept of economic freedom, which is a basic human right to govern one's own labour and property. Individuals are free to work, create, consume, and invest in any way they choose in a society where economic freedom is both safeguarded and unrestricted by the government. Governments in economically free societies permit the free flow of labour, capital, and goods and refrain from restricting individual freedoms in excess of what is essential to uphold and safeguard that freedom. Heritage Foundation and the Wall Street Journal,1995.
Theoretical background and literature review
I choose to look at democratic theory because my topic is liberal democracy and how it affects development. I discovered that both the theory and the definition of democracy are difficult. There isn't just one theory. On the other hand, there are numerous democratic theories and academics who advocate them, and each of them addresses a different facet of democracy. Shumpeter (1950), Huntington (1968), Dahl (1971), Huntington and Dominguez (1975), and O'Donnell (1973) were among the academics who focused on the influence of democracy on a society's social, political, and economic facets.
For the purposes of the thesis, I would like to focus just on the liberal democratic theory's economic component, which is concerned with economic freedom, which includes private property and business ownership, free markets, and a minimal role for the federal government. The fundamental tenet of this strategy is that sustainable economic development requires a background of democratic political and economic institutions.
Many academic publications that contend that democratic regimes favourably influence socioeconomic progress reflect this understanding of democracy (Thaker, 2007; Halperin, Siegel, and Weinstein, 2005; Grosgean and Senik, 2008; Prezworski, 2004). A compatibility perspective is the name given to this method.
However, a conflict viewpoint, which contends that democracy impedes economic growth and development, represents another academic take on this problem. The growth of democracy, according to academics like Walter Galenson, Karl de Shweinitz, Huntington and Domingues, Huntington, (1975), Huntington, (1968), Barro, (1998), and O'Donnell (2001), is accompanied with a problem of redistribution and an increased role for interest groups. This method views democracy and economic development as opposing forces. Weak democratic institutions are unable to implement economic programmes effectively; hence economic progress requires a strong authoritarian regime (Sirowy and Inkeles, 1990). According to the modernization thesis, economic growth—not democracy—is what actually encourages democracy (Lipset, 1959).
Both qualitative and quantitative methods have been used to test all of those theoretical frameworks. Case studies that examined the effects of democracy on emerging nations in Latin America, Eastern Europe, Africa, and Asia were used in qualitative research (Chen, Liang-chih,2009; Bruce Bueno de Mesquita and George Downs, 2005; Morton H. Halperin, Joseph Siegle, Michael M. Weinstein, 2005) Cross-sectional analysis (Neubauer, 1967; Diamond, 1992; Muller, 1995; Przeworzky and Limongi, 1993; also Przeworzky, 2005) and simultaneous equation models were used in quantitative investigations (Rafael Reuveny and Quan Li, 2003).
It is evident from a review of the academic literature that no research has been done on the Central Asian region.
Hypothesis and research design
An examination of academic literature reveals unequivocally that, despite the complexity and contentiousness of the democratic debate, the compatibility of democratic and economic development has been growing over the past two decades, which is strongly in line with the rapid spread of globalisation (the adoption of the western political and economic paradigm) throughout the world. However, based on a review of the research, I offer a hypothesis that contends that democracy is not a prerequisite for socioeconomic growth and development. The best examples of that are various countries in Latin America (Argentina, Chile in the late 1970s), East Asia (East Asian Tigers between 1960 and 1970), modern China, and Central Asian nations (current times) (Thacker, 2007).
Research design
I must utilise both quantitative and qualitative methods to test my theory. I compare socioeconomic indicators of transition democracies (like India and the Ukraine) with those of monocracies like China and Kazakhstan using a straightforward regression analysis and a case study. Economic growth and development, as measured by the GDP, HDI, and Economic Freedom Index, are my dependent variables.
Democracy, as determined by the Democracy Index, is my independent variable. It is crucial to note the index scaling here since I utilised it for both a regression analysis and a case study.
Full democracies receive ratings of 8 to 10 on the Economist Intelligence Unit Index of Democracy:
Full democracies - scores of 8-10.
Flawed democracies - scores of 6 to 7.9. Hybrid regimes - scores of 4 to 5.9.
Authoritarian regimes - scores below 4.
According to the Wall Street Journal and Heritage foundation's Economic Freedom Rankings:
Each of the ten freedoms is rated on a scale of 0 to 100, with 100 being the greatest degree of freedom. A score of 100 denotes the greatest free-market-friendly economic climate or set of policies (Heritage Foundation).
Index of Human Development (HDI)
There are 0 to 1 HDI scores (1 indicates high human development)
Case Study: China
China's economy is currently one of the fastest expanding in the world, and it is a significant player on the global stage. It actively engaged in extending its sway not just in East Asia but also in the resource-rich Central Asian region, which is essential for China's erratic 9.9% - 12% annual economic development according to a World Bank report, 10.1% in 2004 and 2005 (2005).
According to Stephen Fish, the political system in place there is one-party communist dictatorship, and it has been successful in reforming the economy by "limiting the significance of ideology in economic policies" (state.gov). By increasing trade, especially with the US where imports from China accounted for 16.1% of all US imports in 2008 (state.gov), bringing in more FDI ($69.5 billion annually), and taking part in projects for economic liberalisation, China has significantly reduced poverty and raised living standards (GDP per capita is $4,644).
China is still viewed as a monocracy where all power belongs to a highly centralised political institution because of the communist party, which does not tolerate any form of disobedience or criticism of the regime and frequently results in violations of human rights. This is true even though China has made significant economic progress.
India
India, the world's 12th largest economy and another quickly emerging nation that competes with China for a dominant position in the area, is ranked fourth in the world in terms of absolute Gross National Income, behind the US, China, and Japan (Srinivasan, 2006).
Since 1991, when significant economic reforms began to take effect, India has remained steadfast to the fundamentals of a market-oriented economy. Reducing trade and tariff obstacles, modernising the banking system, expanding trade ties with other nations, and creating a climate that encourages foreign investment all contributed to bringing in $16.9 billion in yearly foreign investment (state.gov). Reforms also raised some standards of living, such as the $2,469 GDP per capita.
The political system in India views itself as a democracy. Nevertheless, despite having 1.1 billion people and being the second-largest democracy in the world after the US, it is still falling behind China. Compared to China, its socioeconomic statistics like GDP and HDI are substantially lower. 6.4% of the population is unemployed, 61% of adults are literate, and 25% of people live below the poverty line. These metrics are 4%, 90.9%, and 8% in China, respectively.
Kazakhstan
One of the former Soviet Union nations to emerge after the Soviet Union's fall is Kazakhstan. According to state.gov, it is the ninth-largest nation in the world and one of the developed nations in the Central Asian region with a wealth of natural resources. It has 15.6 billion people and a $9,832 GDP per person. According to the Human Development Index, Kazakhstan is a medium-developed nation with a 7.3% unemployment rate, a 13.8% poverty rate, and a 98.4% literacy rate.
Kazakhstan decided to follow a path of democracy after winning independence in 1991, which included actively pursuing economic liberalisation and embracing a western-style of government. Contrary to political reforms that moved away from democratic rule and toward old-style Soviet rule, which was centred on the idea of unlimited control of one leader or party, economic reforms turned out to be successful. The current political system of Kazakhstan can be characterised as a monocracy with a powerful institution of the presidency.
Oil and gas exports from Kazakhstan were aided in part by the country's economic prosperity. However, it was the strong leadership that enabled "effective management of monetary policies" (state.gov) In 2000, Kazakhstan became the first nation from the former Soviet Union to pay off all of its debt to the IMF (state.gov). Additionally, the leadership was able to raise overall living standards, which requires competent administration and a certain amount of control.
Ukraine
Another former Soviet Union nation that formed with the collapse of the USSR is Ukraine. It is the biggest nation in all of Europe. It shares a similar starting point with Kazakhstan to some extent. Like many other former communist nations in the area, Ukraine began its existence in 1991 and followed a path toward Western-style administration, which was reflected in the way its political system was structured, which was founded on the concept of checks and balances. Every one of Dahl's democratic requirements, including election freedom, had been met. As a result of widespread electoral fraud and abuse of power in 2004, Ukraine experienced the so-called "Orange Revolution," which began when voters defended democratic ideals like "free and fair elections." The pro-western government was formed as a result of large-scale but largely peaceful demonstrations, and it would continue to uphold western democratic ideas (stat.gov) Despite the success of the democratic ideology, Ukraine's economic progress has lagged behind Kazakhstan. It has 46.8 million people, a GDP per capita of $6,212, and a 6.9% unemployment rate. Its HDI is nearly identical to Kazakhstan's. However, the percentage of the population living in poverty is almost 29%. (2006). Ukraine's FDI flows ($5.2 billion vs. 6.1%) and GDP per capita are lower than those of Kazakhstan, which may indicate that economic reforms failed to establish an atmosphere that would have attracted greater FDI and investors in general. In my opinion, it occurs because democratic administrations, like those in India or Ukraine, are unable to deliver the political and social stability that strong leadership can, even if it means using coercive force to suppress discontent.
I selected those nations for a number of reasons. Regarding their historical backgrounds (all four were once colonies), political systems (monocracies and democracies), human resources (huge populations), and political and economic objectives, I believe there are certain commonalities among them all (both China and India want to be regional political leaders in Asian region as well as Kazakhstan and Ukraine in Central Asian and Eastern Europe respectively).Based on a brief examination of fundamental indicators for those nations, it can be inferred that those nations have more successful outcomes consistent with O'Donnell's theory of bureaucratic authoritarianism, which calls for strong leadership and better political and economic management in authoritarian regimes (1988). According to this, "developing nations must have a robust bureaucracy that can guide the nation toward modernity" (Nozari, 1999). According to this strategy, a strong state is created and intensive socioeconomic development is promoted, as in China and Kazakhstan, through "industrial capitalism, imperialist expansion, and rationalisation of bureaucratic order" (Chicollte, 1994).
India and Ukraine are devoted to democratic ideals. However, the absence of effective leadership and management greatly retards their socioeconomic development, as can be seen by examining the lower HDI, which measures income, literacy, and life expectancy, and the smaller quantity of FDI.
Empirical analysis
I have created two models that explain ad hoc links between socioeconomic progress and democracy using a straightforward regression analysis.
Model 1 examines the overall effect of democracy on GDP using information from 154 countries.
.png)
I have created two models that explain ad hoc links between socioeconomic progress and democracy using a straightforward regression analysis.
Model 1 examines the overall effect of democracy on GDP using information from 154 countries.
Even if a formal regression analysis indicates that there is a statistically significant link between these two variables (its t-value is 8.51), a closer look at the graph reveals that this conclusion may be deceptive.
Impact of democracy on the Human Development Index as measured by Model 2
.png)
The relationship between democracy and the human development index is incredibly weak—almost nonexistent. The distribution of the regression line indicates that there are numerous countries with high HDI and low democracy index (mainly former communist bloc nations plus China). There are nations with high HDI scores as well as high democracy scores. There are some nations with high democratization indices but low HDI. A sizable number of nations have middling HDI and democratization scores. These findings show that any conclusion is possible. A person may contend that there is a link between democracy and development, or they may contend that there is no connection between democratic regimes and socioeconomic progress.
Conclusions
I can demonstrate my claim that democracy is not a prerequisite for effective economic development on the basis of data comparison and regression analysis. Democracies can exist in nations with low or moderate socioeconomic development (HDI), like India or Ukraine. Additionally, they may be undemocratic and advanced (China or Kazakhstan). It is necessary to consider economic, geopolitical, and social aspects in addition to political regimes in order to have a complete picture of the variables that affect and foster progress.
Chapter seven
Impact of globalization on political development of the Central Asian countries
The earlier parts of this thesis discuss the political, social, and economic effects of globalisation as measured by migration, remittances, and liberal democracy. To determine how globalisation processes affect socioeconomic growth, I strive to use both empirical and qualitative methodologies.
In this chapter, I examine how the political evolution of the Central Asian nations is impacted by globalisation. I am particularly interested in how these governments respond to the new political and economic reality brought about by globalisation and develop their interactions with other nations. I understand the global issues brought about by the opening of political and economic borders to mean the new political and economic realities. The emergence of new international players in the region, the fight against terrorism, drug trafficking, and the management of natural resources have compelled the leaders of the Central Asian countries to come up with strategies and solutions that would not only address these issues but also safeguard their own political and economic interests (International Relations in Central Asia, 2004)
Hypothesis
The fundamental hypothesis is that these governments prioritised the growth and preservation of political and economic stability by prioritising functional collaboration, one type of regionalism, and to some extent regional integration, notably in economic domains (Baylis, Smith, and Own, 2008)
After the Soviet Union fell apart, five new Central Asian entities were created. The territory that was seen included Tajikistan, Kazakhstan, Kyrgyzstan, Uzbekistan, and Turkmenistan. Additionally, other researchers mention Mongolia, regions of Iran, Afghanistan, and northwest China, which are heavily populated by Turkic people (ADB, 2008). The nations of Central Asia are similar in terms of their cultures, religions, and ethnicities. With the exception of Tajikistan, which has Persian roots, Turkic roots can be found in Kazakhstan, Kyrgyzstan, Uzbekistan, and Turkmenistan. They all regard themselves as Muslim nations with comparable customs. They do not, however, all share the same level of socioeconomic development. Every nation has distinctive qualities. For instance, with a population of 27 million, Uzbekistan is the country in Central Asia with the greatest transportation network (Swanstrom, 2004). After Russia, Kazakhstan is the former Soviet Union country with the most land area, the greatest nominal GDP ($6,791), and the most abundant oil reserves (CIA, 2007). More than 90% of Central Asia's water resources are under the jurisdiction of Tajikistan and Kyrgyzstan (Primbetov, 2006). Due to its borders with three Central Asian republics and being along a land route between the Indian subcontinent and resource-rich Central Asia, Afghanistan has a distinct strategic significance in the area. These distinguishing characteristics have caused the leaders of the Central Asian governments to reconsider their positions in the area and on the global stage, deciding between the pursuit of individual aims and group efforts in the form of cooperation. The problem can be solved by looking at the difficulties that newly independent nations have encountered.
Following their independence in 1991, Central Asian republics have been actively rebuilding their national statehood institutions. However, the lack of trust among Central Asian nations, their poor economic growth, and the appearance of new foreign actors seeking to influence the region's politics and economy have hampered the changeover process. Since then, post-Soviet Central Asia has had to deal with a number of significant problems brought on by both local and international factors. Interdependence across regions, illegal drug trafficking, water resource management, international crime and extremism, immigration, and the expanding power of Russia and China.
Regional Challenges
Lack of institutional framework and economic interdependence that these states inherited as a result of Soviet Union legacy, which have been impeding states' ability to pursue their own sovereign policies and engage in economic activity, was one of the biggest local challenges that Central Asian countries have been facing since gaining independence (Zhalimbetova and Gleason, 2006). During their early years of independence, Central Asian governments experienced a socioeconomic collapse due to their intricate economic, political, and social connections.
The management of water resources, which was formerly overseen by Moscow through intergovernmental cooperation, is another issue that surfaced right away after the fall of the Soviet Union (UNDP, 2005) Independence has given each state the freedom to follow its own water distribution strategies, which has increased the risk of conflict in the area where water is a major resource. For instance, Kyrgyzstan and Tajikistan are in charge of almost 90% of the region's water resources. One of the major water providers to all republics, Kyrgyzstan has already cut back on delivery due to technical issues. Mismanagement of water resources has also led to more serious issues, like the drying up of the Aral Sea, which has an effect on Kazakhstan's and Uzbekistan's agricultural sectors.
Other significant issues for the region include the illicit drug trade, international crime, and terrorism. Huge illicit drug flows, particularly from Afghanistan, use Central Asia as a transit route to reach the main demand centres in Europe, Russia, and China (www.globalsecurity.org). High demand, a lack of local institutions, and a lack of cross-border collaboration have all contributed to the situation's deterioration and the growth of transnational crime. Due to the demarcation of area during the Soviet era, Central Asia has inherited border conflicts with one another. The Fergana Valley, which is at the intersection of three states and three ethnic groups (Kyrgyz, Uzbek, and Tajik), was created as a result of the same demarcation of the territory and is now a hotbed for several militant and religious organisations that successfully hide there from Tajik and Uzbek authorities and periodically disrupt the situation in those nations.
Global Challenges
One of the largest international problems for Central Asian nations was the emergence of new players like Russia, China, and the USA, all of whom were anxious to fill a void left following the disintegration of the USSR. Each of these states has been eager to increase its sway in the area.
With the opening of an air base in Kyrgyzstan in 2003, the expansion of bilateral agreements with Kazakhstan to lease four military test sites, the signing of a security package with Uzbekistan known as the "Treaty of Allied Relations" in 2005, and a joint military exercise with Uzbekistan in 2006, Russia has been regaining its influence in the Central Asian region (Vinod, 2006). In order to preserve its control over Turkmen gas supply, Russia also maintains close ties with Turkmenistan (Fawn, 2003). Some Central Asian nations, especially Kazakhstan, view Russia as a major threat given its expanding influence. According to certain statistics, 31.6% of ethnic Kazakhs (just behind China) see Russia as a severe threat to Kazakhstan's sovereignty (Cornell, 2003).
Another significant player to emerge in Central Asia is China, which has its own objectives for expanding influence there. One of these is the Xingjian autonomous province, which is located in the Chinese portion of Central Asia and is heavily populated by Turkic peoples of various ethnicities, including Uyghur, Kazakh, and Kyrgyz, and which is unwilling to integrate into Chinese political and economic frameworks (Engdahl, 2005). Four Turkic states declaring their independence has compelled China to monitor the operations of Uygur militant groups pushing for Xingjian's independence. Energy reserves in Central Asia are a major concern for China as they are essential for its economic development. It has already completed one section of a pipeline from Kazakhstan to Xingjian that will run from West China to East Kazakhstan and be able to transport 10 million tonnes of oil annually. Additionally, China was able to reach an agreement with Petro Kazakhstan, a Canadian oil business that was recently purchased by China National Petroleum Corporation in 2005. As a result, China now has access to Kazakh oil (Allouche, 2007). Additionally, China has shown interest in the hydropower potential of Tajikistan and Kyrgyzstan, which together control over 90% of the water resources in the region and are crucial for Western China, which is experiencing a massive state-sponsored population influx into this region that is dependent on the agricultural sector (ICGR, 2007). However, China's economic and commercial progress in the region, which fuels worries of Chinese control among the local populace, is the biggest threat to Central Asian states. Following the uprisings of 2001, Kyrgyzstan and China secretly signed a border agreement that would grant China an additional 90,000 hectares of land providing access to a glacial watershed that is crucial for Western China, which is frequently water-scarce (Cornell, 2003).
The US is another significant player in Central Asian politics that has actively stepped up its influence after the events of September 11, altering the region's "geopolitical map" and posing new problems for the region's republics (Vinod, 2006). The US began vigorously implementing Western policies for the democratisation of the Central Asian states and other former Soviet Union republics as soon as it entered the region under the cover of the War on Terror. The US actively supported "coloured" revolutions that were occurring in many former Soviet Union nations. It also welcomed the Kyrgyz Tulip Revolution, which was supposed to instal an American-friendly administration but did not. By opening military facilities in Kyrgyzstan and Uzbekistan and allowing the US military and NATO to conduct operations in Afghanistan over Tajikistan and Kazakhstan airspace, it has also begun to expand its military footprint. Due to the slaughter in Andijan, the US was forced to leave its air base in Uzbekistan in 2005. Weakening Russian control in the area and gaining access to oil, gas, and routes that connect the Sub-Indian continent and resource-rich Central Asia and serve as a potential route to Iran and the Middle East are two of the key motivations for US participation in the region. (2006) Miller
The Argument
The regional and global forces that influence the region's security dynamics and conditions have led to political strategies in Central Asian nations that can be characterised as a balancing act between internal and external players. The Central Asian governments have prioritised regional collaboration as a means of effective growth and preserving stability in light of such balancing. To address shared problems and safeguard their own interests, they have chosen to actively participate in international institutions. The majority of Central Asian countries are currently active participants or observers in a number of international organisations, including the OSCE, Eurasian Economic Community, Shanghai Cooperation Organization, and Commonwealth of Independent States.
This chapter's analytical framework is based on examining the phenomenon of cooperation among Central Asian states from the perspective of liberal institutionalism, which contends that participation in such institutions encourages cooperation, which in turn fosters economic development and political stability.
Liberal institutionalism acknowledges the egocentric motivations of nations. Assuming that these selfish interests of individual nations are not fundamentally at odds with one another and that states have incentives to collaborate or not cooperate, it focuses on explaining patterns of regional cooperation (Brown, 2006). Through international institutions, they can get over their selfishness (Walt, 1998). The "Complex interdependence" theory, created by the liberal institutionalists Robert Keohane and Josef Nye, contends that economic interdependence and other types of interdependence (interstate, transgovernmental, and transnational) that involve international institutions should raise the likelihood of cooperation among states (Keohane and Nye, 1989). Additionally, "certain forms of collaboration might be the most logical method for governments to accommodate national needs" (Baylis, Smith and Own, 2008). Keohane and Nye also make the argument that due to economic and political interconnectedness, the costs of ceasing cooperation will be greater than the advantages.
My analysis of the available literature on this topic reveals several of the prior studies' shortcomings. One of them is the dominance of the realist perspective in explaining the evolution of international politics in the area. As a result, many academics and political analysts are gloomy about the chances of collaboration, which may be advantageous for the countries of Central Asia's political and economic stability. Because of this, I approach this problem from the standpoint of liberal institutionalism, which is, in my opinion, the most useful framework for doing so.
Regional Cooperation versus Integration
Political, economic, and security cooperation have evolved into a decision that has characterised the foreign policies of those countries as a result of the shared challenges that all Central Asian states have faced in the face of regional and global influences.
Since Central Asian countries predominantly engage in functional cooperation, which is a kind of regionalism, with some attempts at integration, notably in the domain of economy, it is crucial to define cooperation here and explain how it varies from integration, which is significant for this study (EEC).
Cooperation is one of the characteristics of regionalism, according to Edward Best and Thomas Christiansen, a process that refers to "the expansion of societal integration within a region and often involves economic and social interaction" (Baylis, Smith and Own, 2008). However, because each region and its inhabitants are distinct, there are diverse ways in which they interact "between the various dimensions and dynamics of regionalism" (Baylis, Smith and Own, 2008). There are two well recognised types of regionalism. It is regional integration and practical cooperation.
Functional cooperation is a term for restricted or focused agreements between governments that work to unite nations on specific concerns like security or resource management. Under functional cooperation, there is some "commercial preferentialism with no harmonisation of domestic regulations or requirements for collective action in international issues" in the economic relationships between the states (Baylis, Smith and Own, 2008). Political cooperation is the commitment of nations to address specific concerns, like security, and is based on adopting shared stances in international organisations, like the SCO, and occasionally collaborative actions, such participating in military drills within the SCO. Unlike regional integration, which refers to the removal of barriers to create a unified political or economic space like the EU, functional cooperation assumes that states will participate in cooperation arrangements to solve immediate problems but do not have long-term agendas to create a space that will be subject to some "distinctive rules" (ADB, 2006 -2008).
Increased collaboration among the Central Asian republics "stands to yield huge dividends for the people of the region," claims a research from the Asian Development Bank. A region's economy that is twice as large and prosperous after ten years may result from lower trade costs, more efficient use of water, and other natural resources. Additionally, the cost of missed possibilities for employment, conflict, and insecurity could be high (Maksutov, 2006)
As members of many regional organisations, the Central Asian governments actively participate in regional cooperation, as I have already discussed. Two organisations, however, in which Central Asian countries participate are worth examining in more detail. These groups are well positioned to have a significant influence on regional politics and best represent the security and economic needs these nations face. These institutions include the Eurasian Economic Community and the Shanghai Cooperation Organization (SCO) (EEC).
Shanghai Cooperation Organization
In 2001, the Shanghai Cooperation Organization was established as an international body. It developed from the security group known as the "Shanghai Five," which was founded in the middle of the 1990s following the settlement of many border conflicts involving China, Russia, and Central Asian governments (Germanovich, 2008). China, Russia, Kazakhstan, Kyrgyzstan, Tajikistan, and Uzbekistan are among its five members. Additionally, there are four observers: Iran, Mongolia, Pakistan, and India. In order to address ongoing issues of economic growth and security, such as safeguarding borders and boosting commerce among member states, the SCO was founded. The SCO Charter outlines the organization's primary objectives, which include border security, the battle against terrorism, extremism and separatism, control of drug trafficking, and a long-term goal of creating a free economic zone within the SCO.
Due to the specific characteristics of the Shanghai Cooperation Organization, its members have a unique opportunity to shape regional politics in the Central Asian region. It is an excellent illustration of collaboration using institutional liberalism's viewpoints. Russian military presence in Kyrgyzstan, Kazakhstan, and Uzbekistan, as well as significant Chinese FDI in the economies of Kyrgyzstan and Kazakhstan, which are China's main trading partners, are examples of how smaller powers in the region balance between East (China) and West (Russia) by appeasing them and giving up some sovereignty in exchange for benefits of stability and economic growth (Germanovich, 2008). However, the distinctive features of the SCO framework in some ways allow smaller states to play more significant roles in the organisation by drawing China and Russia's attention to issues that are significant to these nations by outlining their concerns for their security, economy, and national interests. By pursuing relatively independent foreign policy in the direction of a cooperation with the USA, they are also able to counterbalance the ambitions of more powerful nations. Despite growing dissatisfaction from China and Russia with American presence in the region, Kyrgyzstan, Kazakhstan, and Uzbekistan provided territories for US military bases and joined the coalition against the war on terror. This is an example of how smaller powers pursue their own national agendas through cooperation. Through the execution of massive military exercises like "Peace Mission 2007," the SCO has a tendency to overcome the influence of the US by balancing the interests of major nations (Vinod, 2006). As a result of multi-vector foreign policies driven by regional interests of lesser powers, Central Asian nations participate in various international security and cooperation initiatives that enable them to uphold the status quo and sustain stability (Vinod, 2006).
Eurasian Economic Community
The Eurasian Economic Community (EEC), which is also an illustration of liberal institutionalism, is a significant organisation that focuses on regional integration and the socioeconomic growth of the Central Asian region. Initiated by Kazakhstan, the EEC was founded that year. It is the largest organisation in the Commonwealth of Independent States created to encourage regional economic development in Central Asia. As of 2006, it includes Belarus, Russia, Kazakhstan, Kyrgyzstan, Tajikistan, and Uzbekistan.
The primary drivers for the creation of the EEC were each member state's ambition to maximise its economic potential and counteract development challenges that could be avoided due to shared infrastructure, educational, cultural, and informational resources that could facilitate cooperation (Vinod, 2006).
EEC is crucial for the successful socioeconomic development of the area for a number of reasons. One of them is that EEC members have tremendous natural and economic potential. A receptive market is another. For instance, natural resources from Tajikistan, Kazakhstan, and Kyrgyzstan are mostly delivered to Russia and Belarus. These two taken together can help the economy and encourage steady economic growth over the entire region. The main objectives of the EEC are the creation of a common economic space, the harmonisation of customs tariffs, and the development of a common market for labour and services that will eliminate current economic borders, promote trade among member states, and eventually lead to regional integration. It is significant to note that effective economic development in the landlocked Central Asian region depends in large part on commerce. Lowering trade expenses and restrictions, per the UN Regional Human Development Report for Central Asia, boosts income, employment, and consumption in the region by 20–55%. (Primbetov, 2006).
Conclusions
A crucial region with tremendous natural, human, and strategic potential, Central Asia has long drawn the interest of major world powers. It has become simpler for international forces to enter the region and begin expanding their influence as a result of the collapse of the USSR and the emergence of new sovereign Central Asian nations. Young and weak Central Asian republics have been pushed to develop a political stance that would safeguard their own interests and satisfy those of global powers in the face of Russia, China, and the US due to domestic and international problems that have arisen since those countries' independence.
The findings of this study show that Central Asian republics built their foreign policies under the liberal institutionalist model. Liberal institutionalism contends that collaboration and integration in politics and the social and economic spheres will be advantageous to nations. These nations have had some success participating in various regional organisations, such as the Shanghai Cooperation Organization or the Eurasian Economic Community, which address the immediate requirements of those nations, particularly in the economy and security sectors. The foreign policy of Central Asia demonstrates that the idea that collaboration is impossible because each state is only interested in its own interests and relative benefits is untrue in that region. Selfish interests indeed drive Central Asian countries, but they are overcome by their participation in regional organisations and institutions that ensure their stability and upkeep of the status quo. There is also evidence that these regional organisations, particularly the SCO and EEC, have long-term political and economic goals for elevating the region to a significant role on the global stage in addition to assisting member nations in resolving regional difficulties that are shared by all.
Conclusions
Understanding the economic, social, and political effects of globalisation on Kyrgyzstan, Kazakhstan, and Central Asian nations in general is the main goal of this thesis. The case study on Kyrgyzstan and the empirical research based on panel data analyses show that globalisation has a dual impact on these nations' socioeconomic development. One the one hand, short-term economic growth may benefit from globalization's positive effects like migration and remittances. They act as a "shock absorber" for the difficulties brought on by the shift to a free market economy. Remittances and migration have a minor but favourable immediate impact on the expansion of the services sector, as seen by the rise in private consumption and GDP per capita. However, they may have detrimental long-term effects on the economy, particularly where trade and industry are concerned. According to economists' forecasts, the Dutch illness phenomenon will have detrimental impacts on both migration and remittances. According to it, an excessive reliance on foreign financial flows might paralyse the nation's manufacturing sector, which would cause the economy to stagnate in the long run. The study's empirical portion shows that migration and remittances have no beneficial effects on the social metrics used to gauge development. Furthermore, it can result in a loss of human capital and a distortion of conventional social systems inside civilizations in the future.
The lack of data is one of the reasons for the inability to determine if remittances and migration have a good or negative impact on development. The majority of the information is derived from official sources that exclude unofficial statistics, particularly for Central Asian nations.
For the same reason, data are completely unavailable for certain nations, including Tajikistan and Uzbekistan.
Globalization has two political effects, as well. The empirical analysis, which is based on simple regression analysis, shows that Central Asian governments do not necessarily need to follow the liberal democracy model in order to have successful economic growth. Democracies can exist in nations with poor or moderate socioeconomic growth, as India or Ukraine. They have the potential to develop and be undemocratic, like China or Kazakhstan. Other significant economic, geopolitical, and social issues that can affect development must be examined in order to draw a conclusion on the relationship between democracy and development.
Considering the notion that Central Asia is a significant region with immense ecological, human, and strategic potential is one method to approach this issue. Major global and regional forces have been paying attention to it, especially since the fall of the Soviet Union. Because of this, weak Central Asian nations are being pressured to adopt a political stance that will satisfy both internal and external interests and create the ideal conditions for steady political and economic development. By participating in regional organisations like the SCO and EEC, Central Asian nations chose the road of political integration and cooperation, as shown by the descriptive study. This tactic can support political stability and regional economic progress while assisting them in overcoming difficulties brought on by globalisation.
References
.png)
.png)
Assignment
ECO500 Economics for Business Assignment Sample
The Problem/Scenario
Suppose that a new strain of Covid 19, known as Kappa, has been detected in Australia. Kappa is known to be twice as infectious than the existing variants of Covid 19. Kappa has been found also to be immune to the existing Covid 19 vaccines such as Pfizer and Astrazeneca.
KC Pharma, a local startup company, has produced a unique nasal spray vaccine called KC1 that has been found to be 98 per cent effective against Kappa in clinical trials. Based on this information the Therapeutic Goods Administration (TGA) of Australia, Australia’s regulatory body, has approved the use of KC1 in Australia in the short run to combat Kappa. Based on the above scenario, provide a project report on market structures, market model(s), economic strategy(ies) and profitability scenarios. In your assignment writing, you shall include the following issues clearly and sufficiently with diagrams and illustrations where necessary for assignment help:
1. Identify the basic market structure and explain the type of market in which KC Pharma will be operating
2. Based on your answer to question 1 above, show a theoretical market model explaining the
equilibrium position (profit/loss situation) of KC Pharma in the short run.
3. Suppose you are the economic adviser to KC Pharma. Suggest a selling strategy to KC Pharma whereby it can further maximise its profit. Make sure you clearly illustrate the selling strategy to KC Pharma.
4. Critics of TGA argue that KC Pharma is charging a very high price for KC1 and is also unable to keep up with demand. They argue that more firms should contest the market to create efficiency in the market. TGA is convinced by the Critics’ arguments and allows a “large” number of firms to supply vaccines to combat Kappa. Assess and evaluate in which market structure(s) and the type of market(s) KC Pharma will be operating. In your demonstration, you must explain KC Pharma’s equilibrium position after the entry of large number of rivals in the market.
5. Analyse and evaluate economic profitability of KC Pharma in the long run.
Solution
Answer 1:
KC Pharma will operate in an oligopoly market, which is a form of imperfect market condition. In this market structure, few firms compete with each other and produce differentiated products. As per the given scenario, KC Pharma has produced a unique nasal spray vaccine, KC1. However, the company have close competitors like Pfizer and AstraZeneca which produce COVID-19 vaccines that are also safe for people. These companies have captured a large share of the market. This is because new firms cannot enter into the market easily due to legal restrictions the Therapeutic Goods Administration (TGA) of Australia, large amount of capital investment and low economies of scale.
Answer 2:
The oligopoly market is characterised by entry barriers and existence of limited firms. The main feature of the market is interaction as well as interdependency among existing firms. In other words, the action of one firm can influence the action of other firms in the market. Therefore, the oligopoly market often experiences strong competition between firms as each firm has the capability of making decisions on quantities, prices, and advertisement in order to maximise profits (Azar and Vives 2021). As the market is concentrated extremely with few companies, some firms can dominate the industry while other small firms can also perform their business. Likewise, Pfizer and AstraZeneca dominate the vaccine market while a start-up company like KC Pharma can also produce and sell its products. The start-up company can maximise its profit when its marginal revenue (MR) and marginal cost (MC) equate with each other. This situation creates an equilibrium condition where the firm produces equilibrium amount of vaccine at an equilibrium price. The start-up company, here, will experience a kinked-demand curve due to the competition of other oligopolistic firms. In Kinked demand curve model, two theories are seen, which are:
A. If a firm declines its price below the prevailing level then other rival firms will follow him
B. If the firm rises the price above the prevailing level then other rival firms will not follow him
The profit-making equilibrium condition of KC Pharma is presented in the figure below:
Figure 1: Short-run Profit maximisation condition of KC Pharma
The short-run profit maximisation condition of KC Pharma is shown with the help of kinked demand curve theory (Salehi and Makiyan 2021). As per the theory, each firm in the oligopoly market sells differentiated products and each of them experiences two market demand curves for its product. Thus, KC Pharma also faces two different demand curves where at high prices, the firm has comparatively elastic demand curve and at low price the firm has relatively inelastic demand curve. Corresponding to two demand curves, the firm has two marginal revenue curves accordingly. These two demand curves intersect at point k. Here, the MR and MC curves intersect at point E. Therefore, equilibrium quantity of KC Pharma is Q* and equilibrium price is P*. As per the assumption, if KC Pharma increases its price above P* then other vaccine producing firms will not follow the increase in price and hence the company will experience the more elastic market demand curve. If the company will decrease price below P* then it is assumed that other competing firms will follow the price. The main reason of these assumptions is that when KC Pharma will increase its price, it will face a substantial decrease in sales as consumers can purchase similar products from other companies. On the other side, if KC Pharma will reduce its price, other firms will follow it due to the fear of customer loss.
Answer 3:
To increase profit further, KC Pharma can make collusion with other companies. In collusive oligopoly, firms make agreement between each other to make an undifferentiated oligopolistic industry. Here, all vaccine producing firms come together and agree to set prices as well as outputs for maximising total industry profits which is known as cartel (Schlechtinger et al. 2021). Thus, the company along with its competitors can set price in a collective way by the leadership of one firm instead of taking prices from the market. In this situation, profit margin becomes higher compared to that in a competitive market. Sometimes, governments do not support collusion and price-fixing. However, in case of vaccination, the industry can get the permission of fixing price by making a cartel.
The kinked-demand theory has several limitations for which the industry can move to make a cartel for making higher profits. Firstly, the kinked model does not state the condition by following which a firm can find its kinked point in the market demand curve. Secondly, the theory does not consider the chances of collusion and setting a fixed price and output. Lastly, the kinked-demand model shows that price increase by one firm will not be followed by other firms. Hence, considering these obstacles, it can be said that a cartel is better for KC Pharma to make higher profits.
Now it is essential to discuss the selling strategy that KC Pharma will follow for maximising its profit. The company needs to make a formal agreement with other vaccine producing companies in order to control supply and to manipulate price. Therefore, collusion will form a group of independent business that will perform as a single seller at the fixed price for the vaccines they produce without any competition. In this context, it is essential to mention that a cartel gets less facility compared to that of a monopoly where only a single seller only owns certain products in the market. The cartel of vaccine producing companies will help to set a fixed price for vaccines in a legal way. After forming cartel, each company will select their combined output where their marginal revenue becomes equal with marginal cost. The fixed price of cartel, therefore, will be determined by market demand curve where the cartel selects its output level. By forming a cartel, the vaccine producing firms can charge higher prices together for certain quantity of vaccines like a monopolist. The figure below reflects the situation:
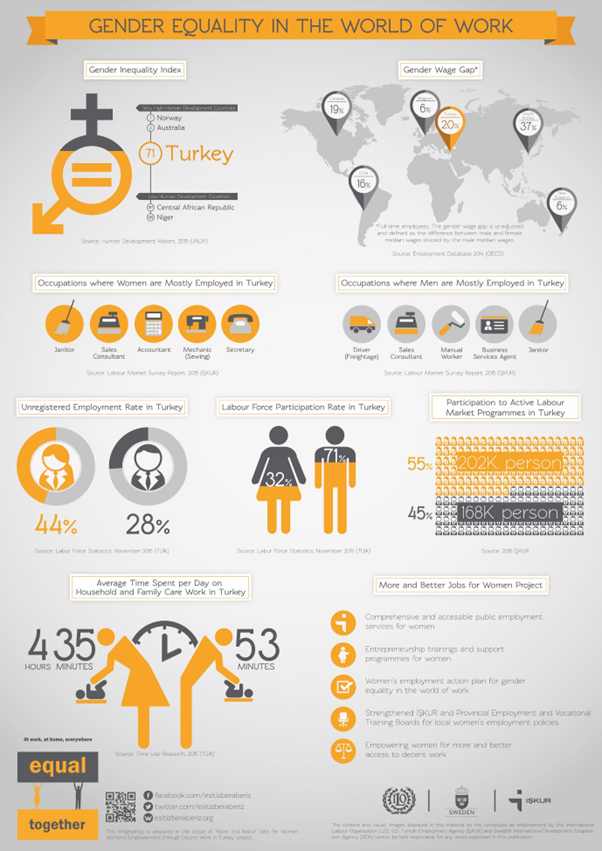
Figure 2: Collusion in the Oligopoly market
The above figure represents a cartel where each firm together set price P2 and produces Q2 quantity of output. At this output level, MR and MC become equal with other. Hence, each firm can earn supernormal profit by the area P1BA2. Therefore, by making a cartel, KC Pharma can successfully earn profit.
However, the company needs to follow some points that can breakdown a cartel. Sometimes, it is seen that other firms have cheating tendency on their quotas for getting higher benefits from higher output and price. Hence, the firm needs to make cartel with small number of firms so that it can easily observe behaviour of others. Moreover, penalties will be charged for each firm who will break quotas.
Answer 4:
As per the given situation, KC Pharma will operate in a monopolistically competitive market. This market structure lies between a monopoly market and a perfectly competitive market. In this type of market, large number of firms produces and sells almost similar type of products in the market to a large number of customers. In this market, each firm will produce products that are close substitutes and hence they can differentiate their products by applying different market strategies. Thus, firms can act as a monopolist as each of them has different brand name, price level and product quality. Like a monopoly market, firms can charge higher prices for selling lower quantity of output than a perfectly competitive market. Therefore, each firm acts like a price maker in this imperfect competition where change in price will not cause any price war that can be seen in the oligopoly market. A monopolistic competitive firm achieves higher profit only in the short-run when its marginal revenue and marginal cost become equal. Moreover, the firm can also incur loss in or gain normal profit during this time. The figure below represents a condition, where the firm gains supernormal profit in the short-run:
TGA allows a large number of firms to supply vaccines for combating Kappa, which is produced by KP Pharma. Therefore, the number of vaccine sellers will increase in the market. However, one type of vaccine cannot substitute another type of vaccine completely as they can be differentiated by their company name, branding, price level and quality. Therefore, each vaccine producing firm will act like a monopolist and can set vaccine price individually in the market for maximising profit (Bertoletti and Etro 2022). Though firms can act like a price maker, they cannot charge higher prices due to strong competition in the market. By charging higher price, a firm can loss its customers and this in turn can reduce profit-making condition of the firm. The diagram above showcases equilibrium position of KC Phrama here the demand curve is slightly elastic. This indicates that if the firm increases price of its vaccine then its demand for product can be declined.
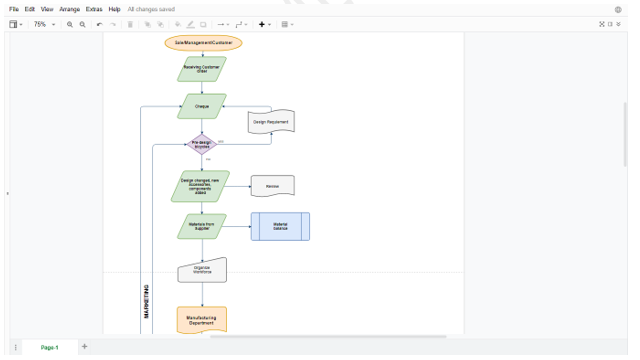
Figure 3: Super Normal Profit of the Monopolistically Competitive Market in the Short-run
In figure 4, it is seen that the short-run equilibrium can be obtained at point E where marginal cost (MC) curve and marginal cost (MC) curve intersects. Hence, the corresponding equilibrium output and price level become Q* and P*. In short-run, the average cost (AC) curve is lower than average revenue (AR) curve. Average revenue curve which is also the demand curve of KC Pharma is elastic but not perfectly elastic as it has negative slope. Hence, the firm gains economic profit by the area CBAP*. In short-run, the monopolistic competitive firm can also face loss if its average cost becomes higher than average revenue.
However, it is essential to mention that a monopolistically competitive firm does not become allocatively efficient as the price does not equal to marginal cost. Moreover, production efficiency also cannot be seen in the market as firms can set higher price than their marginal costs, which means, P > MC. Therefore, the market cannot achieve efficiency level instead of facing competition.
Answer 5:
In long-run, the monopolistically competitive market has free entry and exit and this implies that the existing firm can make only normal profit in the long-run. In other words, when the market gains supernormal profit in the short-run, other firms will enter into the market. This will increase the number of firms and hence their profit making opportunity will decline until it will earn normal profit only.
The following figure showcases equilibrium position of KC Pharma when it will operate in the monopolistically competitive market.
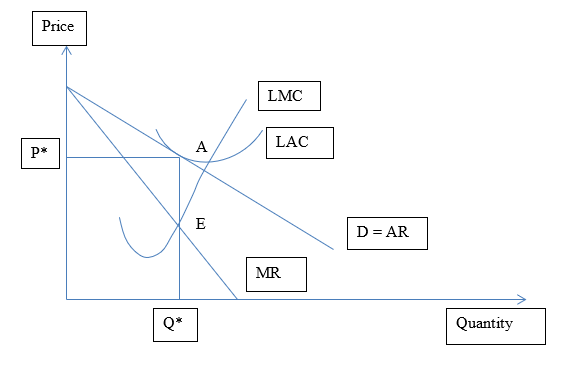
Figure 4: Monopolistically Competitive Market in the long run
As per figure 4, it is seen that the long-run equilibrium can be obtained at point E where long-run marginal cost (LMC) curve and marginal cost curve intersects. Hence, the corresponding equilibrium output and price level become Q* and P*. In long-run, the firm will operate somewhere to the left of the average cost (LAC) curve’s minimum point. Average revenue curve which is also the demand curve of KC Pharma is elastic but not perfectly elastic as it has negative slope. The left side of LAC curve becomes tangent with the AR curve and hence the firm only gets normal profit.
References:

Coursework
Coursework on Demand and Supply of Certain Resources Assignment Sample
Introduction:
In economics, the quantity of a given good that a consumer wants to purchase is referred to as the good's demand. The amount of a specific item that workers, producers, purchasers, etc. are willing to offer in the market is referred to as the supply (Mankiw, 2014). The amount required in regard to each price is defined as the sum of the individual wants of the total number of consumers in relation to that price. The quantity supplied refers to the total number of goods and services that the producers are willing to offer for sale at a particular price and period. Keeping other factors fixed, the law of demand describes the link between the price and the quantity desired. To put it another way, the law of supply asserts that as commodity prices rise, there is an increase in the quantity supplied rather than a decrease in the quantity requested (Mansfield & Yohe, 2000). When the economic forces of supply and demand are in balance while keeping other factors constant, the market is in equilibrium. The price of the specific commodity that is being produced, the pricing of other commodities, as well as consumer income and preferences, are the primary determinants of demand. The main determinants of supply depend on speculation, future expectations of the commodity's price level, and the cost of the production factors, among other things (Salvatore, 2008).
The Demand-Supply and The Movement and Shifts of The Curves:
The amount sought and price of the commodity have a negative relationship, while the quantity supplied and price have a positive association. The demand curve moves if the price of the good varies, but if other factors, such as income, taste, or preferences, alter that are not related to the price of the good, the demand curve shifts (Baumol & Blinder, 2015). For instance, the demand curve moves to the right as consumer income rises. The same is true for supply; a change in the level of the commodity's price will produce a movement along the supply curve, whilst a change in factors other than the price will cause a shift in the supply curve to the right or left (Shepard, 2012).
The Analysis of Demand and Supply of Resources of Australia:
One of Australia's top economists, Ross Garnaut, has referred to the present economic downturn as the "economic dog days." He believes that this downturn will only become worse as time goes on because it is related to China, the country's largest and most important trading partner, and iron ore, which is thought to be Australia's greatest export (Garnaut, 2015).
China's demand for steel has decreased recently, and the situation is still not better. As a result, the shipping of Australian iron ore to China has slowed down (Garnaut, 2015). In the past, the Australian economy flourished as a result of China's high demand for iron ore, which in turn led to sky-high demand for Australian iron ore. According to a report by the World Bank, the impact of China's economy's modest development would have a significant influence on nations that export goods to China, such as New Zealand and Australia, which have direct links to the region's supply chain (Garnaut, 2015). The Australian Prime Minister, Mr. Abbot, painted a rather bleak picture during a speech. In the following four years, a predicted 30 billion dollar drop in revenues is expected as a result of the lower iron ore prices (Garnaut, 2015). Since the administration was able to enact its first budget in May 2015, prices, which recently dropped to $95/tonne, have been cut in half. The mining industry in Australia was responsible for the nation's 23-year economic boom, which was sustained despite falling mining-related investment, which led to a slowdown in growth to 0.5% in the final quarter of 2014. (Garnaut, 2015). Glenn Stevens, the head of the central bank, described the sector's growth as being below trend.
Theoretically, the decline in steel demand was the exogenous factor that caused the demand curve for iron ore to move to the left (Rittenberg & Tregarthen, 2009). The important thing to keep in mind is that the negative demand shock that has affected the entire demand curve to move to the left—rather than the prices of the commodity—is what is driving the quantity demanded to increase or decrease (Gans, et al., 2011).
Conclusion:
From the economic assignments analysis of the mining industry, it can be inferred that the demand and supply of iron ore, or any other commodity, are influenced by factors other than just price, such as supply shocks, demand shocks, increases or decreases in consumer income, changes in consumer preferences, changes in consumer tastes, etc. These other factors also affect the demand and supply of the particular commodity.
References
Microeconomics: Principles and Policy, s.l. : Cengage Learning, 2015. Baumol, W., and Blinder, A.
Principles of microeconomics, by Gans, King, and Mankiw (2011, s.l. : Cengage Learning).
R. Garnaut, 2015. Unlucky Country: As China's economic growth slows, iron ore prices in the nation are falling. [Online] Information available at: http://www.economist.com/news/asia/21648612-country-suffers-plummeting-iron-ore-prices-Chinas-economic-growth-slows-unlucky-country
[Retrieved on November 26, 2015].
Essentials of Economics, N. Mankiw, s.l. : Cengage Learning. Principles of macroeconomics, by N. G. R. E. G. O. R. Y. Mankiw, s.l., Cengage Learning, 2014.
E. Mansfield and G. W. Yohe, 2000. Applications and theory of microeconomics. Norton in New York.
Principles of Microeconomics, L. Rittenberg and T. D. Tregarthen, Flat World Knowledge, 2009.
Microeconomics: theory and applications, D. Salvatore, 2008, OUP Catalogue, s.l.
Collaborative Demand and Supply Planning Between Partners, Shepard, D. 2012.
Essay
Impact of the US-China War on The Chinese Economy and Its Long Term Implications
Executive Summary
This economics assignment essay will go into great length about the effects of the US-China war on the Chinese economy and its long-term ramifications, highlighting two of the most competitive and powerful economies in the world.
China and the United States of America have long been considered each other's sworn enemies. While disagreements and conflicts have arisen over a variety of topics, including the army, the middle east situation, China's proximity to Pakistan, and Russia, commerce has also seen an increase in friction.
Background
The two nations' trade relations have been a topic of controversy, and recently, the animosity between them has risen. The turning point in this situation came when US President Donald Trump threatened China with increased import taxes in America or a temporary total boycott of Chinese goods after China inflated exchange rates with respect to the American Dollar to boost Yuan, their currency, well in the international market. One thing led to another, and following a recent American president's strike, the Trump administration placed a higher tax duty on $35 billion worth of Chinese goods, creating a severe market squeeze in China.
Well, the reasoning is straightforward. The US consumer will switch to buying domestically made items once the very affordable Chinese goods become too expensive for them to purchase. This will boost the US manufacturing sector and force the Chinese market and supplier out of the US market as well. China, on the other hand, responded right away. The Chinese government denounced this US action, calling it the greatest trade war in history. The Chinese government then levied a 25% tax on $35 billion worth of US imports of goods like automobiles to equal what the US did and to balance the books (Aleem, 2018).
Reason Behind Trade War
One way the US government justified their action was as retaliation for the act of secondly as a response to China's policy of forcing American corporations into reviving technology in exchange for market, by increasing the FOREX rate for Yuan with respect to the Dollar. Despite the fact that the practice has been extremely immoral, these trade obstacles will have an impact that will hurt China more than it will hurt the US.
But this is only the very tip of the iceberg. The situation is out of control and much worse than anticipated. Both countries' markets have been significantly impacted, but China has seen the biggest effects.
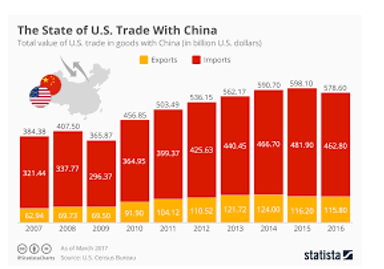
Fig 1: State of US trade with China
The Chinese Economy and Market
A socialist market economy exists in China. Public ownership and state-owned markets are the foundation of this type of market. This strategy, which emphasizes everyone having their own part, is based on Marxist doctrine. Since China has a closed economy, it is extremely challenging for businesses from around the world to enter its market. As a result, China frequently receives criticism from the international community under the pretext of trade restrictions (Eckart, 2016).
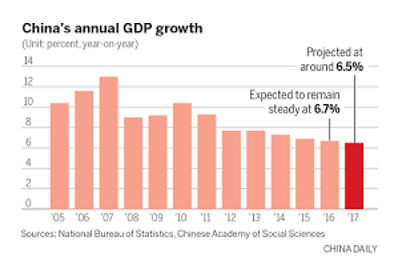
Fig2: China GDP
China Growth Statistics
China is reputed to be the only nation to have a developed economy that is reported to have removed the greatest number of individuals from the labour force while still creating middle class customers. While China has been successful in accomplishing these feats, it has also come under fire for its tough and immoral approach against businesses that are not from China, particularly any corporation from the United States.
The US-China Face-Off
The American people and the cultures in the western economies have not taken this well. China has received numerous warnings for these actions, but last July, President Donald Trump took action and enforced the new tariff law, denying China access to a sizable market in America and ultimately causing a minor but noticeable economic crisis.
The US-China Face-Off
While economists from all over the world have praised China's rapid rate of development, this rapid change has also brought about a number of other changes, including a rapid and high rate of urbanization, higher consumer demand globally, an increase in work load, challenges to environmental sustainability, and external imbalances brought on by the feverish desire to achieve lofty target goals. China is now in a precarious position from which it cannot escape and must finally satisfy all demands, from those of foreign consumers to those of its own people.
Impacts of the Trade War On World Economy
The United States and China are two of the most significant and powerful economies in the world, and their integration has led to some fairly well-established regulations and opened markets for both of these countries as well as the rest of the world. Even if the US-China trade war is still in its early stages, it has already had an impact on people, organisations, and nations all over the world, particularly these two countries.
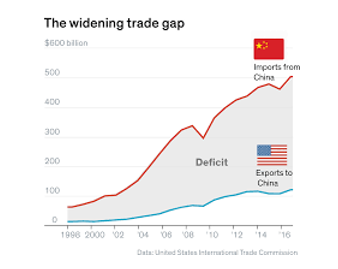
Fig 3: Widening Trade Gap
The countries' willingness to accept the defeat and refusal to give in to ego by finding a middle ground is astonishing. Both of these nations are confident in their capacity to diplomatically convene, identify answers to the issue they are currently experiencing, and mutually relieve one another without incident (Tahn, 2018). Due to the global financial crisis, both of these nations are now in the centre of attention, making them the champions of the cause. It seems as though people have begun to anticipate that they will be the cause of the current financial crisis and that they will also be responsible for its resolution. It is perplexing that now, only two of the world's 180 independent nations are credited with maintaining global economic stability. In fact, the United States and China represent both the causes and risks of global macroeconomic imbalances. The majority of the blame for the current crisis may possibly rest with U.S. regulatory and macroeconomic policies (Prasad, 2009).
Solutions to the Problem
A very deliberate and nonviolent strategy must be used to bring about peace in the situation. Due to the fact that its manufacturing and production sector will take a significant hit as a result of what president Donald Trump has done, China will likely suffer the most from this trade war. The output of Chinese goods will increase significantly if America stops buying from China, resulting in a market deficit for both nations. Despite having a socialist economy and a restricted market, China is unable to soften the impact of the American blow. There are various simple ways that both the United States and China can resolve this conflict, but it will be impossible to do so without causing diplomatic turbulence (SOlomon, 2016)
Problem in Leadership and its Effect on Economic Situations
The attitude problems of both countries' leaders might also be blamed for this issue. Even though the leaders are aware of how this crisis will affect both their countries and the global economy, none of them are willing to step back. Both of these leaders must intervene as soon as possible to change this terrible situation of bigotry and irresponsibility. It is therefore crucial to see how both countries' decision-makers attempt to find a middle ground in this murky scenario without doing more harm than they already have in the benefit of both their economies and societies. If this occurs, there will be less wastage of money, resources, and commodities, and China and America can establish a more comprehensive and sustainable trade relationship (World Bank, 2017).
US-China Trade War Facts
It is now even more crucial for China to take a step back and make things right because the US was, and still is, the country's top exporter by trade volume. Otherwise, the economic collapse the country has already experienced will only worsen over time. The international community is aware of some unethical tactics China used to strengthen their currency (inflating the FOREX rate for the Yuan relative to the Dollar), which did not sit well with the USA. However, changes must be made as soon as possible to prevent a situation similar to the 2008 market collapse, except this time it will only affect China. Chinese exports to the United States increased from $100 billion in 2000 to $338 billion in 2008, while imports rose from $16 billion to $71 billion. These increases illustrate how dependent the two nations were on one another at one point in time and how the proper balance was maintained in the global economy as a result. There are a number of nations prepared to capitalise on this deteriorating relationship, but doing so would only make China's problems worse and is undoubtedly not a positive indication.
Recommendations
The exchange rate problem has received a lot of attention recently, and it doesn't need any more than it already has. The fact that the exchange rates of the Yuan and the US Dollar have been steadily declining shows how disastrous China's economic policies have been. Due to China's employment of protectionist policies, which make it the least liked or favoured country by foreign investors worldwide on the FDI front, the value of the Yuan has fallen as a result (Financial Times , 2018). This war has the potential to result in numerous casualties and the economic instability of not only China but also several other dependent economies. Before time runs out, the only way out of this mess is a solution-centric strategy. In the modern era, economic stability is one of the things that all world leaders look forward to most, and any incidence like this has the potential to seriously harm the growth and even bring it back down.
Conclusion
We may therefore draw a conclusion by comprehending how the three factors—the FOREX Rate Problem, China's Closed Market and Protectionist Policies, and the Lack of FDI and Investor Trust in China—have played a significant role in forming the world's largest trade war between America and China. Both nations need to find a middle ground to get out of the economic mess they have created, which has the potential to affect people and economies all over the world as well. The USA is merely working on lines of maintaining ethics and implementing trade rules against all the bad practises of China. Both of these nations are confident in their capacity to diplomatically convene, identify answers to the issue they are currently experiencing, and mutually relieve one another without incident (Lau, 2018). Due to the fact that China's manufacturing and production sector will be severely impacted by this trade war and that many Chinese citizens will likely lose their jobs or suffer significant financial losses, China will likely be the country that suffers the most. It is therefore crucial to see how both countries' decision-makers attempt to find a middle ground in this murky scenario without doing more harm than they already have in the benefit of both their economies and societies.
References
Z. Aleem (2018). In less than 500 words, explain the US-China trade battle. Citing https:// www.vox.com/world/2018/7/6/17542482/china-trump-trade-war-tariffs
J. Eckart (2016). The Chinese economy: 8 things you should know. the 8 facts regarding China's economy that were taken from https://www.weforum.org/agenda/2016/06/8-facts-about-chinas-economy/
E. Prasad (2009). The Crisis' Impact on the Economic Relations Between the United States and China. Retrieved from "The Effect of the Crisis on the U.S.-China Economic Relationship" at from https://www.brookings.edu/testimonies/the-effect-of-the-crisis-on-the-u-s-
Global Bank (2017). China World Bank. the World Bank website http://www.worldbank.org/en/country/china/overview
Business Times (2018). What is the US-China trade war and how does it affect India? Retrived from Financial Express at https:// www.financialexpress.com/economy/us-china-trade-war-what-it-is--how-it-impacts-India/1233408
D. Solomon (2016). What effects may a trade war between the United States and China have on each country's economy? Reproduced from https:// www.focus-economics.com/blog/impact /impact /impact-of-the-trade-war-between-the-us-and-china-on-their-economies.
Lau, L. (2018). (2018). How would the Chinese economy react if the US-China trade conflict worsens? These are the figures. Retrieved from "if-us-china-trade-war-escalates-how-will," " www.scmp.com/comment/insight - opinion/united-states/article/2156470"
Tahn, W. (2018). China's attempts to repair its economy are being hampered by the trade conflict. from https:// www.cnbc.com/2018/07/18/us-china-trade-wars-impact-on-chinas- economy.html
Coursework
AFE4001 Business Economics Assignment Sample
Submission Date and Time: Week 12 - 11th August, 2022
Expected Return of Feedback and Marked Work: 14 days from submission
Assignment Weighting: 50%
Word Count: 2,000
Learning Outcomes Assessed by this Assignment:
MLO3: Identify and apply appropriate management accounting techniques to assist in management decision making
MLO4: Make use of management accounting information to assess business performance.
Assignment Detail:
WAZ limited is a UK subsidiary of the Australian MMC Group. The company has been operating in the UK for the past 6 years. WAZ provides sporting equipment to a number of sporting activities such as Football, Racing, Running, Cycling, Tennis, and Swimming in the UK, USA, and Australia. For the past 6 years, WAZ has been a profit-making firm as it has retained its previous clients, in addition to capturing an increasing share of the market. However, the finance director of WAZ has recently got in touch with your professional management accounting consulting firm and has engaged your firm with the mandate to provide them with an explanation of the cash flow problem that WAZ Limited had been facing. One of the company’s products, a football helmet for the North American market, requires a special plastic. Last year, the company manufactured 16,000 helmets, using 140,000 kilograms of plastic in the process. The plastic cost the company £0.75 per kilo. However, according to the standard cost card, each helmet should require 120,000 kilograms of plastic, at a cost of £0.70 per kilogram.
Last year also the company manufactured 700 Ski using a total of 3,000 hours. Total actual cost is £13,500. However, the WAZ budgeted for 600 units of Ski at 4 direct labor hour per unit. Standard labor rate is £4.80 per hour. The company’s management wants to know the causes of these variances. Assessing the value of inventory has been the major problem faced by WAZ Ltd. In the past month, there has been a number of meetings in London and Australia where it has been agreed that WAZ Limited should use the best appropriate method to value their inventory each year.
The company is planning to expand and launch a new tennis rackets called V-Shaped with a selling price of £390 per racket. WAZ Limited plan to sell a total of 1200 units of V-Shaped for the same period. Total budgeted sales for each month are as follows: November 400, December 400 and January 400.
From their costs estimates, total fixed cost estimated to be £135,000 and it will be shared equally throughout the period. The variable cost is £130 per unit. The fixed costs are for the whole period, so they are not affected by the level of service. However, the variable costs will increase with services output (ie sales output multiplied with variable cost per product). Variable cost will be paid on the basis of 50% in the month of purchase and 50% the following month. Similarly, revenue from the sale of V-Shaped will be on the basis of 50% cash in the same month, and the remaining 50% credit to be paid the following month.
Required
You are required to write a well-researched and referenced management to the directors of WAZ limited in which the following points should be discussed.
• Provide a critical explanation on the different inventory valuation methods available for WAZ Ltd and their advantages and disadvantages. You should make recommendations for the company on the suitable valuation method to use.
• The importance/purpose/benefits of management tools such as Budgets. A computation of your cash budget for the first 3 months.
• A computation of variance analysis. The possible causes of these variances. You should also briefly comment on the use of standard costing and variance analysis to the company.
• Some other examples that show understanding of the relevant concepts.
Assignment Guidelines for Assignment Help
It is important that prior to you submitting your work, you read this and objectively assess your response against the rubric.
This will ensure that you have done enough to attain the marks you wish to achieve.
Layout
Your work should be word processed in accordance with the following:
• Font style, Arial, font size 12
• 1.5 line spacing.
• The page orientation should be ‘portrait’
• Margins on both sides of the page should be no less than 2.5 cm
• Pages should be numbered
• Your name should not appear on the script.
Solution
1. Introduction
WAZ Ltd is a UK subsidiary of the Australian MNC and the company has managed to provide essential business on sports goods. The company has recently struggled with inventory management and it is necessary for managing the inventory properly. This report is going to evaluate the inventory valuation methods along with the proper calculations.
2. Critical Explanation of the inventory valuation methods
Inventory valuation methods are generally described as the practice that is followed by the companies for inventory stock and developing the financial statements for the company. The inventory valuation method is very important for the improvement of inventory management and preparing the cash budgets as well. In this section, the three types of inventory valuation methods including FIFO, LIFO and WAC are going to be discussed.
FIFO is generally stated as the “first in and first out” which could be effective for the different types of inventory management. Purchasing first and leaving the warehouse first could be very effective in the development of the plan for inventory management. The valuation of the inventory will be effective through the methods of FIFO as the method is effective as well as the implementation of the method is very easy as well (Simeon and John, 2018). On the other hand, the implementation of the model could be useful in the different variants as well. On the other hand, LIFO is the model that is described as the “last In first out” which means making an opposite assumption for the different sections of the organisation the companies using the yearly turnover rate for the variation of the models in the different perspectives and the development of the model through the various factors coin impact on the genetic factors as well. There is a basic difference between the two models. The value of FIFO is more than the value of LIFO as the price of the products drops or increases per year (Ionescu, Toma, and Founanou, 2018). The improvements in the price of the drop in the process could be effective in managing the inventory of the company.
However, the WAC which is described as “weighted average cost” could be useful in the development of cost throughout the sections as well. The average per cost unit is generally calculated by dividing the total cost by the total number of articles purchased. The average cost is an effective factor in maintaining the cost inventory for the different variables as the improvements in the different sections will require a management purpose for the improvement as well (Teplická and Se?ová, 2020). The difference between WAC values can change and depends on the LIFO and FIFO values for the inventories for making a better effective approach.
Advantages of FIFO, LIFO, and WAC are Being Described
First in First Out helps in increasing warehouse space and operations of the warehouse become more streamlined (Sufa, and Mulyana,2021). The handling of stocks can be kept at minimum with the help of FIFO. There has been an enhancement in quality control with the help of FIFO. In addition to that, FIFO is of great use in the case of warranty control. On the other hand, Last in First Out matches the recent costs that are against the present revenues. There has been a benefit in the case of tax, and immense improvement has been there within cash flows. There has been minimization of write-downs with the help of LIFO in markets. There has been a presence of physical flow in the case of inventory with the help of LIFO. Weighted Average Costs can be benefited the case of individuals when SKU units have become relatively differentiated from one another. It has been useful in the case of difficult at the time of tracking costs that have been related to individual units. There may be a fluctuation in the price that raw materials possess, however, with the help of WAC it becomes in specific range. It is useful in the case of purchasing materials when it has been on daily basis.
Disadvantages of FIFO, LIFO, and WAC are Being Described
Vital disadvantage of FIFO is that complicated calculations have been involved in it. There has been an expansion of probability of errors that are clerical. In the case of pricing, a requisition not less than a price has to be acquitted often. At the time of rising in prices, there has been an absence of reflection of market price with the help of issue price as there has been utilization of materials from earliest consignments (Zajmi231, and Paic232,2018). In matters of fluctuations within costs of materials, comparison in the middle of a job and other jobs have been criticized as there has been a beginning of one job after few minutes as compared to another that is of same nature that can be delivered at distinct prices (Hada et al., 2019). On the other hand, the utilization of LIFO may get clumsy, and complex and it is very tough to manage inventory, as well as, respective prices that are of every batch if there has been placement of several orders by entity in the case of goods that possess fluctuating costs (Khan, Faisal, and Aboud, 2018). There has been a matter of being prone to errors increasingly in this case. There has been an absence of correspondence of LIFO with casual physical flow that inventory possesses. There has been an understatement of value with the help of LIFO in the case of concluding inventory. In the case of WAC, there has been an absence of public information and there has been a transformation in the case of capital structure. Another major disadvantage is that there has been a sort of difficulty in the case of comparison with the help of WAC.
After the analysis of all the three methods, it has been analyzed that in the case of WAZ Limited, there should be the utilization of Weighted Average Costs (Simeon, and John, 2018). This has been suggested as there has been a less disadvantage of this method as compared to other two and hence, the company will be benefited with the help of this.
3. Importance of Budgets
a) Budget helps an individual to figure out those goals that are long-term and work against them. Budgets force an individual for mapping out goals, saving money, keeping track of progress, and making dreams reality (Auer et al., 2021).
b) If an individual creates the budget and sticks to it, he or she will never be in any sort of precarious position. Budget should be made in accordance with the money that has been earned by an individual (Frank, Goeppert, and Goldscheider,2021). Hence, the budget helps in analyzing the earned money of an individual and immense help has been acquired in the case of saving huge amounts of money in the case of any emergency.
c) It is mandatory to invest money in a wise manner today as per growing prices of all the commodities. The expenditure should be made in such a way that a person can be able to manage all the expenses in case of emergency too. Savings have been considered critical in the case of the future too. This can only be done with the help of a budget that has been made by every individual. It is vital to create contributions on investment into the budget of the individuals. If a person can plan to set aside just a part of earnings of each month, then a contribution can be made in case of the budget and this is only for future. In addition to that, these savings can be termed as retirement funds as they will be required after retirement too in the case of every individual. Hence, at the time of employment, individuals have to save some money by doing just a little sacrifice to be safe and secure in future at the time of their aged days in the matter of money.
d) Another positive side of budgets is that it works at the time of any sort of emergency. A person never knows when an emergency occurs and hence, it is very important in the case of a person to be prepared for emergencies by saving some money as budget.
Computation of Cash Budget in the case of first three months have been shown below in the table-
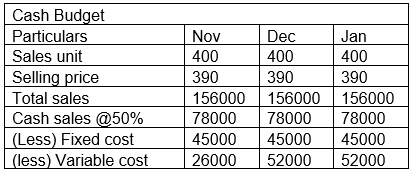
Table 1: Cash Budget
4. Possible Causes of Variance Analysis and Use of Standard Costing and Variance Analysis
Computation on Variance Analysis has been done on table below for WAZ Limited-
Variance Analysis has been caused for several reasons that are highlighted below-
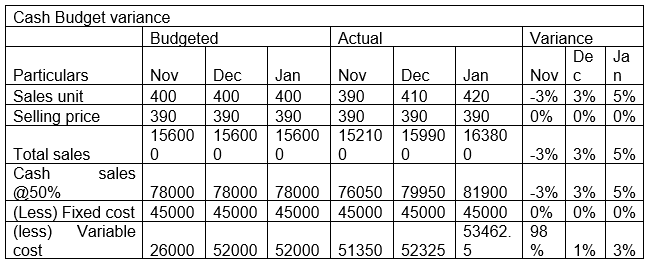
Table 2: Variance Analysis of WAZ Limited
a) Variance in material price has occurred due to transformation in price of market, costs of delivery, purchase of materials that are non-standard, emergency purchases, wrong instructions about shipping, and the loss that has occurred in the case of discount.
b) Variance in usage of material occurs due to worst quality that materials have, transformation within material mix, methods of production of products, careless handling, waste that is excessive and wrong setting that standards have.
WAZ Limited can utilize Standard costs as it has several advantages that have been described below-
These costs deliver as yardsticks in opposition to which there can be a comparison of actual costs. The second benefit of utilizing this cost is that when there has been an undertaking of immediate action, there has been an advantageousness of control above costs. In addition to that, immense help has been acquired from Standard Costs in motivating employees. This is due to the fact that may be utilized system to bestow incentive scheme in which there has been minimization of variance.
WAZ Limited should utilize Variance Analysis for several reasons that have described below-
Immense help has been acquired by this analysis in the case of organizations for being proactive in the case of achievement of targets of business and assisting in the identification and mitigation of potential risks. This helps in eventually building trust in the case of employees and team members for delivery that has been planned.
5. Other Examples that Show Understanding of Relevant Concepts
Budget, as well as, Variance Analysis has been utilized by FP&A. It is the vital function of this particular company to perform budget to variance analysis. This company has engaged in utilizing this as the budget of the company has been compared to real outcomes with the help of this. In addition to that, reason for the budget has been interrupted and aim of variance in the case of this company is to make distinctions in the middle of ctual, as well as, a few predefined measures that include budget, plan, or rolling forecast.
The performance of Variance Analysis has been done by this company on the basis of period in sufficient details to permit managers to acknowledge that matter that is occurring to business at the time of the absence of huge burden on staff. The budget has been performed by the company by mainly two types of variance that is favorable and negative as both of them have helped the company to get the appropriate budget. In addition to that, there has been a matter of calculating Budget and Variance Analysis with the help of excel by which the computation can be done easily and accurately.
6. Conclusion
The report has discussed the evaluation of the inventory valuation methods for the company WAZ Ltd as the improvements for the various developments of the different sections as well. Through the discussions it can be concluded that the improvement in inventory management could be useful in preventing stock outs, ensuring accurate record keeping and managing the locations of the company.
7. References
Auer, U., Kelemen, Z., Engl, V. and Jenner, F., 2021. Activity Time Budgets—A Potential Tool to Monitor Equine Welfare?. Animals, 11(3), p.850.
Frank, S., Goeppert, N. and Goldscheider, N., 2021. Improved understanding of dynamic water and mass budgets of high?alpine karst systems obtained from studying a well?defined catchment area. Hydrological Processes, 35(4), p.e14033.
Hada, I.D., 2019. The Influence Of Methods Of Valuation Of Stocks At The Entity Output On Performance. Contemporary Economy Journal, 4(2), pp.172-180.
Ionescu, L., Toma, M. and Founanou, M., 2018. Applied Analysis of the Impact of Inventory Valuation Methods on the Financial Situation and Financial Performance. Valahian Journal of Economic Studies, 9(1), pp.67-76.
Khan, A.K., Faisal, S.M. and Aboud, O.A.A., 2018. An Analysis of Optimal Inventory Accounting Models–Pros and Cons. European Journal of Accounting, Auditing and Finance Research, 6(3), pp.65-77.
Simeon, E.D. and John, O., 2018. Implication of choice of inventory valuation methods on profit, tax and closing inventory. Account and Financial Management Journal, 3(7), pp.1639-1645.
Simeon, E.D. and John, O., 2018. Implication of choice of inventory valuation methods on profit, tax and closing inventory. Account and Financial Management Journal, 3(7), pp.1639-1645.
Sufa, M.F. and Mulyana, M.K., 2021, April. Spare Part Warehouse Management Analysis Using 5S Approach and FIFO System. In International Conference Health, Science And Technology (ICOHETECH) (pp. 318-322).
Teplická, K. and Se?ová, A., 2020. INVETORY VALUATION METHODS AND THEIR IMPACT ON THE COMPANY´ S PROFIT GENERATION. Acta Logistica, 7(3), pp.201-207.
Zajmi231, S. and Paic232, M., 2018. GLOBAL DIVERSITIES IN FINANCIAL REPORTING: COMPARATIVE ANALYSIS OF INVENTORY VALUATION METHODS IN RELATION TO US GAAP AND IFRS. Recent Advances in Information Technology, Tourism, Economics, Management and Agriculture, p.579.
Essay
BEC4008 Business Economics Assignment Sample
Assignment brief:
You need to write one essay of up to 2000 words (not including reference list).
Assignment topic: In 2021 the United Kingdom faced a ‘gas price crisis’, in which the rapidly rising price of natural gas had a variety of effects on the UK economy. Discuss the causes and effects of this crisis in relation to the economic concepts you have learned, describing potential short-term and long- term effects on both the natural gas market and other markets as well as the UK economy as a whole, considering both demand side and supply side effects.
Guidance Notes: You will need to read news sources about the gas crisis and reference them in order to give some description of what happened; make sure you reference your sources, using Harvard (author-date) referencing. The university provides guidance on referencing at https://study.cardiffmet.ac.uk/AcSkills/Pages/Referencing.asp x, which includes links to useful resources such as ‘Cite Them
Right’ which show you how to include references for different sorts of sources, such as web pages, books, journal articles, etc. But don’t spend your whole essay just describing what happened! It’s very important that you use your answer to show your understanding of the economic ideas you’ve been learning. In each part of your essay, try to explain the relevant economic ideas or parts of the economic models you’ve studied, and then use that to explain or predict effects on the market you’re considering. It may help to break your essay into sections with their own subheadings.
It's ok to research and reference things other people have written about the economic causes and effects (and if you use ideas from other people’s writings you MUST reference them, otherwise you could be committing plagiarism), but the important thing is always to give explanations in your own words of the fundamental economic ideas. Try to bring in as many of the ideas from the course as you can, but only if you can make a sensible argument for how each idea applies to the real-world example you are analysing.
Make sure you upload your essay to the submission point on Moodle before the deadline
Leave it to the very last minute on deadline day, in case you have technical problems. If illness or other circumstances out of your control prevent you being able to complete the assignment in time, remember that you can apply for an extension through the Mitigating Circumstances procedure – look for the Mitigating Circumstances link on
https://outlookuwicac.sharepoint.com/sites/students/SitePages/tools-and-resources.aspx for the form to fill in, and ask your personal tutor if you’re not sure how to do the application.
Learning Outcomes Assessed for assignment help
1. Examine the theoretical underpinnings of consumer behaviour and producer behaviour
2. Demonstrate understanding of how prices, quantities and technologies change
Solution
Introduction
The increase in natural gas prices could be caused due to a wide array of factors. The impact of a price hike would be severe in a nation, if necessary measures are not taken from the end of government to compensate for the rapid rise in fuel prices. The gas price crisis of 2021 in the UK stands to be the main theme of the study, as the objective lies in the review of the incident with the application of economic concepts and models. The demand and supply concepts of economics would be used to systematically address the short-term and long-term implications of gas price crisis in the UK.
Causes and effects of the gas price crisis in the United Kingdom during 2021
The gas price hike during 2021 reflected the energy adversity faced by the UK, as sourcing of natural gases rattled the overall situation in the energy sector. The seasonal demand can be identified as one of the major promoters for the gas price crisis, as the winter season requires residential heating measures to a severe degree. In relation, the UK government always looks to take advantage of the summer season, thereby taking advantage of low prices and acquiring gas shipments for making the heating cost more economical for the people. As per the views of Saif-Alyousfi et al. (2021), the increase in gas and oil prices aids the cash flow for the banking units in a nation. Likewise, the case is no different for UK banks, as they also tend to benefit from the price increase of natural oil and gases, while some of the banks would be under pressure to escalate the interest rates, such as the Bank of England. In addition, the natural gas storage facilities seem to have a heavy influence over the natural gas prices, as a higher degree of inventory levels ensure that the supply and demands are met without disruptions, thereby leading to a drop in gas prices. In comparison to the European nations, the UK boasts only 8.9 Thermal Watt-Hour (TWh) gas storage capacities.
It is feared that the energy suppliers for the UK would soon collapse due to geopolitical threats. The economies have started to recover since the inception of the Covid-19 pandemic, whereas the cold weather in the UK is responsible for the depletion of the existing set of energy sources. As per reports, the prices of gas are found to be quadrupled over the last year to highs of 180 pence per thermal, from around 40p/the in the month of September, 2020 (Ambrose, 2021). Apart from that, it is also observed that the flows of pipeline gas to Europe from various sites over in Russia are unable to make up for the shortfall. As per the Heckscher-Ohlin model countries export the products that they are able to produce in mass quantities. It addresses the ways by which trade measures should be exercised by the nations.
On that note, UK being a poor producer of gas is unable to get the scope for export. As for the 2021 gas price crisis in the UK, the global gas crunch has played a pivotal role in contributing to the overall event. Furthermore, the detrimental event is shaped by the generation gap shared by the UK, as half of the UK’s electricity is known to be developed from the burning of fossil fuel. Nonetheless, the reliance on natural gas for residential purposes has made it quite cumbersome for the government to manage the gas price crisis.
The power shortage in the UK is justified by reports where it is seen that even shorter than 1% of Europe’s stored gas is currently kept by UK. The alternative energy sources are also under the scanner, as the UK's nuclear power plants, that has the capacity to supply up to 20% of electricity, would soon be having a closure date, having no major replacements.
According to the study by Mensi et al. (2021), increased inflation and reduced economic growth occur due to the price hike of natural gas and oil. Moreover, the cost of producing goods also creeps up with the oil and gas prices. It is reported that the Ministers are having a reliance on out-dated energy security policies. Likewise, the concern in regards to the current tension between Russia and western leaders is impacting the gas prices to rise even further in the UK. As per reports, a record closing price at 322.5 pence per thermal is found to be observed during the month of December 2021 in the UK (Ambrose, 2021). Russia being one of the biggest gas suppliers to Europe causes even more pressure upon the UK to go along with the crisis without negative implications. On the contrary, less than 5% gas is sourced from Russia (Plummer, 2022). The secured supply of the gas still remains to be a significant moderator of the current gas crisis that started in 2021.
In the case of the 2021 gas price crisis in the UK, the lack of strategy for gas supplies has played a crucial part. However, Of gem, the energy regulator in the UK plans to develop a set of policies to counter the supply crisis and price hike in natural gas. As per the study by Mugaloglu et al. (2021), it is seen that the relationship between stock market prices as well as the oil prices have been affected by the pandemic. In addition, the declining oil prices referred to the decreased the stock market prices in the first months of the pandemic. In relation, the UK faced drastic changes in the natural oil gas segment that also contributed to varied stock values in the market, making it rather difficult for the investors to cope with the situation. According to the views of Wen et al. (2021), both natural along with the human extreme events have the capability to increase oil price risk. In the crisis event, the contribution of Covid-19 in the form of a pandemic can be regarded as significant, as the economic structure weakened with the pandemic impact. The supply and demand models of economics allows for better review of the market demands and compare the degree of changes that could occur for a product based on the price fluctuations.
Economic demand concepts applied for a review of short-term and long-term effects of the crisis
A correlation between consumer confidence and the price of gas is present, for which the demand distribution has to be reviewed to identify the effects of gas price. As stated by Li et al. (2021), geopolitics is able to carry a significant negative impact on the import and export of the energy trade, whereas the natural gas prices show an increase due to it as well. The equilibrium can be addressed as the state where demand and supply are able to intersect. On that note, the demand for gas for energy generation is going to remain high in the UK, as long as there are no alternative energy sources. As for the 2021 gas price crisis in the UK, the cost of goods and services could increase steadily in the short term if the gas prices continue to escalate in the UK. In addition, the gas prices going up for a longer period of time would refer to a consumer demand going upwards. As viewed by Díaz and Medlock (2021), the demand curve is the graphical representation of the relationship shared between product price and the quantity of the product that is demanded. Therefore, it can be stated that the demand would remain the same in the UK in the coming time, whereas the quantity would be lower in relation to the rise in price. The current shortfall of energy is a reason that aligns perfectly with the demand being steady and quantity demand going down. As mentioned by Pellini (2021), the Substitution Effect is a concept in economics that highlights the tendency of people to substitute expensive goods with other goods that have not increased too much in price. However, for the fuel gas, there are barely any substitute products that could be used for beneficial progress in the long run. Apart from that, the substitutes that might be available for natural gas fuel, would not come across to be cheap either. In the case of the 2021 gas price crisis in the UK, the import of other goods in the country could be at risk due to the energy crisis in the short term. The elasticity of demand model is able to address the level of sensitive demand for a good as compared to the changes for the other set of factors in the economic domain. It is also regarded as the price elasticity, whereas the gas as a product cannot be deemed to be price elastic.
The elasticity of demand is known to be an economic measure of the sensitivity of demand relative to a change in price. As per the views of Han et al. (2021), gasoline products act as relatively inelastic products, thereby clearly indicating the fact that the price changes share a bare minimum effect on the demand in the market. As for the 2021 gas price crisis in the UK, the price elasticity of gas tends to be hovering across -0.10 and -0.28. According to the study by Cook (2021), taxes and distribution are found to be some of the factors that impact the pricing of gas. In the UK, there lies a fragile system in terms of storing the gas and there after channelling it for the purpose of meeting the demands that always remains strong, irrespective of the prices. Therefore, the government should rather focus on upscaling the production of renewable energy that would cause people to apply the substitute rule and decrease the demand for gas for energy generation. Unable to do so would generate a long- term energy shortage all across the UK, thereby affecting the living habits of unnumbered residents.
Economic supply concepts applied for a review of short-term and long-term effects of the crisis
Price elasticity aids in the process of measuring the responsiveness of demand to changes in price. For gasoline, being an inelastic product, the costs would not fall, thereby reflecting the fact that the supply curve would shift to the left. However, there are plenty of factors that could influence the supply to halt or maintain a seamless flow such as the infrastructure, demand, taxes as well as subsidies offered from the end of government. As per the study by Aruga (2022), the supply curve goes to show that the price hike responds to a quantity rise as well and vice versa. Equilibrium is hard to be established for a product such as gasoline, thereby creating difficulties for both the producers and people consuming it. In the case of the 2021 gas price crisis in the UK, the automobile industry could be facing long-term sales issues due to the rise in the cost of gas and fuel. On the other side, the switch towards the electric vehicle concept would not be a wise solution either, as facilities required to power the batteries would still share a dependence on non-renewable energy sources.
The suppliers that would be able to deliver gas in the UK have been trimmed due to the inclusion of tough regulations. The energy price cap can be identified as one of those elements that are rising and creating trouble across the supplier base of natural gases.
According to the views of Majid et al. (2021), rules and restrictions of a nation in regards to the import and export of goods and services could cause a severe change in the supply and demand of those items. Tougher financial stress over the small-scale supplier base is causing difficulties for the UK to manage the crisis of gas price hikes in the nation. As for the 2021 gas price crisis in the UK, the oil price increase would stifle the growth of the economy in the long term. As stated by Hamie et al. (2021), the increase in natural gas supplies results in the price going down. However, the present situation in the UK and the geopolitical scenario is not helping the sources of supply to increase by any means. Henceforth, there is an expectancy that the fuel prices would continue to climb up as the supply shortage is to be seen in the coming days. The lifestyle of UK people shall also be under threat as for the winter season the power outage could practically take a toll on the standard of living as certain functions relying on gas energy across the residential areas might not run.
Conclusion
As per the developments across the study, it can be clearly inferred that there is a possibility for the UK to recover from the gas price increase crisis of 2021 in the form of having a better-developed infrastructure and policy to support the souring of natural gases more efficiently. On the contrary, the present-day situation is not favouring the nation, as the cost of gas is continually escalating, thereby hammering the economy in a brutal fashion. If the nation and its people are to resist the demand and supply issues surrounding natural gas, there has to be the inclusion of more secured suppliers for the product.
References
Ambrose, J. (2021) ‘Gas crisis fuels call for the UK to update energy security policy’, The Guardian. Available at: https://www.theguardian.com/business/2021/dec/15/gas-crisis-fuels- call-for-uk-to-update-energy-security-policy [Accessed on: 6 th February 2022]
Ambrose, J. (2021), ‘What caused the UK’s energy crisis?’, The Guardian. Available at:
https://www.theguardian.com/business/2021/sep/21/what-caused-the-uks-energy-crisis
[Accessed on: 6 th February 2022]
Aruga, K. (2022), ‘Energy and Waste Problems’, In Environmental and Natural Resource Economics, pp. 151-167.
Cook, M. (2021), ‘Trends in global energy supply and demand’, In Developments in Petroleum Science, 71, pp. 15-42.
Díaz, A.O. and Medlock, K.B. (2021) ‘Price elasticity of demand for fuels by income level in Mexican households’, Energy Policy, 151, p.112132.
Hamie, H. Hoayek, A. and Auer, H. (2021), ‘Modeling Post-Liberalized European Gas Market Concentration—A Game Theory Perspective’, Forecasting, 3(1), pp.1-16.
Han, K. Song, X. and Yang, H. (2021), ‘The pricing of shale gas: A review’, Journal of Natural Gas Science and Engineering, 89, p.103897.
Li, F. Yang, C. Li, Z. and Failler, P. (2021), ‘Does geopolitics have an impact on energy trade?’, Empirical research on emerging countries. Sustainability, 13(9), p.5199.
Majid, A. Mortazavi-Naeini, M. and Hall, J.W. (2021). ‘Efficient pathways to zero-carbon energy use by water supply utilities: an example from London, UK’, Environmental Research Letters, 16(10), p.105010.
Mensi, W. Rehman, M.U. Maitra, D. Al-Yahyaee, K.H. and Vo, X.V. (2021), ‘Oil, natural gas and BRICS stock markets: Evidence of systemic risks and co-movements in the time-frequency domain’, Resources Policy, 72, p.102062.
Mugaloglu, E. Polat, A.Y. Tekin, H. and Dogan, A. (2021), ‘Oil price shocks during the COVID-19 pandemic: evidence from United Kingdom energy stocks’, Energy Research Letters, 2(1), p.24253.
Pellini, E. (2021), ‘Estimating income and price elasticities of residential electricity demand
with Autometrics’, Energy Economics, 101, p.105411.
Plummer, R. (2022), ‘Will Russia-Ukraine tensions push up UK gas bills?’, BBC News. Available at: https://www.bbc.com/news/business-58637094 [Accessed on: 6 th February2022]
Saif-Alyousfi, A.Y. Saha, A. Md-Rus, R. and Taufil-Mohd, K.N. (2021), ‘Do oil and gas price shocks have an impact on bank performance?’, Journal of Commodity Markets, 22, p.100147.
Wen, J. Zhao, X.X. and Chang, C.P. (2021), ‘The impact of extreme events on energy price risk’, Energy Economics, 99, p.105308.
Assignment
BUECO5903 Assignment Sample
Instructions:
This assignment contains four questions. You are required to answer all four questions for assignment help.
This is an individual piece of assessment. Make sure your submission is an original
Submission - this means it must be the creation of the person submitting it.
You are required to explain your reasoning and use diagrams where appropriate.
Assessment weight: This assessment task constitutes 15 percent of the total assessment for this course.
Due date: Your instructor will advise you of the submission date of this assessment task.
Assignment to be submitted electronically in the drop box in your Moodle shell.
Question 1
a) Give the definition of GDP and explain what items are not included in its calculation?
b) How is GDP calculated using the expenditure approach?
c) How is GDP calculated using the income approach?
d) Explain the problem of "double-counting" and how it can be avoided in calculating GDP
Question 2
Assume that an economy is initially operating at the natural rate of output (full employment output). Use the AD-AS model to illustrate graphically the effects on price and output of an increase in government spending and a decrease in the cash rate. Explain your assumptions with respect to the range of aggregate supply of your analysis.
Question 3
Explain in detail the process of Monetary Policy transmission of an increase in the cash interest rate. Use relevant graphs to describe how a Central Bank’s action on the interest cash rate ripple through the economy and lead to the target policy goal. (Three connected diagrams should be used: (1) money supply and demand (2) investment demand schedule (3) AS/AD diagram. Interest rates is the variable that connects the first and second diagram).
Question 4
Using the World Bank’s World Development Indicators database, https://databank.worldbank.org/home.aspx,
a) Complete the following table.
*or latest available year
b) Produce a plot for each variable (GDP, gdp growth, inflation) comparing the four countries.
c) What can be inferred with respect to economic growth and price control in each of these economies?
Solution
Answer 1:
A - In macroeconomics, GDP or Gross Domestic Product represents total value of entire economic activities that take place in a country in a specific period of time, for example, one year (Dynan and Sheiner 2018). In measuring GDP, total market prices of all final goods and services, which are produced in a specific geographic location in a particular year, are considered.
In measuring GDP, some items are not considered. These are:
i. Goods and services, manufactured in other countries and imported
ii. Goods and services produced in previous year
iii. Goods and services, which are resold
iv. Goods and services that are sold in illegal process
v. Transfer payments
vi. Intermediate goods that are used as input in producing another good
B - GDP can be measured with the help of expenditure method. This method considers expenditures of all groups, which conduct economic activities in a year. In other words, this method considers all the expenditures that are made on final goods and services (Magdalena and Suhatman 2020). In this measure, four components are considered and these are private consumption (C), government spending (G), investment (I) and net exports (NX) (total exports- total imports). Hence, the formula of GDP using expenditure method is written as:
GDP = C+I + G +NX
C. In measuring GDP of a country, the income approach can be applied. This approach considers income of all production factors, which are, labour, capital, land and entrepreneur. Those factors contribute in the production of final goods and services of the country in a year. Consequently, labour, capital, land and entrepreneur receive their income in the form of wage, interest, rent and profit, respectively (Aitken 2019). Income approach depends on the accounting reality where all expenditure made on economic activities within the country equates with total income of all factors that produce final goods and services.
D. One can face the problem of double-counting at the time of measuring GDP of a country in a particular year. Double-counting implies the process of adding a product value for two times in the GDP measurement (Fforde 2021). To avoiding this problem of multiple counting, the value of final goods and services are not considered. Instead, the value-added method is considered in which value added in each stage of production is taken.
Answer 2:
In the vertical range of the Aggregate supply curve, an economy can produces output at its full employment level. At this stage, the movement of aggregate demand can change the price level only while output level remains unchanged. As the government spending increases, it leads the aggregate demand curve to move upward (Lisi 2021). Moreover, a decrease in the cash rate leads the borrowers to borrow money for investment and consumer expenditure purpose. As a result, the aggregate demand curve can shift upward. The situation is shown below:
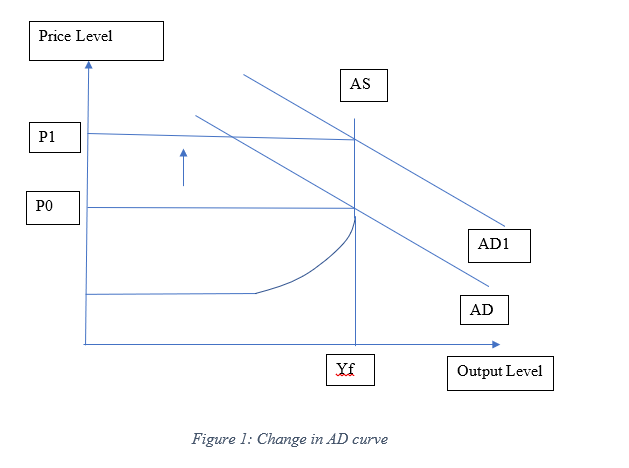
It is seen that as the AD curve shifts upward from AD to AD1, the price level will also increase from P0 to P1. On the other side, the output level will remain unchanged as it will be at the vertical segment or Classical range of the AS curve.
Answer 3:
The Monetary Policy Transmission is a process of changing cash rate. The process influences both the economic activity and inflation in the economy. As cash rate rises, expenditure in the private sector declines and it further influences total productivity of the firms to decline. This in turn cause economic activity and total employment to decrease (Chatziantoniou, Gabauer and Stenfors 2021). The following diagram shows the activity of the Central bank on the interest cash rate ripple. Here, the interest rate is taken as variable in the first two diagrams. The first diagram represents money supply and money demand curves, the second diagram represents investment demand schedule and the third diagram represents aggregate demand and supply curves.
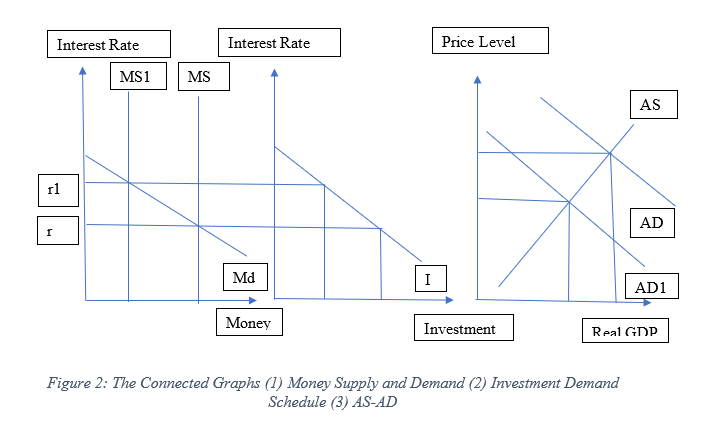
Answer 4:
a.
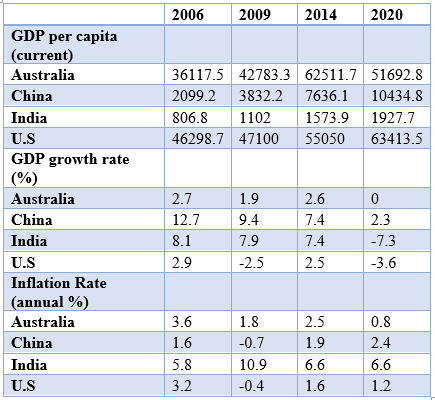
b.
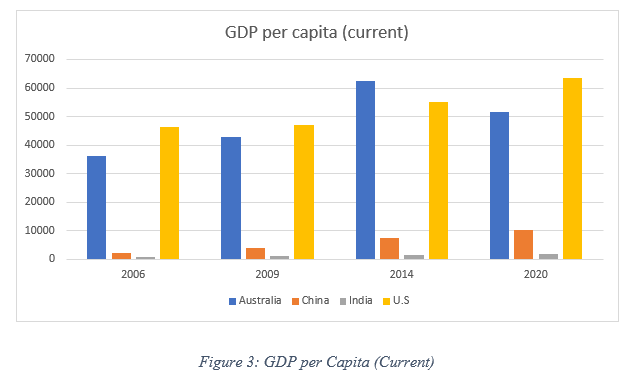
In figure 3, GDP per capita of Australia, China, India and US are compared for the years 2006, 2009, 2014 and 2020. In 2006, the GDP per capita of US was the highest followed by Australia. However, GDP per capita of China and India remained very low comparatively. The situation remained same in 2009. From figure, it is seen that GDP per capita of Australia and China increased in this year compared to that in 2006. In 2014, Australia’s GDP per capita increased considerably and it surpassed US. Moreover, China’s GDP per capita also increased in this year. In 2020, GDP per capita of the US, China and India increased while that of Australia declined.
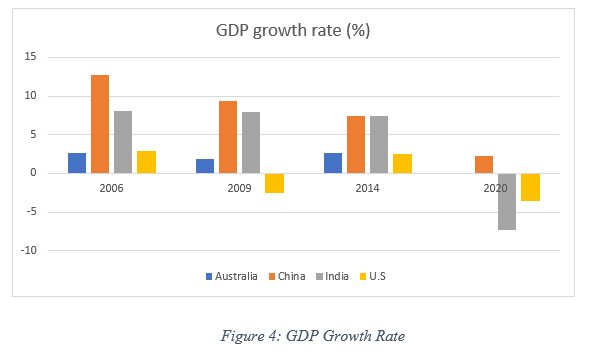
As per figure 4, GDP growth rate of China remained the highest in 2006 followed by Indian, US and Australia. In 2009, GDP growth rate of each country declined while that of US became negative. In 2014, US’s GDP growth rate was improved and became positive. In 2020, the GDP growth rate of Australia was nil while that of India and US were negative.
Inflation rate of India remained the highest in 2006, 2009, 2014 and 2020 compared to other countries. On the other side, Inflation rate of US and China became negative in 2009 which means these countries faced deflation.
c.
From the comparisons, it is understood that India needs to control its price for controlling inflation. China has gained significant economic growth over the years while Australia has also successfully maintained its economic growth.
References:
Aitken, A., 2019. Measuring welfare beyond GDP. National Institute economic review, 249, pp.R3-R16.
Chatziantoniou, I., Gabauer, D. and Stenfors, A., 2021. Interest rate swaps and the transmission mechanism of monetary policy: A quantile connectedness approach. Economics Letters, 204, p.109891.
Dynan, K. and Sheiner, L., 2018. GDP as a measure of economic well-being. Work. pap, 43.
Fforde, A., 2021. Measuring economic transformation–what to make of constant price sectoral GDP–evidence from Vietnam. real-world economics review, p.113.
Lisi, G., 2021. Can the AD-AS Model Explain the Presence and Persistence of the Underground Economy? Evidence from Italy. Economies, 9(4), p.170.
Magdalena, S. and Suhatman, R., 2020. The Effect of Government Expenditures, Domestic Invesment, Foreign Invesment to the Economic Growth of Primary Sector in Central Kalimantan. Budapest International Research and Critics Institute-Journal (BIRCI-Journal), 3(3), pp.1692-1703.
Worldbank 2022. World Development Indicators | DataBank. Available at: https://databank.worldbank.org/indicator/NY.GDP.MKTP.KD.ZG/1ff4a498/Popular-Indicators (Accessed: 22 January 2022).
Assignment
ECON1025 Prices and Markets Assignment Sample
Assignment Brief
The assessment is worth 50 marks and will be delivered as a question sheet on Canvas exactly two weeks before the submission deadline. Your submission will receive an automatic Turnitin similarity score that should not exceed 25%. You should check this score using the tool on Canvas before submitting. Exceeding this limit raises the risk of your submission being subject to an academic integrity process. As per University regulations late assignments receive a 10% penalty per day until the mark reaches zero. Marks will be given according to the rubrics on Canvas. You must attach a completed coversheet with your submission (template appended below). For the formatting requirements follow the advice given for assessment task 2 above.
Your submission should be a word-processed document not exceeding 2000 words. Any diagrams that you wish to use can be inserted into this document in any way you like, i.e. created in the word-processing software itself, or inserted as a photograph of a pencil drawing or from another software.
There is no discretionary margin above this limit. There is no minimum but you are advised to use all the words for assignment help allowed to allow for a more developed and detailed analysis.
Answer any FOUR of the following questions. Each question is worth a total of 12.5 marks. If more than four questions are answered, marks will be awarded for the first four answers only.
QUESTION 1
High-performance cars (HPCs) are automobiles with engines that generate great power relative to their weight. They boast high acceleration, speed, cornering and breaking performance. But they obviously come with a very high price tag. Some people even buy them to publicly display their wealth. The Singapore economy has grown rapidly between the 1960s and 2018 with rising incomes across the island. Examine the likely consequences of rising incomes on the Singapore HPC market and one or two related markets.
QUESTION 2
The speed limit on Singapore roads, even expressways, never exceeds 90 kmh, much less than the top speed of HPCs. But there is a road racing culture where individuals perform stunts and races on public roads, far exceeding speed limits. What, if anything should government do about the HPC market? Should such cars be banned outright? What would be the problems with such interventions?
QUESTION 3
The car industry is characterized by heavy research and development activity. This activity has a high fixed cost and can only be undertaken by large firms with significant monopoly power. Sometimes the innovations of the car industry spill over into other industries. There is also a great deal of product differentiation, with certain brands enjoying reputation and loyalty.
What are the likely effects of these aspects of the industry on the market structure for HPCs? Examine this industry using the theory and models of industry structure. Should government be worried about any aspect of how an industry with this market structure will perform?
QUESTION 4
BMW is one of the world’s best known HPC manufacturers. Developing new cars is a costly, uncertain and complex process. This company would need to consider which parts of the vertical chain to outsource and which to conduct in-house. Using the theory of the optimal boundary of the firm, discuss BMW’s make-or-buy decision for developing and producing a HPC. What stages of the vertical chain should BMW consider conducting in-house, and which should be outsourced? Provide reasons for your findings.
QUESTION 5
Consider the following hypothetical case. Only BMW and a competitor, Mazda, are considering launching a new, niche HPC in the Asian market. The issue is what price to charge. Both new cars are very similar in performance and production cost. Analyze the interaction between the two firms using game theory. Present a payoff matrix to model the situation and analyze it for Nash equilibrium. What can either of these firms do to make their best, most-preferred outcome more likely?
Solution
Question 1: likely consequences of rising incomes on the Singapore HPC market
High performance cars are considered a sign of wealth as rich people often showcase their status and flaunt their economic well-being. High prices of high performance cars imply that only a limited number of people are capable of buying those products in the market. High performance cars are considered to be a luxury commodity in the market as only a few people can afford to buy these products. However, rising economy of Singapore encourages its economic stakeholders to accumulate substantial wealth over the past few decades. Rapid growth from 1960 to 2018 has helped many people to change their fortune as they became wealthy during these periods. This has generated demand for high performance cars in the Singapore market as the capabilities of people buying similar kinds of cars has over this period. As per the studies done by Kern, Dossow & von Roon (2020), people tend to buy more expensive products with a rise in their income. Similar aspects could be observed in the Singapore market as demand for high performance cars would like to increase.
High performance cars apart from being a symbol of wealth possess high acceleration, speed, cornering along with breaking performance. The income elasticity of the high performance cars is positive as rising income enhances the affordability of those for the consumers. Rising market demand would cause the dealers to supply a higher volume in the Singapore market that would raise the overall supply of high performance cars. The market for high performance cars will see a boom as consistent growth of the Singapore market has established itself with a strong economy. The rapid growth of the Singapore economy has enabled the market players to infuse a huge amount of money that encouraged them to buy high performance cars in the market. According to the study of Ji et al. (2021), rising demand for any commodity would increase the price of that product in making it more experience. However, market equilibrium for high performance cars in Singapore would shift towards the right with further increases in the price in the market.
The price increase could be explained through comparative static models that compare different economic outcomes that can be observed after changes in exogenous parameters. In this scenario, demand for high performance cars is changed in the market through changes in income. Furthermore, the demand factor influences the price metric to change which raises the price of high performance cars in this case. The overall price of HPC will rise in the Singapore market although the growth of the economy would stimulate the demand in the market. This would raise the overall import items in the Singapore economy as car manufacturing companies would raise the supply in the market. As per the view of Sadiq et al. (2021), a rise in demand in a specific market often increases the demand in the related markets. Related markets such as customised parts or car paint would observe a growth in the market as the products are complementary.
Question 2: Government intervention in the HPC market and issues developed through intervention
High performance cars possess a high speed which is much higher than the restricted speed in the Singapore economy. Speed limit curbing the speed of vehicles does not allow the riders to enjoy the top speed of high speed cars as there remains racing culture among people. Individuals performing stunts or having a race on the public road could lead to fatal damages that may cause government intervention in the HPC market. As per the studies done by Basu & Ferreira (2020), government intervention allows a market to run properly as well helps in people getting benefits from the market. Restriction on sales of high performance cars could lower the chances of accidents on the road that would sufficiently help the people of that economy. Imposition on sale of high performance cars would discourage the wealthy population of the nation. The Government of Singapore further raised the speed limit in a specific time period along with special race tracks that would allow the cars to remain within a certain area.
High performance cars could be banned by the government of Singapore that would depress the HPC market. On the other hand, the banning of high performance cars would lead to the emergence of the black market in the country. According to the study of Adler, Peer & Sinozic (2019), market imposition of government often restricts the natural market composition that influences the shady market to grow. Furthermore, people of Singapore could buy high performance cars in different national markets and that could be imported into Singapore due to imposed market restrictions. These could lead to loss of taxes and other financial losses for the Singapore government arising due to government intervention in the market. However, banning cars would never solve the problems rather it would create further complications.
The emergence of a shady market is not helpful for the growth of the economy as the government does not get any financial benefits for transactions. The government will have no clue about the number of products sold in the market. As per the view of Bucsky (2018), market governance is necessary to have estimated about any specific market and transaction happening in that market. Furthermore, the government will be unaware of the shady deals that would occur in the parallel market. The parallel market assists in the growth and development of corruption that would cause a bigger issue for the government.
Market equilibrium in the high performance cars market would disrupt through the imposition of the Singapore government. It may lead to market failure as tough restrictions by the government could dry off the entire market. According to the study of Basu & Ferreira (2020), welfare loss happens due to the imposition of market restrictions as both producers and consumers waste their resources. High tax imposition could lower the sales of high performance cars that could help the government in lowering the number of cars in the market. The Singapore government could impose a higher import duty that would provide a similar effect as well.
Question 3: Market structure for HPC industry and governments worry on market performance
The global automobile industry is not that highly competitive as it is filled with various market producers. However, the market structure in the high performance car industry is oligopolistic markets as only a handful of market players dominate the industry. Target market of the high performance car industry always remained different as compared to the automobile industry. As per the studies done by Yin & Hamilton (2018), research and development is the crucial component behind the growth of high performance cars that can be managed through few market suppliers. Producers in the market are unable to carry the heavy research and developmental activities in the market in a regular manner. These aspects have implicated a few producers in the market who are the dominant force in the market.
The market producers have different brand valuations as they have some degrees of product differentiation. A certain amount of product differentiation causes a huge advantage in the market that allows some manufacturers to have a significant market advantage. According to the study of Minh (2020), brand valuation is another component that influences the market position of different car manufacturers. Furthermore, the brand valuation of a company comes through sufficient brand reputation that is acquired through proper servicing to consumers and efficient customer satisfaction. The car manufacturing companies with greater brand reputation allow a greater competitive advantage in the market that helps them in being a dominant force in the market.
Loyalty of the customers plays a crucial role in these aspects as car manufacturers with a higher brand reputation have a greater loyal customer base. As per the view of Horn et al. (2019), the customer retention rate of manufacturing companies depends on the loyal customer base that provides sufficient confidence to the companies in case launching new products in the market. Product differentiation allows car producers to develop different types of products in the market. High performance car industry possesses few manufacturers who have focused on the heavy research and development of their production system in a heavy manner. The car manufacturing companies possess a high fixed cost that provides a certain level of market entry barrier as very few producers are capable of sustaining the cost. This market entry barrier encourages the existing producers in the market to carry on the production activities as profitability remains higher.
The government must not worry about the existing market structure in the high performance car industry as few dominant producers are very competitive among themselves. However, the Singapore government must ensure that any single firm does not contain significant monopoly power in the market. According to the study of Horn et al. (2019), monopoly power could further disrupt the market as only one firm is capable of supplying products in the market which would result in loss of welfare in the market. Consumers could be exploited through the emergence of monopoly in the high performance car industry as a sole producer would satisfy the supply of the entire market. The government must ensure the car manufacturers do not form a cartel that would represent a monopoly manufacturing company itself.
Question 5: Market interaction between BMW and Mazda using Game theory
BMW and Mazda are two companies operating in the high performance car industry in the Asian market. Cars of both of the companies having similar features and providing the same performance lead to a case of no product differentiation in this scenario. Production cost of both the cars being the same implies the cost for these two vehicles will be identical. In this scenario, the application of game theory would be most useful helping to identify the market equilibrium. As per the studies done by Sun & Sun (2018), the payoff matrix model provides a visual representation of the best possible outcomes of strategic decisions for two different players.
The playoff model matrix for BMW and Mazda has been provided below,
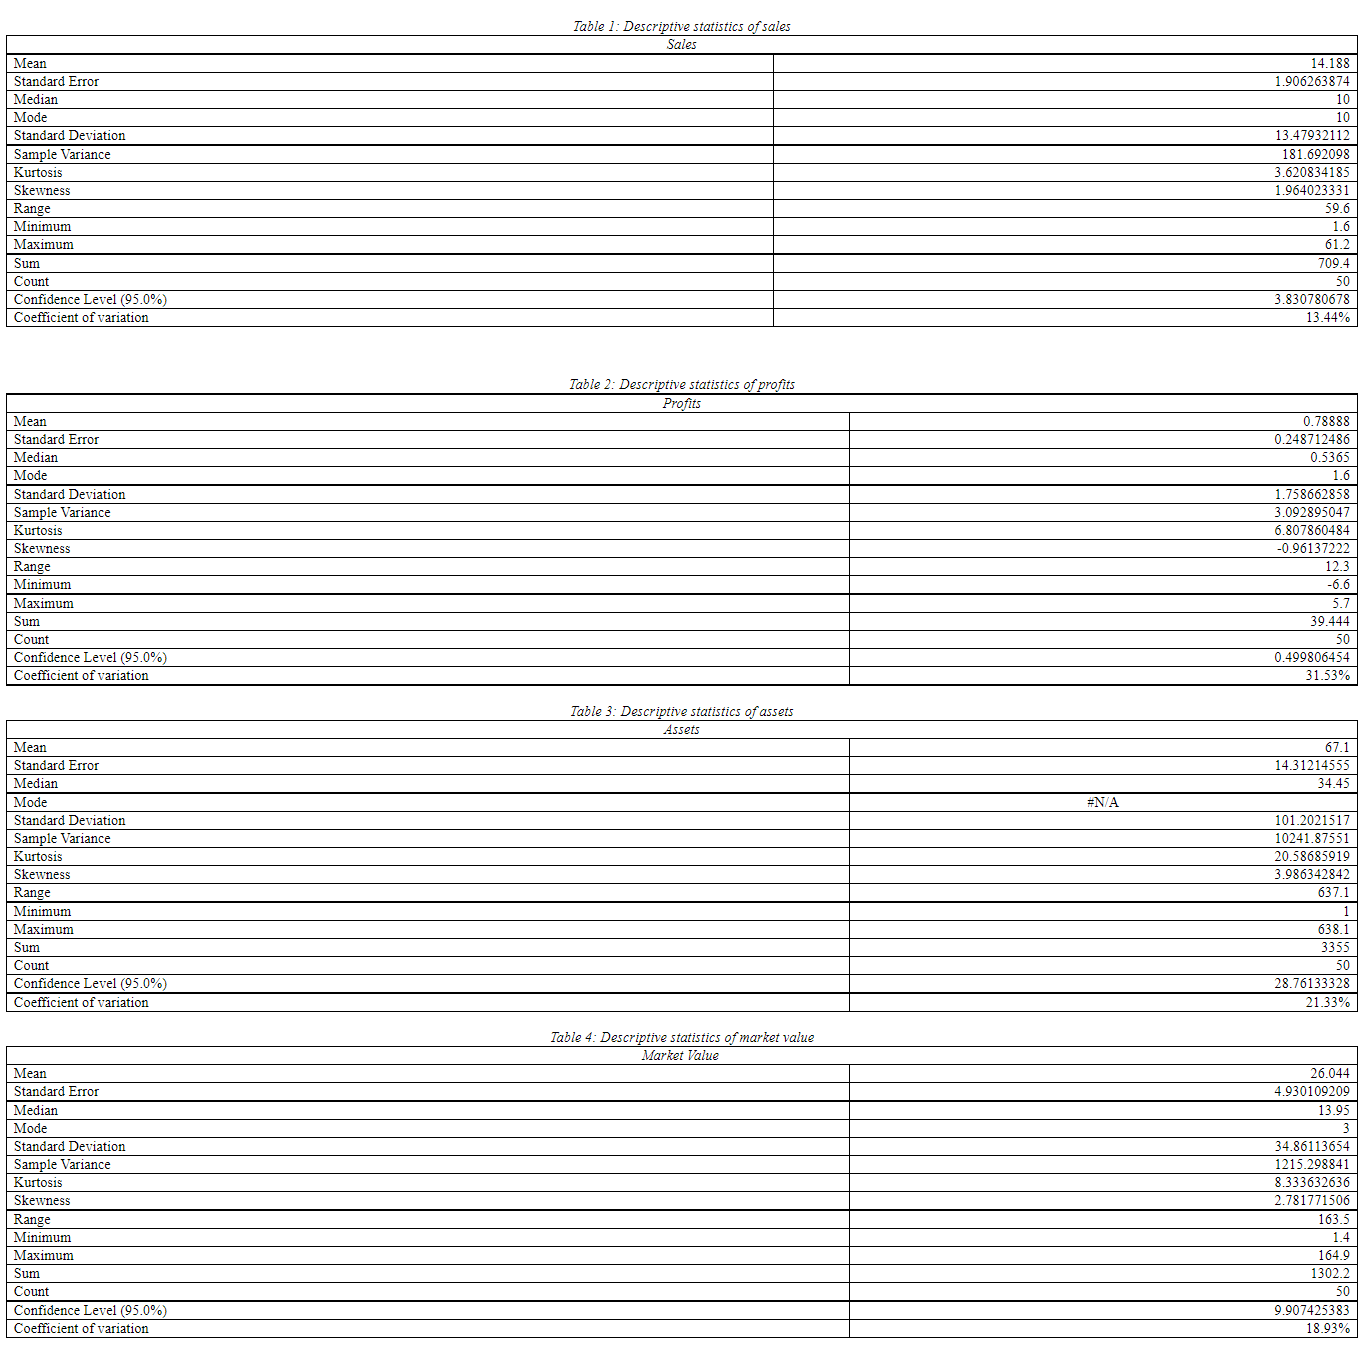
Table 1: payoff Matrix Model for BMW and Mazda
(Source: MS Word)
From the above matrix model it can be observed that the pricing of BMW and Mazda cars could be of two different levels which are 100000$, and 200000$. Furthermore, within the matrix, the market share for each of the cars has been provided based on the level of price for each of the high performance car manufacturing companies. It can be observed from the above table that the prices of both of the cars would lead to equal market share in the luxury car industry. Furthermore, one of the cars having different prices would lead to complete market acquisition for one car manufacturing company. Both of the cars having same production cost and identical products would lead to identical product pricing in the market. Cars having different prices in the market would lead to greater market accumulation by the other company. The company with a higher pricing policy would lose a heavy market share as consumers will shift to that other brand with lower cost (Ajay et al. 2019).
In this scenario, BMW will consider market pricing of 100000 USD as the company is beneficial irrespective of policy adoption of Mazda. BMW will accumulate 50 percent and 100 percent of the market while adopting the price of 100000$ which is higher as compared to the other pricing strategy of the company. Similarly, from the playoff matrix, it can be observed that Mazda having products pricing 100000 USD could lead to higher market acquisition as compared to other pricing strategies. According to the study of Koryagin (2018), Nash equilibrium from a payoff matrix model leads to conjugal outcomes that satisfy both of the players. Mazda can acquire a higher market share in the high performance industry irrespective of the pricing strategy of BMW with a market price of 100000 USD. Hence, both the car manufacturer company BMW and Mazda will adopt a price of 100000$ and the Nash equilibrium is (50, 50) in this case.
Reference
Adler, M. W., Peer, S., & Sinozic, T. (2019). Autonomous, connected, electric shared vehicles (ACES) and public finance: An explorative analysis. Transportation Research Interdisciplinary Perspectives, 2, 100038. https://www.sciencedirect.com/science/article/pii/S2590198219300387
Ajay, M., Kannan, S., Narayan, P. P., & Kumar, R. D. S. (2019). A Glance Through History of Automobile Industry and Current Market Study of Some of the Legendry Models in India. In Advances in Manufacturing Technology (pp. 433-441). Springer, Singapore.https://www.researchgate.net/profile/Tamilselvam-Nallusamy/publication/332488514_Mechanical_Characterization_of_Glass_Fiber-Strengthened_Balsa-Depron_Composite/links/5f97e8c292851c14bceac820/Mechanical-Characterization-of-Glass-Fiber-Strengthened-Balsa-Depron-Composite.pdf#page=426
Basu, R., & Ferreira, J. (2020). Understanding household vehicle ownership in Singapore through a comparison of econometric and machine learning models. Transportation Research Procedia, 48, 1674-1693. https://www.sciencedirect.com/science/article/pii/S2352146520306244/pdf?md5=ce396baaa396abdbf25538b2104f72e0&pid=1-s2.0-S2352146520306244-main.pdf
Bucsky, P. (2018). Autonomous vehicles and freight traffic: towards better efficiency of road, rail or urban logistics? Urban Development Issues, 58(1), 41-52. https://sciendo.com/pdf/10.2478/udi-2018-0022
Horn, M., MacLeod, J., Liu, M., Webb, J., & Motta, N. (2019). Supercapacitors: A new source of power for electric cars?. Economic Analysis and Policy, 61, 93-103.https://eprints.qut.edu.au/121172/1/__qut.edu.au_Documents_StudentHome_Group77%24_n8844577_Documents_PhD_Misc_EVdocs_Supercapacitors%20A%20new%20power%20source%20for%20electric%20cars.pdf
Ji, X., Zhang, Y., Mirza, N., Umar, M., & Rizvi, S. K. A. (2021). The impact of carbon neutrality on the investment performance: evidence from the equity mutual funds in BRICS. Journal of Environmental Management, 297, 113228. https://www.researchgate.net/profile/Muhammad-Umar-150/publication/353257462_The_impact_of_carbon_neutrality_on_the_investment_performance_Evidence_from_the_equity_mutual_funds_in_BRICS/links/60f542869541032c6d4e25b7/The-impact-of-carbon-neutrality-on-the-investment-performance-Evidence-from-the-equity-mutual-funds-in-BRICS.pdf
Kern, T., Dossow, P., & von Roon, S. (2020). Integrating Bidirectional Chargeable Electric Vehicles into the Electricity Markets. Energies, 13(21), 5812. https://www.mdpi.com/1996-1073/13/21/5812/htm
Koryagin, M. (2018). Urban planning: A game theory application for the travel demand management. periodica polytechnic transportation engineering, 46(4), 171-178.https://152.66.114.10/tr/article/download/9410/7826
Minh, N. K. (2020, April). Features and prospects of the electric vehicle in the Vietnamese automobile market. In IOP Conference Series: Materials Science and Engineering (Vol. 819, No. 1, p. 012007). IOP Publishing.https://iopscience.iop.org/article/10.1088/1757-899X/819/1/012007/pdf
Sadiq, M., Hsu, C. C., Zhang, Y., & Chien, F. (2021). COVID-19 fear and volatility index movements: empirical insights from ASEAN stock markets. Environmental Science and Pollution Research, 1-18. https://link.springer.com/content/pdf/10.1007/s11356-021-15064-1.pdf
Sun, S., & Sun, N. (2018). Management Game Theory (pp. XI-129). Singapore: Springer.http://ndl.ethernet.edu.et/bitstream/123456789/67572/1/447.pdf
Yin, J. Z., & Hamilton, M. H. (2018). The conundrum of US-china trade relations through game theory modelling. Journal of Applied Business and Economics, 20(8), 133-150.https://www.researchgate.net/profile/Michael-Hamilton-25/publication/331994158_The_Conundrum_of_US-
China_Trade_Relations_Through_Game_Theory_Modelling/links/5c9a44b7a6fdccd4603cc3d2/The-Conundrum-of-US-China-Trade-Relations-Through-Game-Theory-Modelling.pdf
Research
HI5003 Economics for Business Assignment Sample
Assignment Brief
Purpose of the assessment (with ULO Mapping)
i. Students are required to work in groups of 4 members to choose an industry/Sector of their choice. While working in a specific group, students are required to apply their knowledge learned in the course unit to write an industry/sector report (Learning Outcomes 1, 2, 3, 5).
ii. Also, students may choose to work as individual. In this regard, contact the Unit Coordinator specifying that you are working on your Group Assignment as INDIVIDUAL and not group.
iii. Finally, students should form their respective groups in the BB as INDIVIDUAL or GROUP of: 2 members or 3 members or 4 members, maximum.
See Assignment Specifications for detailed requirements
WEIGHT - 40%
Word Limit - 3000
Final industry research submission
(i) Due date: Week 10, Mid night Friday, May 28, 2021
(ii) Final submission research paper on you sector or industry should not exceed 3000 words
(iii) The assignment must be in MS Word format, single spacing, 12-pt Arial font and 2 cm margins on all four sides of the page with appropriate section headings and page numbers.
(iv) Reference sources must be cited in the text of the report, and listed appropriately at the end in a reference list using Harvard referencing style.
(v) Penalties apply for late submissions.
(vi) Students in a group are required to participate equitably in the group assignment and that students are responsible for the academic integrity of all components of the assignment. You need to complete the following table which identifies which student/students are responsible for the various sections of the assignment
Purpose:
This assignment aims to enhance students’ research and analytical ability through the application of their economics knowledge learned in the course unit to compose a company report.
The recommended assignment structure of final submission for assignment help is as follows:
• Table of content
• Executive Summary (Optional)
• Introduction
• Introduction to the company
• Industry/sector background
• The market structure of the industry/sector
• Factors that influence demand for the company’s product(s) or services
• Factors that influence supply of the company’s product(s) or services
• Elasticity
• Recent macroeconomic event that affected the industry/company and, Australia
• Recommendations
• Conclusion
• List of References.
Note*: The structure content is not limited to the items listed above. Creativity for a better report structure is a key requirement.
Detailed requirements of the assignment
You are a group of advisors to the Management Board in your company with Headquarters in Australia. As advisors you are first, required to conduct research on your selected sector/industry covering the previous 5-10 years. Second, you are required to present a company strategy to your Management Board covering the next 5 years. Third, your Management Board requires that you make a presentation of your findings and strategies, and you prepare a 3000-word market report. The market report should, as a minimum, address the following key issues:
Solution
Introduction
Economical management focuses on the level of growing demand, supply and macroeconomic event based on which the complete source of business in any industry is established. Moreover, the general scenario of economic development in the Dental industry is grabbed within the general and specialized services that cover up the complete market of Australia. This business report is based on an evaluation of the dental service industry and its macroeconomic analysis in the current business scenario. The dental industry focuses on maintaining and managing the oral health of the public that is highly developed across Australia. There isa total of 15000 private businesses that are running in both the rural and urban industry and one such company is Malo Clinic Brisbane that is being considered in this complete report. There are various services that are being provided by the company; however, this report only includes the economic scenario of CAD or computer-aided technology and its associated services such as Cast Partial Dentures (CPD) and many more.
Introduction to Malo Clinic Brisbane
Malo Clinic Brisbane is one of the largest dental companies in complete Australia that even focuses on the international markets. In the current scenario, the head office of Malo Clinic Brisbane Dental Lab is located in the Brisbance region of Australia. The company mainly focuses on providing specific dental prosthetic and other services associated with products such as Luminers, Valplast, biomedical grades and many more (Gcr.org, 2021). The company first introduced the concept of casting machine that changed the era of complete prostheses. Moreover, casting partial dentures (CPD), prosthetics, Laser-welding machine and many more made it grow its own way of perception in the global market. Later the huge innovative revolution in dentistry changed the view of people with elongation of CAD or computer-aided technology. Other than Australia, Malo Clinic Brisbane is actively working in more new regions with Better and specific staff. The vision of the company is to elevate the global population experience in the field of the dental fraternity as well as focus on establishing everlasting smile. In addition to this, the fraternity is maintained with the help of specific research and development (R&D), innovation, corporate social responsibility, and many more. In addition to this, Computer-aided technology (CAD) is an innovation that is highly being focused on by the Company.
Background of the Dental care service industry
The dental service industry is one of the branches of the Healthcare service industry that only concentrates on the issues and services of oral health. This is relatively a growing branch in the business of health services where the urban need is increasing with the simultaneous growth in the demand. There is more demand in the urban region than in the rural region in complete Australia. The market is majorly favored in the metropolitan areas and associated regions. Various new changes have appeared in this business sense where not only Dental health workers persist in the market; rather a dental hygienist, technician, and therapist role has initiated the growth of more than 36400 jobs by 2024 (Marcin, 2021, 145(2)).
In the current situation there are a total of 16400 dental practitioners in Australia; where 84% of them are focused only the private firms such as the Malo Clinic Brisbane. Thus 47% of the complete professionals are employed where on every 10 dental professionals 4 of them are female making it a count of overall 44% (Esfahani&Moosaali, 2016, p2(2)).
Market structure of the Dental service industry
There is an emerging market for the dental service industry in Australia. Two major types of dental services are being offered in the market; private and public. The government has introduced schemes in order to keep the dental safety of people. However, the demand for private streamlines is huge that even forced the people to take loans or insurance in order to keep the dental health. Thus, only 3% of the overall population encounters the development and management of dental health. On this note, it is to be noted that the Dental Service Industry in Australia is merely a representation of a perfectly competitive market scenario (Gmeiner, 2021, p.263(3)). In real terms, there exists an oversupply of dentists in Australia as a result of the exponentially increasing number of students entering Australian dental schools from time to time. On the demand side, due to the increased ageing population in Australia, there seems to be a rise in a number of dental implants and oral surgeries being performed. This, in a way, enables the Dental service industry to maintain somewhat an equilibrium position. The dental services are forecasted to the steady growth of a disposable income and demand for dental health services. In Australia, the majority of the demand is based on demographic and population ratio. Children, Toddlers and adolescents more likely to concentrate on consulting a dental professional as compared with the demand of adults (Fouda et al., 2017, p748(3)). In Australia, public services and private services mainly rule the complete market of the Dental industry. Here, companies such as Dentalife, Tut Skul and many more are the major leads off the market. However, Giants such as Henry Schein and Dentsply Sirona are some major leaders of this overall market.
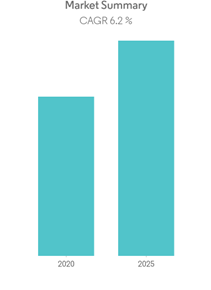
Figure 1: Market Summary of Dental Industry in Australia
(Source: Fouda et al., 2017, p748(3))
The above image illustrates that during 2018-2026, the size of dental industry is heavily increasing with the base year of 2020. The total CAGR is hence calculated to be 6.2%. The total market size of dental services in Australia is $10.1 billion in 2021. It contributes to 0.8% in the overall GDP of the Australia (Windle et al., 2018, p338(2)). Thus, in odd sense of complete and holistic health, dental health industry is growing with increasing occupational demands into the complete statistics of market of healthcare industry in the Australia.
Factors that influence demand for the Malo Clinic Brisbane
Malo Clinic Brisbane is developing with the increasing demand for the dental services in the Australia. The following factors have initiated the scene of increasing demand in the Australian market:
? Aging Population: Australia has a huge amount of increasing aging population that automatically changed the view of dental implants and dental surgery. Moreover, growing age leads to the senescent stage of cellular growth, where resistance towards new cells increases. This ultimately leads to damage in the Gum and dentine region increasing the demand forMalo Clinic Brisbane prosthetics and dentition surgeries. Moreover, there is a huge decrease in manual dexterity as well as it is being seen that the ageing population are being constantly affected by Co-morbidity. The medication of co-morbidity affects the longevity of dentine that increases the business demand (Hutter, 2021, p.56(2)).
? Increasing demand for oral hygiene: Oral hygiene is the recent trend that has attracted people to easily tend towards the business of dental modification and CAD treatment as used in the Malo Clinic Brisbane Dental labs. People especially with the risk factors of tobacco, odour mouth, smoking, dentine spaces and many more are seeking the Malo Clinic Brisbane for proper medications, surgery and other such tools. This dental caries is growing across the population gradient were diabetes and hypertension-related dental issues are continuously being encountered within the diameter of demand ratio.
? Trends in the prosthodontics segment: The market is gradually dependent upon the changes in the elevation of the treatment protocol. Here, in Malo Clinic Brisbane, the complete orthodontic, endodontic, periodontics and prosthodontics are all based on the R&D and innovation scenario. The major factor that has contributed to the increasing demand of prosthodontics is the prosthetics and demand for good look across the country. Thus, the presence of professional dental service has changed the way human perceived till date. These enhanced the way demand has increased in the Malo Clinic Brisbane (Esfahani and Moosaali, 2016, p.45(2)).
? Competitive Landscape: Dental profession is highly filled with competition. Not only big firms but professional, the public health sector, private practitioner and many more are still in this competitive market. Making a strong presence demands huge population interest that is achieved with the growth of CSR, CAD and other innovative tools that has changed the point of view of demand in the Malo Clinic Brisbane Dental Labs in Australia.
Thus, the above points illustrate a figure of growing demand of Malo Clinic Brisbane Dental Labs in entire Australia. Thus, the increasing demand is relatively focused on the management of complete supply. With the increasing demand of Malo Clinic Brisbane, the CAD services also come up with the inclined demand as the innovation for prosthetics and surgery increased. Meanwhile, dentine formation, gum restoration, artificial crown, and many more came up with this demand to manage the growing need. The dental laboratory hence increased to enhance their CAD services.
Factors that influence the supply of Malo Clinic Brisbane
Supply and demand are interrelated concepts where the growing demand increases the urge to enhance the supply and accordingly the balance between the profit and the revenue in the dental industry can be maintained. Subsequently, it is also seen that the Dental labour force model has changed the ratio of supply and demand in Malo Clinic Brisbane while operating in Australia.
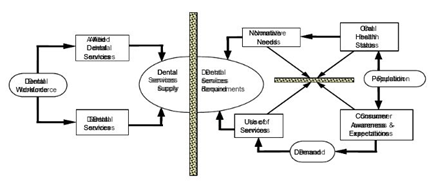
Figure 2: Relationship between Supply and Demand of Malo Clinic Brisbane
(Source: Lalloo& Kroon, 2017, p200(2))
The above image illustrates that the overall supply of the services has relied upon the Dental professional where they focus on Avoidance and management. Whereas the ratio of demand is based on the quantified elaboration of needs, oral health issues, consumer awareness, and many more factors as well as their expectations have changed the viewpoint of Malo Clinic Brisbane in Australia. So, the projection of supply of Malo Clinic Brisbane services is dependent upon the inflows and outflows of the stock of innovation, labour, and many more (Hutter, 2021, p.23(2)).
In order to focus on the scenario of supply management in Malo Clinic Brisbane, the following factors have enhanced the way of business perception and growth:
? Increasing demand: In the recent decade of changing performance, the demand for service of Malo Clinic Brisbane and dental health has increased in complete Australia. This in turn initiates the revolving factors of supply to manage the intense market. Moreover, the population increasing age, co-morbidity, and many more such manipulative factors have forced the growth of supply. These factors have also changed the view of innovation where the response to the demand and others is highly important for Malo Clinic Brisbane to remain in the market (Fouda et al., 2017, p.747(3)).
? Research & Development: Malo Clinic Brisbane Dental Labs have always focused on new scales of managing the condition of their patients. This demand supplement is changed with the view of innovation. Moreover, the demand in R&D and equipment management in Australia is completely closely tied to the demand and supply ratio. The development of CAD or computer-aided diagnosis is based on such factors that have enhanced its supply within Australia.
? Dental Labour: This is a highly important stock in the overall Australian dental channel as the Human resources supply is essential to maintain the demands (Lalloo and Kroon, 2017, p.202(2)). Malo Clinic Brisbane focuses on keeping a stock of such expertise to handle the complete organizational demand with more care.
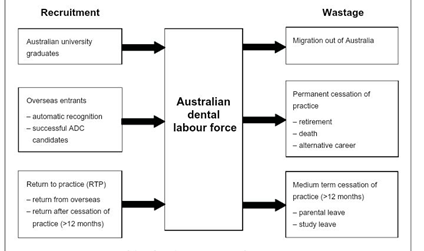
Figure 3: Dental recruitment and wastage supply model
(Source: Mbagwu et al., 2019, p1(2))
The above image is a flowchart explanation of how the new recruitments of dental labour can help the business of Malo Clinic Brisbane to focus on better supply. However, the change in panel can increase the risk of competition from those practitioners itself. Thus, after university graduates, the competition in the market increases that affects the supply of Malo Clinic Brisbane services in Australia.
? Allied demand in Dental services: There are various allied health workers such as staffs and other laboratory managers that are important for the supply of better services. In Australia, there are a total of 16400 dental practitioners and 2700 allied health workers that are actively important to aid the overall oral health of any people (Barenghi, et al., 2019, p3(2)). Here, both the factors such as the recruitment and the wastage vector permit the overall sensation of business development.
However, the balance between demand and supply is the major factor that makes up the complete economic development of Malo Clinic Brisbane in Australia.
Elasticity
In this context, cast partial Dentures to involve a cast metal framework containing artificial teeth set in an acrylic resin. The fact that such a dental procedure is more durable, stronger and retentive enhances the demand for it in the Australian market in recent times. It is substantial population growth and relative increase in life expectancy that indicates a growing need for such cast partial dentures.
However, taking the overall market scenario into consideration, the demand for it is observed to be elastic by nature (Andruszkiewicz et al., 2019). Widespread demand for fixed Prosthodontics is seen to show a drastic downfall in deliverance of cast partial denture as a mere treatment option in a number of partial edentulous situations (Laetitia et al., 2019, 23(2)).
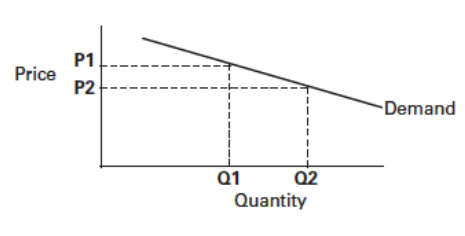
Figure 4: Elastic Demand for Cast Partial Dentures
(Source: Laetitia et al., 2019, 23(3))
From the above figure, it can be deduced that a rise in price level from P2 to P1 corresponds to a higher degradation in quantity demanded for cast partial dentures from Q2 to Q1 thus representing its elastic nature in a way. This might have mainly been a result of people showing willingness to switch over to the superior ones available in the market on increase in its price level (Marcin, 2021, p.36(2)).
Recent macroeconomic event that affected the Malo Clinic Brisbane
The growing oral health issues encountered the development of several preventive measures that the dentistry system accepts as CAD. The CAD program in the co-morbidity scenario was an important event that was focused by Malo Clinic Brisbane in Australia in order to control the oral health issues that affected majority of the Australians during the growing age as well as reflected on slow generation of disease. This macroeconomic event of CAD is still promoted by the Australian Dental association where emergency protocol CAD such as crowning and many more are being still provided in Malo Clinic Brisbane that has completely changed the viewpoint of people towards the health statistics (Igna, et al., 2018, p66(2)). CAD or computer-aided technology emerged as a technological profit where the company fastened their work of developing new crowns, tooth replacement and many more surgeries. Thus, the growth of the CAD program took a change with the growth and installation of exhibitions and other macroeconomic development that showcased the entire innovative scenario controlling the huge competition in the market.
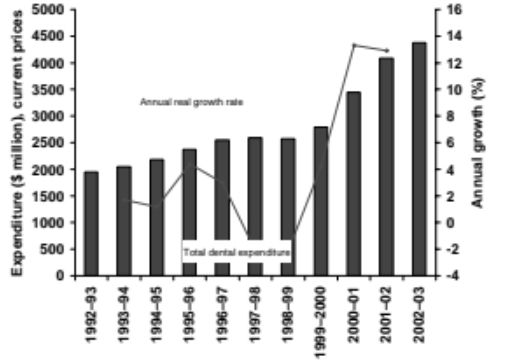
Figure 5: CAD/CAM technology
(Source: Adriana Postiglione et al., 2016, p3(1))
In addition to this, the growth of the dental labour is one of the important factors along with the scenario of management of demand and supply is also one of the major macroeconomic events in the Malo Clinic Brisbane based on which the complete economic development is changing. Preventive measures and innovation helped people to come to new places and settle along with increasing the market region for the Malo Clinic Brisbane (Al-Mussawi& Farid, 2016, p216(2)). Thus, with the growing demand, the structure of dental restoration emerged that made it important and changed the complete scenario of Malo Clinic Brisbane in the market. The technological advancement emphasized on the scenario of improving the designs and creating dental prostheses such as crows, crown lays veneers, inlays and outlays, dentures, and other orthodontics appliances.
The macroeconomic event has changed the market structure from 2016, where the demand is highly increasing to lower down the risk, increase productivity and manage the complete business market infrastructure accordingly (Parello, 2021, p.33(1)). CAM refers to the process of computer-aided manufacturing where artificial prosthetics, tooth replacement, manufacturing of crowns and many more are done. In dentistry, the innovation of CAD/CAM changed the perception of diagnosis and manufacturing that automatically led to the emergence in success and management of patients.
Recommendation
Focusing on the above context, it can be recommended that
- Malo Clinic Brisbane can focus on new innovations and R&D with CAD/CAM dentistry that can change the vision of total management and proper leadership. This calls for availability of scope for slight adjustments that are largely needed at time of Cast Partial Dentures in order to alleviate discomfort or pain.
- Malo Clinic Brisbane can even focus on proper recruitment of new expertise to control the growing competition in the Australian Market. Here, the development of allied health experts is also essential and can be focused to clearly aid the expertise. This holds essential in order to match the level of expectation of the individuals visiting the place at large.
- Proper advertisement and marketing policies can be used by Malo Clinic Brisbane in order to effectively build up the business. Awareness needs to be spread with regard to the fact that rehabilitation of a partially dentate patient is a vital form of dental treatment that is expected with competence from every qualified dentist and Malo Clinic Brisbane is the perfect place for it.
Conclusion
At the end of the overall discussion, it can be concluded that the dental industry is one of the growing industries in the Australia with major demands in the metropolitan cities with a probability that the economic growth can be easily managed. In this regard, Malo Clinic Brisbane is one such organization of Australia that is extended towards the international borders. Factors such as demographics, aging population and many more have increased the demand of Malo Clinic Brisbane in Australia. Similarly, supply is also enhanced with the evolution of CAD/CAM technology that changed the total scenario of macroeconomic development in the industry.
Reference List
A Fouda, G Fiorentini, F Paolucci (2017), Competitive Health Markets and Risk Equalisation in Australia: Lessons Learnt from Other Countries, Applied Health Economics and Health Policy, vol. 15, no. 6, pp. 745-754, https://www.proquest.com/docview/1990434605/2B4F512805F04B9DPQ/1?accountid=30552
A Igna, C Todea, E Ogodescu, A Porumb, B Dragomir, C Savin, S Ro?u (2018), DIGITAL TECHNOLOGY IN PAEDIATRIC DENTISTRY AND ORTHODONTICS, International Journal of Medical Dentistry, vol. 8, no. 2, pp. 61-68, https://www.proquest.com/docview/2091281274/A7300D7EC0004D30PQ/1?accountid=30552
A Windle, M Fisher, T Freeman, F Baum, S Javanparast, A Kay, M Kidd (2018), Increased private health fund involvement in Australia's primary health care: Implications for health equity, Australian Journal of Social Issues, vol. 53, no. 4, pp. 338, https://www.proquest.com/docview/2164988008/F55AC83A0A04B24PQ/1?accountid=30552
BS Adriana Postiglione, E Morais, RF Mazur, SR Vieira, NR Rodrigo (2016), CAD/CAM in dentistry - a critical review, RevistaOdontoCiencia, vol. 31, no. 3, https://www.proquest.com/docview/1904767610/CC9F79A5A3984930PQ/1?accountid=30552
C Hutter (2021), Cyclicality of labour market search: A new big data approach, Journal for Labour Market Research, vol. 55, no. 1, doi:http://dx.doi.org/10.1186/s12651-020-00283-9, https://www.proquest.com/docview/2480025869/CBF71E8389764741PQ/1?accountid=30552
CP Parello (2021). Free labor mobility and indeterminacy in models of neoclassical growth, Journal of Economics, vol. 133, no. 1, pp. 27-46, doi:http://dx.doi.org/10.1007/s00712-020-00728-2, https://www.proquest.com/docview/2520050028/56C5E425954146EBPQ/1?accountid=30552
CR Laetitia, P Ditlopo, JA White, D. Blaauw (2019), Socio-economic characteristics and career intentions of the WiSDOM health professional cohort in South Africa, PLoS One, vol. 14, no. 10, https://www.proquest.com/docview/2307382405/D826088CF002456DPQ/1?accountid=30552
FC Mbagwu, IB Okoye, GC Umunnakwe (2019), Oral health disease and library service delivery among library staff of the universities in Nigeria, Library Philosophy and Practice, pp. 1-18, https://www.proquest.com/docview/2216870413/78910966B850407FPQ/1?accountid=30552
Gcr.org 2021, Malo Clinic Brisbane. Available at: https://gcr.org/c/malo-clinic-brisbane-brisbane-city [Accessed on 19.05.2021]
J Andruszkiewicz, J Lorenc, A Weychan (2019), Demand price elasticity of residential electricity consumers with zonal tariff settlement based on their load profiles, Energies, 12(22) doi:http://dx.doi.org/10.3390/en12224317, https://www.proquest.com/docview/2317091839/C4211B91FCA943DAPQ/3?accountid=30552
L Barenghi, A Barenghi, C Cadeo, AD Blasio (2019), Innovation by Computer-Aided Design/Computer-Aided Manufacturing Technology: A Look at Infection Prevention in Dental Settings, BioMed Research International, vol. 2019, pp. 15, https://www.proquest.com/docview/2275055836/B6BC18163E5F45D9PQ/1?accountid=30552
OF Esfahani, F Moosaali (2016), Awareness and knowledge of patients toward dental implants as an option in replacing missing teeth: A survey in Kerman, Iran, Journal of Periodontology & Implant Dentistry, vol. 8, no. 2, pp. 43-48, https://www.proquest.com/docview/1891270144/5B9BC1D3CD794BA2PQ/1?accountid=30552
Q Grundy, S Mazzarello, S Brennenstuhl, EA Karanges (2021), A comparison of educational events for physicians and nurses in Australia sponsored by opioid manufacturers, PLoS One, vol. 16, no. 3, https://www.proquest.com/docview/2502780894/82D6A668F22C459CPQ/1?accountid=30552
R Al-Mussawi, F Farid (2016), Computer-Based Technologies in Dentistry: Types and Applications, Journal of dentistry, vol. 13, no. 3, pp. 215-222, https://www.proquest.com/docview/1836549507/FEDCD20D82CA4476PQ/1?accountid=30552
R Gmeiner (2021), Amimetic assets and persistent profits under competition, Review of Austrian Economics, vol. 34, no. 2, pp. 253-277, doi:http://dx.doi.org/10.1007/s11138-019-00470-z, https://www.proquest.com/docview/2521815895/2EB4AEA4DCE94247PQ/1?accountid=30552
R Lalloo, J Kroon (2017), Impact of dental National Partnership Agreements on public dental service waiting lists in Queensland, Australian and New Zealand Journal of Public Health, vol. 41, no. 2, pp. 199-203, https://www.proquest.com/docview/2290216613/9E7DC428BD64D99PQ/1?accountid=30552
W Marcin (2021), Spatial matching on the urban labor market: Estimates with unique micro data, Journal for Labour Market Research, vol. 55, no. 1, doi:http://dx.doi.org/10.1186/s12651-021-00293-1, https://www.proquest.com/docview/2509109532/EF94543E988440E5PQ/1?accountid=30552
Case Study
ECON6001 Economic Principles Assignment Sample
Case Study Assessment 3
Assignment Brief
Individual/Group - Group
Length - (2000 words +/- 10%)
Learning Outcomes:
(a) Analyze, individually and in teams the role of fundamental microeconomic and macroeconomic principles in business decision-making.
(b) Critically evaluate the applicability of various theories to economic policies and business decision making related problems.
(c) Critically evaluate the role and impact of various forms of government intervention in the economy including business implications.
(d) Communicate complex economic concepts to business professionals.
Submission - by 11:55pm AEST/AEDT Sunday of Module 5.2 (week 10)
Weighting - 25%
Total Marks - 100 Marks
Context:
COVID-19 continues to adversely affect economies and is burdening the fiscus of many economies globally. It has implications not only on national budgets but on macroeconomic management.
This assessment aims at:
• Assessing the students’ ability to critically analyse the impact of COVID-19 on key sectors of the pair of countries given, one from the ASEAN nations and another from Asia Pacific nations.
• Testing the students’ ability to perform a comparative analysis of the impact of COVID-19 on the forecast macroeconomic performance in 2021 and 2022
• Testing students’ evaluation of the efficacy of fiscal policy in dealing with the COVID-19 induced recessions
• Evaluating the students’ understanding of the concept of quantitative easing and how it has been used, if any, to assist in combating the COVID-19 induced recessions.
Instructions:
In a group of three (3) students, for case study assignment help you are required to complete this assessment task considering the following:
(a) Your facilitator is going to allocate to your group, a pair of countries from the following table of countries:
Selected ASEAN countries Selected Asia Pacific Countries
Malaysia Japan
Philippines India
Singapore Indonesia
Thailand Hong Kong
Cambodia South Korea
Myanmar Bangladesh
New Zealand
Vietnam Australia
Brunei Singapore
Indonesia Philippines
Vietnam Malaysia
Thailand Hong Kong
Singapore New Zealand
Singapore Hong Kong
Focusing on the five main sectors of the allocated pair of countries, perform a critical comparative discussion of how they have been affected by COVID-19. (15 marks)
(b) On the basis of that information and other sources of data, compare the countries’ projected macroeconomic performance in 2021 and 2022, your discussion should focus on real GDP, unemployment and inflation. Sources of useful data could be government websites, think tanks, IMF, OECD, Asian Development Bank and the World Bank. (10 marks)
(c) Discuss how these two countries have used fiscal policy in combating the COVID-19 recession. (10marks)
(d) Critically evaluate the following statement, “Fiscal policy should lead and monetary policy follows in dealing with the recession as a result of COVID-19”. Discuss this in the context of the two allocated countries and any third country from the table of countries given above. (10 marks)
(e) Quantitative easing (QE) is one of the untraditional monetary policy approaches that can be used by central banks. Discuss how it can be used to deal with severe economic crises such as the recession caused by COVID-19. To what extent have these countries (the three in part (d)) used this unconventional monetary policy tool to contain the recession emanating from the advent of COVID-19? (10 marks)
Consider the following:
• Use reliable data sources such of those of international organizations such as country government websites, IMF, World Bank, OECD, Asia Development Bank, journal articles by economists and academics
• Remember to cite inside the report the sources of information used and include the reference list at the end.
• You are expected to take a critical approach when writing the report.
• A peer review is expected. This is where you tell the audience how you organized yourself as group to work on the project. Challenges, difficulties and success stories must be told. It is important to be truthful about the group dynamics and perhaps even tell us what you learnt about working in a team. The peer review is worth 5 marks.
Students usually ignore this part and as a result throw away 5 marks unnecessarily.
Submission Instructions:
Submit this task via the Assessment link in the main navigation menu in the ECON6001 Principles of Economics folder. The Learning Facilitator will provide feedback via the Grade Centre in the LMS portal. Feedback can be viewed in My Grades.
I declare that except where I have referenced, the work I am submitting for this assessment task is my own work. I have read and am aware of Torrens University Australia Academic Integrity Policy and Procedure viewable online at https://www.torrens.edu.au/policies-and-forms
Solution
Executive Summary
The report emphasizes on the impacts of the COVID-19 pandemic situation on the economy and industries of India and Philippines, with the purpose of discussing the policy frameworks of the concerned nations and their implications in this aspect. The primary industries and sectors of both the countries can be seen to have been adversely affected by the ongoing pandemic crisis. Both the concerned countries can be seen to have used fiscal policies extensively to boost their economies out of the recessionary situation caused by the ongoing COVID-19 pandemic crisis. However, unlike that of India, Philippines could not incorporate a huge relief package under its fiscal policy frameworks for the COVID-19 pandemic situation and this is mostly due to the lack of such resources for the small and developing nation like Philippines. Fiscal policies can be seen to have been prioritized and there has also been incorporation of different extents of quantitative easing, not only in India and Philippines but also in the developed countries like that of Australia in the present period.
Introduction
Overview of the Report
Every country across the world can be seen to have different growth patterns and trends in economic development and much of the same can be seen to be related to the primary industries and their contribution to the growth of the concerned economies as well as on the economic policies that are taken by the governments of the concerned countries. However, the growth and performance of the economies and the industries operating in the same, can be seen to be considerably affected by different internal as well as external fluctuations taking place across the globe and in the country itself (Deb et al., 2020). One such fluctuation or phenomenon of immense importance is that of the ongoing crisis of the COVID-19 pandemic across the globe, that has not only led to deaths of millions of people, but can also be seen to be causing immensely negative implications on the businesses, industries and economies of almost all the nations across the globe.
Purpose of the Report
Keeping this into consideration, the concerned document emphasizes on the impacts of this pandemic on the economy and industries of India and Philippines, with the purpose of discussing the policy frameworks of the concerned nations and their implications in this aspect.
Comparison of five main sectors and their performance in COVID-19
India has been performing impressively in the global economic framework over the years and is considered to be one of the most prominent developing nations across the globe. The primary industries or sectors of the concerned country, that can be seen to be contributing impressively in the GDP of the concerned country, can be shown with the help of the following figure:
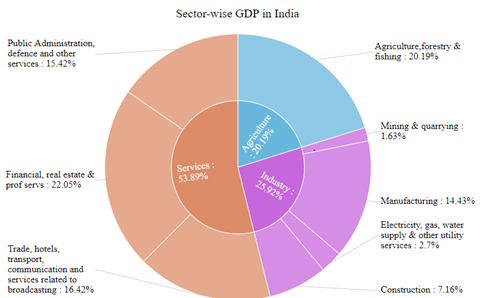
Figure 1: Primary sectors and their contribution to the GDP of India
(Source: Statisticstimes.com, 2021)
The textile sector, the real estate sector, the agricultural sector, the manufacturing sector and the tourism sector can be seen to be the top five and prominent sectors in India, contributing substantially to the growth and the GDP of the concerned country over the years. However, the ongoing crisis of the COVID-19 pandemic situation can be seen to have affected these major industries and their profitability and revenue generation, much of which can be attributed to the lockdowns and the restrictive measures that are being taken by the government of India to contain the spread of the COVID-19 pandemic situation (Mckinsey.com, 2021). The effects of the concerned pandemic situation on these industries can be shown with the help of the following figure:
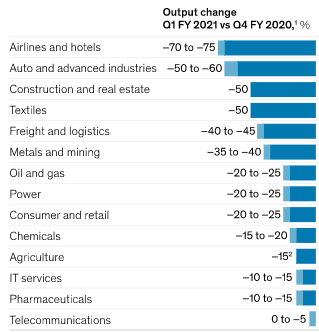
Figure 2: Impacts of the COVID-19 pandemic situation on the outputs of the different sectors
(Source: Mckinsey.com, 2021)
The construction sector, tourism sector and the textile sector can be seen to have been majorly affected and the effects can also be seen to be severe in the different manufacturing operations and in the agricultural sector (Pib.gov.in, 2021).
On the other hand, the contributions of different sectors to the GDP of Philippines, over the years, can be shown as below:
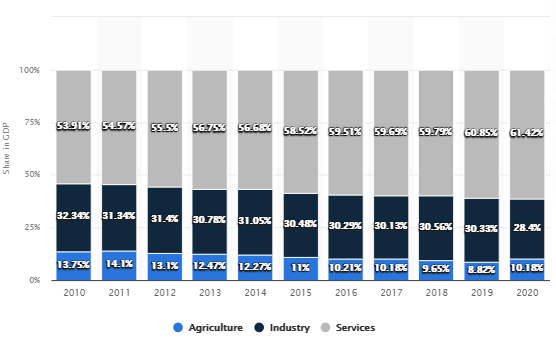
Figure 3: Contributions of different sectors to the GDP of Philippines
(Source: Statista.com, 2021)
The tourism sector, the agricultural sector, the real estate sector, outsourcing, retailing and the construction sector can be seen to be the top five industries or sectors contributing massively to the economic growth of the concerned country (Unido.org, 2021). There has been nearly 80% decline in the tourism demand in the concerned country due to the ongoing COVID-19 pandemic situation, while there has also been considerable reduction in the production volumes of the general manufacturing sector of Philippines as shown below:
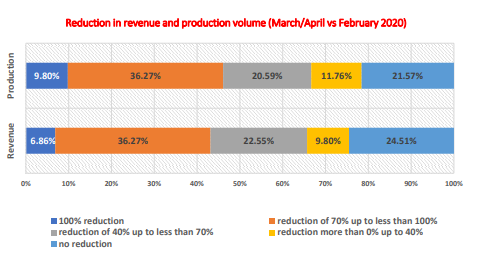
Figure 4: Reduction in production volumes of the manufacturing industries in Philippines due to the COVID-19 pandemic situation
(Source: Unido.org, 2021)
The agricultural sector has been comparatively less affected while there have been substantial implications of the pandemic situation on the retail and the outsources sectors of the concerned country, much of which can be attributed to the changing demands and preference patterns for the products and services of the concerned sectors of Philippines.
Comparison of the projected macroeconomic performance of India and Philippines in 2021-2022
The two countries considered in this report are expected to have differences in their projected macroeconomic performances, based on the ways in which they are trying to mitigate the adverse impacts of the COVID-19 pandemic crisis situation on their economies. India, is expected to have an increase in the GDP in 2021, with the expected GDP being 2850 billion USD in 2021 and the same is expected to grow further to around 3000 billion USD in 2022. However, the growth of Philippines is expected to be slower in the coming years, with the expected GDP to be 373.00 USD billion in 2021 and 379.00 USD billion in 2022 and this may be due to the slower recovery of the concerned nation from the impacts of the ongoing pandemic crisis (Data.worldbank.org, 2021). The unemployment in Philippines is expected to have the following trends with the slow recovery of the economy:
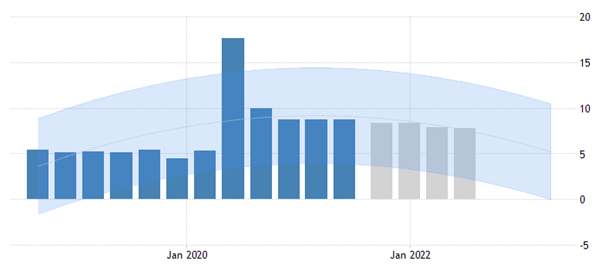
Figure 5: Predicted unemployment in Philippines in 2021-2022
(Source: Tradingeconomics.com, 2021)
However, although India also experienced a considerable spike in the unemployment due to the pandemic situation and the consequent lockdowns and restrictive measures, it is expected to experience a more impressive fall in the unemployment rate in both 2021 and 2022:

Figure 6: Projected unemployment rate in India in 2021-2022
(Source: Tradingeconomics.com, 2021)
The projected evidences highlight that while Philippines will be having a stagnated fall in unemployment in 2021 without much changes in 2022, India is expected to experience a continuous fall in unemployment in both 2021 and 2022 with the recovery of the concerned economy (Statisticstimes.com, 2021).
There will also be a fall in the inflation, as expected for India, and this may be due to the fall in prices of products and services for boosting the demand in the concerned economy in the COVID-19 aftermaths, as shown below:
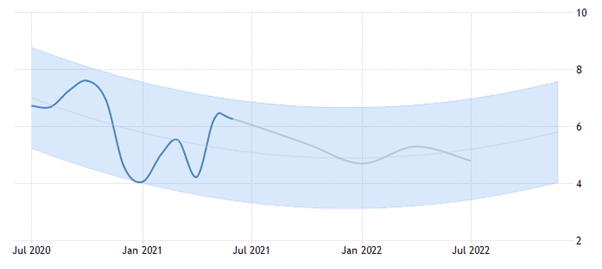
Figure 7: Expected inflation rate in India in 2021-2022
(Source: Tradingeconomics.com, 2021)
However, the inflation rate for Philippines is expected to experience a constant decline in 2021 and 2022 and this can be shown as below:
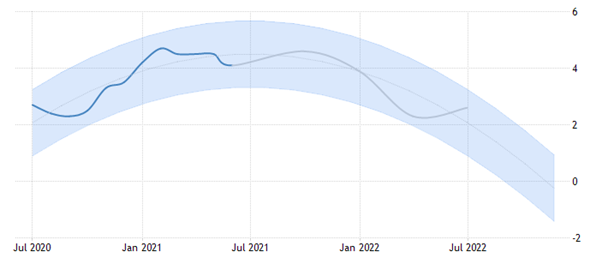
Figure 8: Expected inflation rate of Philippines in 2021-2022
(Source: Tradingeconomics.com, 2021)
This can be due to the fact that due to the slow recovery of the economy of Philippines from the pandemic situation, the recessionary phase is expected to be prolonged in case of Philippines as compared to India.
Usage of fiscal policies for combating the COVID-19 recession
Both the concerned countries can be seen to have used fiscal policies extensively to boost their economies out of the recessionary situation caused by the ongoing COVID-19 pandemic crisis. In case of India, the government had launched a fiscal package of 22 billion USD for supporting the businesses, investments and also to strengthen the “Make in India” program, thereby supporting the small and medium industries in the concerned country. There are also different employee support programs and unemployment support as well as health care packages that have been incorporated under the fiscal policies of the concerned country to combat the COVID-19 recession (Home.kpmg, 2021). There have also been tax cuts incorporated by the government of India and similar fiscal policies can also be seen to have been implemented by Philippines to combat the recessionary effects of the ongoing pandemic crisis. However, unlike that of India, Philippines could not incorporate a huge relief package under its fiscal policy frameworks for the COVID-19 pandemic situation and this is mostly due to the lack of such resources for the small and developing nation like Philippines. However, there has been special risk allowances for health workers that have been launched by the concerned country, which is similar to the health insurances that have been implemented for the health workers of India, by the government of the concerned country.
Evaluation of the statement in terms of India, Philippines and Australia
There is a notion that in case of a recessionary situation, the fiscal policies are more effective and should be prioritized and the monetary policies should accompany the same. This has been the case for both India and Philippines as well as for the developed nations like that of Australia in combatting the recessionary effects caused by the ongoing COVID-19 pandemic situation. In case of India as well as Philippines, extensive tax cuts and exemptions are evident. On the other hand, Australia can be seen to have launched an elaborate fiscal relief package as well as programs like that of the Job-Keeper program to support the businesses to retain their workforces during the pandemic situation. These can be seen to be similar to that of India, which has also prioritized in providing direct support to the businesses and the general population of the concerned country (Imf.org, 2021). However, the policies taken by India can be seen to be a mixture of the fiscal as well as the monetary policies, and the monetary policies include more relaxed borrowing and lower interests which can also be seen to be similar in case of Australia. Philippines, on the other hand, can be seen to have mostly emphasized on fiscal policies than that of the monetary policies although there have been changes in the rate of interests in the concerned country, which has been done to boost the borrowing and the investment operations in the country to mitigate the recessionary situation caused by the ongoing pandemic crisis (Home.kpmg, 2021). Thus, it can be asserted that in case of the concerned three countries, fiscal policies have been prioritized and monetary policies have been supportive policies to combat the negative impacts of the COVID-19 pandemic situation on the respective economies of the concerned three countries.
Quantitative Easing and its usage to contain the COVID-19 recession by the three countries
The quantitative easing is an unconventional monetary policy, which is taken to increase the money supply, investment and lending activities in an economy and this is done by the central bank of an economy, by purchasing longer-term securities in the open market and is especially incorporated in recessionary situations. India, in the present period, can be seen to be incorporating this quantitative easing policy, to combat the stagnant economic situation created by the COVID-19 pandemic situation. To stimulate the economy, in 2020-2021, the Reserve Bank of India has bought bonds worth more than 14 billion USD to increase the money supply in the economy, which in turn is expected to help in boosting the investments and the lending activities in the economy, thereby contributing potentially in the expansion of businesses and the production activities in the concerned country (Bloomberg.com, 2021).
The Reserve Bank of Australia, can also be seen to have started with the quantitative easing policy, with an amount of more than 80 billion dollars being spend on the QE program, where Australian government bonds are being purchased and 20 billion dollars is being spent on purchasing the state and territory government bonds by the concerned nation. This has been helping the government to stimulate the economy by increasing the money supply and it is working as evident from the impressive recovery of the Australian economy, the business activities and the investments in the business operations in the aftermath of the COVID-19 pandemic situation (Imf.org, 2021). Like that of Australia and India, Philippines can also be seen to be taking the quantitative easing measures by buying up the government securities and this is being done directly to avoid the deflationary situation created by the COVID-19 pandemic situation. However, in case of Philippines the level of bond buying and quantitative easing can be seen to be lower than expected. Nevertheless, all the nations considered in this case, can be seen to be incorporating the unorthodox monetary policy of quantitative easing at different extents to mitigate the recessionary impacts of the ongoing COVID-19 pandemic situation (Pib.gov.in, 2021).
Conclusion
The above discussion makes it evident that the COVID-19 pandemic situation has been affecting the economies of different nations adversely and this is evident in case of both India and Philippines, as can be seen from the effects of the same on the top five industries of both the concerned countries. There is different fiscal as well as monetary policies that can be seen to be incorporated by the governments of these two countries as well as by the government of developed nation like that of Australia to mitigate the adverse effects of the ongoing COVID-19 pandemic situation and there are also evidences those fiscal policies are gaining more emphasis and prioritization in case of these countries to take their respective economies out of the recessionary situations. However, different extents of quantitative easing can also be seen to be taking place in these countries and these are being done to increase money supply, lending and investments and to decrease the recessionary situations in the economies of these concerned countries in the COVID-19 pandemic situation.
References
Bloomberg.com. (2021). Bloomberg - Are you a robot? Bloomberg.com. Retrieved 2 August 2021, from https://www.bloomberg.com/news/articles/2021-04-07/india-s-central-bank-holds-rate-as-virus-surge-risks-recovery.
Data.worldbank.org. (2021). GDP growth (annual %) | Data. Data.worldbank.org. Retrieved 2 August 2021, from https://data.worldbank.org/indicator/NY.GDP.MKTP.KD.ZG.
Deb, P., Furceri, D., Ostry, J. D., & Tawk, N. (2020). The economic effects of Covid-19 containment measures. https://www.elibrary.imf.org/view/journals/001/2020/158/article-A001-en.xml
Home.kpmg. (2021). Philippines: Tax developments in response to COVID-19. KPMG. Retrieved 2 August 2021, from https://home.kpmg/xx/en/home/insights/2020/04/philippines-tax-developments-in-response-to-covid-19.html.
Imf.org. (2021). Policy Responses to COVID-19. imf.org. Retrieved 2 August 2021, from https://www.imf.org/en/Topics/imf-and-covid19/Policy-Responses-to-COVID-19.
Mckinsey.com. (2021). Getting ahead of coronavirus: Saving lives and livelihoods in India. mckinsey.com. Retrieved 2 August 2021, from https://www.mckinsey.com/featured-insights/india/getting-ahead-of-coronavirus-saving-lives-and-livelihoods-in-india.
Pib.gov.in. (2021). Fiscal and monetary policies to deal with slowdown due to COVID-19. Pib.gov.in. Retrieved 2 August 2021, from https://pib.gov.in/PressReleasePage.aspx?PRID=1656925.
Statista.com. (2021). Philippines - share of economic sectors in the gross domestic product 2020 | Statista. Statista. Retrieved 2 August 2021, from https://www.statista.com/statistics/578787/share-of-economic-sectors-in-the-gdp-in-philippines/.
Statisticstimes.com. (2021). India GDP sector-wise 2020 - StatisticsTimes.com. Statisticstimes.com. Retrieved 2 August 2021, from https://statisticstimes.com/economy/country/india-gdp-sectorwise.php.
Tradingeconomics.com. (2021). Philippines Inflation Rate | 1958-2021 Data | 2022-2023 Forecast | Calendar. Tradingeconomics.com. Retrieved 2 August 2021, from https://tradingeconomics.com/philippines/inflation-cpi.
Tradingeconomics.com. (2021). Philippines Unemployment Rate | 1994-2021 Data | 2022-2023 Forecast | Calendar. Tradingeconomics.com. Retrieved 2 August 2021, from https://tradingeconomics.com/philippines/unemployment-rate.
Unido.org. (2021). IMPACT ASSESSMENT OF COVID-19 ON THE PHILIPPINE’S MANUFACTURING FIRMS. Unido.org. Retrieved 2 August 2021, from https://www.unido.org/sites/default/files/files/2021-03/UNIDO%20COVID19%20Assessment_Philippines_final pdf
Research
HI5016 International Trade and Enterprise Assignment Sample
Students are expected to demonstrate their knowledge and understanding of a chosen topic by applying international trade theories and concepts learnt during Week 1 to Week 9. The in-depth analysis of the chosen topic, should be supported by data/statistics, figures, tables and relevant literature.
In this assignment,students are required to do betterthan recycle the lecture materials. Students are to research the chosen topic in more depth providing evidence of independent research.
Detailed Requirements of the Assignment
You are a group of advisors working in the Department of Trade and Foreign Affairs in Australia. As advisors you are required to write a report covering the following topics, based on the past 5 years, in which you compare two countries. Each group must choose two countries (not including Australia). This report should provide useful information for the Department of Trade and Foreign Affairs for appropriate strategic decision making for Australia and multinational enterprises in the country. The report should use a variety of
resources, including the textbook, newspapers, industry reports, the ABS website, and other sources.
Solutions
International trade is the economic transaction made between different countries. Items that are common in trading are clothing items, electronics items, capital goods, raw materials, food items, etc. another type of transaction involves services, like travel service, payment for patents in foreign relationships. International trade is facilitated by foreign trading payments, where central banks and private banking sectors play vital roles. There is a rapid growth in the international trading goods and in the last few decades trading is known as the most important driver of globalization.
Each characteristic of international trading of foreign countries is different and this is the key element to maintain international enterprise relationships across the globe. The statistics show different movements of goods between different countries provide exceptional characteristics of enterprise behind the flow of trading. This paper contains different characteristics of trading and iteration trade policies to understand how all the countries are interconnected with each other through the economical overview. This paper will cover comparative advantage, terms of trade, export subsidies, the pattern of trade of different countries, and how they affect the trading of Australia.
Comparative Advantage (Canada and UK)
Comparative Advantage theory was developed in the year 1817 by economist David Ricardo to explain international trade in more than two economies. David Ricardo emphasized that resource distribution and other factors can create an advantage for a nation or might create a disadvantage, although despite the factor's countries could indulge in international trade (WATSON, 2017). The comparative advantage theory criticized theoretical framework identified that Adam Smith who was of the view that economies produce one product (which is in abundance) and import the other (in which resources are constraint).
Building on initial theories by Adam Smith, Ricardo explained the comparative international trade theory through concepts of relative opportunity costs. In real-time, theories have relevance as countries have established different trade agreements which helps to maintain opportunity costs for producing goods or services(Conversable Economist: Ricardo's Comparative Advantage After Two Centuries, 2017). In addition, many countries have established trade agreements for importing and exporting different ingredients or intermediary products which reduces the cost of production.
The comparison will be made amongst UK and Canada on the aerospace industry, which is one of the largest industries in the world. Both the countries have comparative advantages owing to history, technological development, population skill, and others.
Identification of Industries That Have a Comparative Advantage
UK- Description of Aerospace Industry
The UK is considered to be the second-largest globally attributing to turnover rates of $34.8 billion which is more than 16% market share globally. Aerospace is the highest growth market even if large airlines are not produced domestically. Domestic production exports more than 97% to other countries which includes engines, helicopters, space, structures, unmanned aircraft systems like drones (ITA, 2022). The country’s aerospace industry is involved in designing, manufacturing, and repairing thus providing services to domestic and international military and defense systems. the company named UK Airbus is engaged in the assembly of wings for civil aircraft. From the year 2020, it was reported that the aerospace industry was worth $22 billion in the year 2020 while commercial and government efforts aimed at increasing its share by 10% in the global market by the year 2030 (ITA, 2022). The market growth for the aerospace industry within the UK can be attributed to four segments like Space Applications, manufacturing, operations, and auxiliary services.
Canada Aerospace Industry
It ranks in the fifth position for exports for aerospace products and services of the US. In 2019, Canada's export market for aerospace was worth US$9. 1 billion, thus, it was identified that more than 60 % of production within Canada aerospace was exported. Manufacturing and Repair Organizations (MRO) has reported growth of more than 26% in the last few decades while 20 % of manufacturing units are located in Quebec and 30% within 30% while the majority of MRO that is 41% are done within Western Canada (Government of Canada, 2021). The leading subsectors for the aerospace industry in Canada include parts, systems, and sub-systems of aircraft, engine and other components of aircraft, maintenance, repair, and overhaul parts of aircraft, and space commerce.
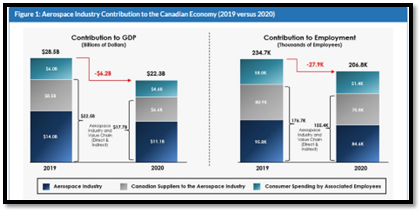
(Source: Government of Canada, 2021)
There is a profound difference like production and manufacturing of the aerospace industry which owes to differences in factor availability, trade agreement, transportation, and other comparative advantage elements.
Sources of Comparative Advantage
One of the comparative advantagesfor Canada is that former and US have integrated supply chains due to which the former earns high export earnings. Since the majority of exports are directed to the US, MRO sectors have witnessed high growth in the last few decades. In addition, agreements between US and Canada(US- Canada Bilateral Aviation Safety Agreement (BASA)) have made it easier for conducting business. Canada is also a signatory under Civil Aircraft Agreement (WTO) which ensures fair play amongst the nations. The mature market of the Canadian aerospace industry owes to its establishment from the year 1945- 1980 which was initially established for meeting the growing needs of the national military for which Avro Canada was created with efficient engine design for defense (ITA, 2020).
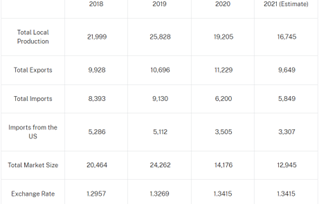
1:Total production
(Source: ITA, 2020).
On the contrary, the UK aerospace industry is different from that of Canada. It not only repairs and manufacturers defence aircraft but also designs commercial units. Thus, the technological development within the UK supports the designing and production of engines, wings, helicopters, aircraft systems, and others. Its excellence in engineering has made it a leader in nano and small satellites which are coupled with soaring investments in space technologies (International Aviation, 2019).
Considering both the countries, it can be said that the geographical location of Canada and the UK has provided comparative advantages. For instance, the US is closer to Canada while pre- Brexit period free entry in the UK from the EU helped the nations for conducting the business. In addition, technologies are more advanced in the UK than in Canada, hence the comparative advantage for the UK is higher.
Economies of Scale
In addition, the sources of comparative advantage could be explained with theories of economies of scale. In the works of Moon (2018), two types of economies of scale were explained which included external and internal. In this view, internal economies of scale refer to the reduction of costs per output relying on firm size while external economies are dependent on industry of size.
External Economies of Scale
The aerospace industry in both UK and Canada owes external economies of scale due to growth in passenger air flights owing to increasing demand and changing regulations. From the past few decades, the airline industry has witnessed high growth owing to changes in flier destinations, deregulations, uniform standards, and agreement networks amongst the nations (PHAM et al., 2021). US witness’s high passenger growth in domestic and international travel which impacts trade in the aerospace industry of Canada as it is under a bilateral trade agreement with the United States. Another factor of external economies of the scale includes an increase in military demands for which Canada provides the majority of aerospace products (ITA, 2020). Similarly, in European nations air travel has increased from past decades during a surging number of immigrants, visitors, and laborers traveling for personal and professional motives. After the United States, Europe is considered to be the largest air travel market for Asin countries.
Internal Economies of Scale
Both Canada and UK encompass the internal economies of scale, although the sectors are different. For instance, economies of scale in the commercial aerospace industry are low which positions the country in comparative disadvantage condition.Similarly for the UK, internal economies of scale are comparatively less in civil and military aerospace products which results in comparative disadvantage. In the UK, 3000 firms in the aerospace industry operate owing to small-medium size intermediaries in European regions. Before Brexit, the UK was in an advantageous position in the context of economies of scale as intermediary products could be easily procured from the European nation as goods and services were allowed a free pass across the borders (ITA, 2022). This is further supported by government initiatives like Aerospace Growth Partnership that has encouraged firms for cooperating their operations to detect issues and problems which boost UK exports. Space-related progress has been improving due to which UK commercial space industry was worth $22. 8 billion in the year 2020.
Technological enhancements and connectivity within the UK are higher than that of Canada which provides a higher comparative advantage for the former. On the contrary, the internal economies of scale can be only owed to effective collaboration of governments and industry which can provide a growth worth $7 billion, that will create more than 55, 000 jobs. The existing aerospace industry is largely impacted by pandemics, thus impetus from internal and external factors would increase its comparative advantage in civil aerospace products.
Improving Comparative Advantage
Concept of International Factor Mobility for improving trade
In addition to this, international factor movements are also important for improving labor mobility. International factor movement includes labor migration, transferring financial assets, and transactions amongst multinational corporations involving direct owners (Podrecca&Rossini, 2015). Labour is considered one of most factors on which output is dependent. Competitive markets like Canada and UK are capable of paying salaries of which purchasing power is equivalent to marginal productivity. Canada and UK both require a skilled workforce, although the population is density in such countries is less than compared to Asian economies. Also, countries experience high immigrants from varied economies of which India, China, Japan are common.
In the Asian economies, labor is cheaply available as the resources for education, job, and skill advancement, hence, many talented and skilled labor force work for more hours with less pay. In this view, labor productivity is highly dependent on the work amount and number of workforces working within the aerospace industry (Chaudhuri& Gupta, 2014). The marginal labor productivity of any individual workforce is equivalent output value produced (Hiscox, 2020). In the domestic country, if labor is abundant within the domestic country and other foreign countries have other resources, then the incentive for moving to that economy is higher (Navaretti&Venables, 2020).Also, the MPL that is the marginal productivity of labor forces is relatively less, due to which they would earn comparatively less owing to the technology and related factors of production. There is always an impetus for moving to labor deficit countries, this would only decline only with the differences in purchasing powers (Pi&Zhou, 2015). The figure given below states the differences in home and foreign employment, depicting the change inlabor productivity.
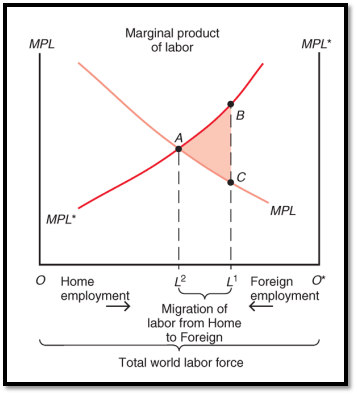
2: Marginal Productivity of Labour
(Source: Week 8 lecture notes)
The figure states that foreign output has increased from OL1 to OL2, while the domestic output has reduced within the MPL curve (OL2 to OL1 ). The theory suggests that an increase in world output can be maximized only if marginal labor productivity holds an equivalent position in all countries (that is home and a foreign country). Additionally, during post Brexit period, labor movement across EU borders was free, which enabled many manufacturers for hiring temporary or long-term employees at relatively lower costs. The marginal product labor productivity has provided evidence for governments of both countries are required to create trade agreements and collaboration with governments for supporting labor migration on work visas.
Although, post-Brexit labor laws have changed that restricts immigrants from the European region thereby putting pressure on economies of scale and comparative advantage. A similar situation is prevalent in Canada as pandemic has restricted international flying, hence immigration from varied countries is at a halt. In addition, immigration laws need to be relaxed from labor-abundant countries like Asian economies to ones with a deficit for improving trading relations and comparative advantage (Chaney, 2014). To this, Hecksher- Ohlin Model predicted trading in goods could provide the best alternatives for ensuring factor mobilities. It is considered that services as a factor of production are embedded with goods which ultimately reflects good value or productivity (Di Giovanni&Levchenko, 2012). This cannot hold with equalization with labor mobility due to varied assumptions made by Hecksher- Ohlin model.
• It assumes the same products are produced by the countries. In this case, both countries are operating in different segments of the aerospace industry. Europe is an indirect trading partner of Canada as (trading activities are generally connected with the United States).
• The model also assumes that trading economies are operating on the same technologies. In this view, the state of technologies of Canada and the UK varies.
• The model has assumed that barriers to immigration and transportation exist.
In both countries, bilateral trade agreements will help to improve comparative advantages. Canada conducts the majority of its business with the US owing to its trade agreements under WTO, thus, such agreement with other foreign nations for improving trading-related activities which positively influences the GDP rates (Baker, 2021). In addition, Brexit will severally impact trading relations of the UK with EU nations, hence, mutual- beneficial bilateral trade agreements with the EU need to be settled for reducing comparative disadvantage. It is to be remembered that the UK had been in a comparative advantage position when entry and to exist across the borders prevailed accompanied by low or no taxes on imports and exports of aerospace products. Although, Brexit was settled with no deal due to which has exposed its comparative disadvantage position.
The Flow of Trade and Investment
The flow of trade and investment can be related to demand and supply factors. It is assumed that the import demand curve refers to the difference in quantity demanded from home suppliers and producers. As the price for the product would increase, the demand for the same would decline. Considering the Brexitconditions in the UK, the price of aerospace products can be expected to rise due to changing political conditions, which might impact the demand (investment) for the product. On the contrary, the export supply curve would be differences in quantity demanded by suppliers and producers in the foreign market. Both the countries that are Canada and UK are export-oriented aerospace sectors, thereby any changes in prices would directly earn from abroad. Unlike, the import demand curve increase in price would result in a rise in export supplies. Thus, the flow of trade and investment is positive for both nations who are the epicentre of manufacture and design in the aerospace industry (Mansfield&Milner, 2012). Since both Canada and UK are engaged in the manufacturing and designing of defence sectors, thus it receives government aid. In the UK, trade, and investment are also received through foreign spaces due to its engagement in commercial repairs and manufacturing of aircraft.
Also, the investments in the UK are higher due to its advanced technologies which have resulted in the development of satellites, drones, and other advanced aero craft products.
Benefits to Australia
The gravity model depicts that economic size has a direct relation with import and export volumes. Thereby larger economies are engaged in the production and service in huge quantities, which improves its opportunity for selling in the market (Yabuuchi, 2015). Considering this theory trade with Canada and UK will have beneficial impacts owing to the size and nature of trading activities. This further strengthened from the free trade agreement with Canada in 2018 which provides Australia with huge trading opportunities. Also, Australia is a prominent member of the EU, hence trade relations and profound investment in the aerospace industry of the UK would enable the nation in procuring advanced aircraft and related products (International Aviation, 2019). Also, the UK is the nearest manufacturing unit through which transportation costs of aerospace products could be reduced. Some benefits for the flow of trade and investments are provided below.
• It reduces tariff barriers and leads to trade creation
• It increases export and imports and maintains a durable international relation
• It is effective to maintain the scale of positive economies
• It increases international competition
In addition, investments of £90 million in the aerospace industry by the UK would profoundly benefit Australia owing to the focus on lightweight parts that would help both nations reduce the use of fuel within the aircraft.
The aerospace industry of Canada is embarked on promising factors that could benefit Australia in the long run which are mentioned below.
• Aerospace is the main manufacturing unit employing 50, 000 workforce with additional laborers who have working maintenance and services.
• The aerospace industry of Canada enjoys a trade surplus that owes technology and machinery use coupled with high labor productivity.
• Innovation is high as 20 % of GDP is invested in research and development.
Conclusion
The aerospace industries have supported the world in witnessing growth and development. Both the UK and Canada have attributed to growth and development which owes to factors like collaboration, investment, rich culture, and history. Different factors of comparative advantages have been explained with economic theories like economies of scale, factor mobility, and gravity model. The benefits of trade relations of Canada and the UK are high for Australia owing to development, innovation, and investments encountered by the nations. Both UK and Canada are recommended for forming trade policies with labour-abundant countries to reap benefits of high productivity which will also improve economies of scale.Trade relations amongst Canada andUK are still in establishing stage as UK is no longer part of EU, hence countries are recommended to reconsider international factor mobility for creating trade relationships. In addition, both the countries are operating on different sector that is commercial and civil, hence trading can be conducted on the basis of comparative advantage theories. Since, Canada has efficient trade relation relations with EU, it should consider developing relations with UK for mobility like technology, skilled labour force, innovation to expand its aerospace industry. Both the parties will benefit from trade, owing to the prevalence of comparative disadvantage.
Reference List
Baker, N., 2021. Canadian Aerospace Industry. [online] Available at: <https://www.thecanadianencyclopedia.ca/en/article/aerospace-industry> [Accessed 11 Jan 2022].
Chaney, T., 2014. The network structure of international trade. American Economic Review, 104(11), pp.3600-3634.https://mpra.ub.uni-muenchen.de/32682/1/MPRA_paper_32682.pdf
Chaudhuri, S. and Gupta, M.R., 2014. International factor mobility, informal interest rate, and capital market imperfection: a general equilibrium analysis. Economic Modelling, 37, pp.184-192.
Conversable Economist: Ricardo's Comparative Advantage After Two Centuries. 2017. Chatham: Newstex. https://www.proquest.com/docview/1977077407/8167A5CE10E549A0PQ/2?accountid=30552
Destatis, 2020. Foreign trade. [online] Available at: <https://www.destatis.de/EN/Themes/Economy/Foreign-Trade/_node.html> [Accessed 11 Jan 2022].
Di Giovanni, J. and Levchenko, A.A., 2012. Country size, international trade, and aggregate fluctuations in granular economies. Journal of Political Economy, 120(6), pp.1083-1132.
Government of Canada, 2021. State of Canada's Aerospace Industry. [online] Available at: <https://www.ic.gc.ca/eic/site/ad-ad.nsf/eng/h_ad03964.html> [Accessed 11 Jan 2022].
Hiscox, M.J., 2020. International trade and political conflict. Princeton University Press.https://www.google.co.in/books/edition/International_Trade_and_Political_Confli/XdPgDwAAQBAJ?hl=en&gbpv=1&dq=international+Trade+and+Political+Conflict&printsec=frontcover
International Aviation, 2019. Why were there so many aircraft manufacturers in the UK in the 1950s? [online] Available at: <https://internationalaviationhq.com/2019/09/07/aircraft-manufacturers-in-the-uk/> [Accessed 11 Jan 2022].
ITA, 2020. Canada - Country Commercial Guide. [online] Available at: <https://www.trade.gov/country-commercial-guides/canada-aerospace-and-defense> [Accessed 11 Jan 2022].
ITA, 2022. United Kingdom - Country Commercial Guide. [online] Available at: <https://www.trade.gov/country-commercial-guides/united-kingdom-aerospace-and-defense> [Accessed 11 Jan 2022].
Mansfield, E.D., and Milner, H.V., 2012. Votes, vetoes, and the political economy of international trade agreements. Princeton University Press.https://www.google.co.in/books/edition/Votes_Vetoes_and_the_Political_Economy_o/FnZh_iCZDs0C?hl=en&gbpv=1&dq=Mansfield,+E.D.,+and+Milner,+H.V.,+2012.+Votes,+vetoes,+and+the+political+economy+of+international+trade+agreements.+Princeton+University+Press.&printsec=frontcover
Moon, B.E., 2018. Dilemmas of international trade. Routledge.https://www.google.co.in/books/edition/Dilemmas_Of_International_Trade/WVJPDwAAQBAJ?hl=en&gbpv=1&dq=Moon,+B.E.,+2018.+Dilemmas+of+international+trade.+Routledge.&pg=PT12&printsec=frontcover
Navaretti, G.B. and Venables, A.J., 2020. Multinational firms in the world economy. Princeton University Press.https://www.google.co.in/books/edition/Multinational_Firms_in_the_World_Economy/q27dDwAAQBAJ?hl=en&gbpv=1&dq=.+Multinational+firms+in+the+world+economy.&printsec=frontcover
Pham, V., Woodland, A. and Caselli, M., 2021. Exceptional performance of multinational suppliers: theory and evidence. Review of World Economics, 157(2), pp. 221-269.https://doi.org/10.1007/s10290-020-00399-7
Pi, J. and Zhou, Y., 2015. International factor mobility, production cost components, and wage inequality. The BE Journal of Economic Analysis & Policy, 15(2), pp.503-522.https://doi.org/10.1515/bejeap-2014-0006
PODRECCA, E. and ROSSINI, G., 2015. International Factor Mobility, Wages and Prices. Review of Development Economics, 19(3), pp. 683-694. https://www.proquest.com/docview/1696144708/1BBAB2C138824558PQ/1?accountid=30552
Watson, M., 2017. Historicising Ricardo's comparative advantage theory, challenging the normative foundations of liberal International Political Economy. New Political Economy, 22(3), pp. 257-272. https://www.proquest.com/docview/1883144812/8167A5CE10E549A0PQ/1?accountid=30552
Yabuuchi, S., 2015. Globalization, International Factor Mobility, and Wage Inequality. Journal of Economic Integration, 30(3), pp. 577-590.https://www.proquest.com/docview/1898683750/1BBAB2C138824558PQ/2?accountid=30552
Research
ECON6000 Economics Assessment Sample
Question
JobKeeper payments have been extended until 28th March 2021. This purpose of this grant is to ensure that all the businesses and non-profit organisations significantly affected by COVID-19 remain adequately supported. This said, not all the Australian residents are eligible. Eligibility criteria says that you have to be either an Australian citizen or a permanent resident or hold a Protected Special Visa.
You are a Business Economics Analyst working in ABC Company. The senior management of this organisation wants you to prepare a report to help the management understand how this JobKeeper payment can affect their employees. Your reasoning should indicate whether JobKeeper grant would help improve income elasticity of demand. Finally, as the company employs many temporary visa holders and student visa holders on a part-time and full-time basis, the senior management also want your recommendation surrounding the grant of JobKeeper payment to all categories of employment irrespective of their visa status.
Your report should cover the following:
1) What is your understanding of JobKeeper payment and the eligibility criteria for JobKeeper grant? Should JobKeeper be given to those working full-time or part-time irrespective of their visa status? If so, will this affect overall market demand or not? Do JobKeeper grants have an impact on individual demand, supply and price? If so, are there likely to be significant changes or will the impact be minimal? Provide examples to support your answer. Use appropriate supply and demand diagrams to explain your views. Do not cut and paste diagrams from external sources. Ensure that your diagrams are professional.
2) What is the impact of JobKeeper on income elasticity and price elasticity? Is demand elastic or inelastic? Provide examples to support your answer. Will people use the substitution effect to manage affordability or will there be no impact on buying capacity? Provide reasons to support your answer. Use diagrams to explain your
views. As in the previous case, please do not cut and paste diagrams from different sources.
Answer
Executive Summary
The Covid-19 pandemic affected the business and life of every individual. Based on this scenario, the Australian Government focused on the JobKeeper Payment scheme with reference to the demand and supply scenario into consideration. This report is based on giving guidance to ABC Company with regard to the means by which the respective senior management can distribute its grant of JobKeeping payment and continue its operations within the Australian market at large.
Introduction
The JobKeeper program designed by the Australian Government mainly entails businesses claim a fortnightly payment of a total of around $1,500 per eligible employee. This is mainly an attempt on part of the Government concerned to enable the residents to cope up effectively with such an economic crisis as a result of the outbreak of Covid-19 pandemic in no time thereby attempting to keep the productivity level intact. This particular report work focuses on giving guidance to ABC Company with regard to the means by which the respective senior management can distribute its grant of JobKeeping payment.
Question 1
Relate a brief understanding about JobKeeper payment and specify eligibility criteria for it. Coronavirus pandemic affected the business organisation where the motivation to be stable in the business jobs has become tough in Australia. Focusing on this context, the Australian Taxation Office (ATO) is focusing to develop a JobKeeper Payment Scheme that can focus primarily on providing a subsidy for the business organisations. The prime purpose behind such a grant is to ensure that all businesses and non-profit organisations that are significantly affected by Covid-19 manage to remain adequately supported as well as help the concerned workers that are attached with such organisations during such crisis periods (Petrov & Petrova, 2020, p.7644).
In addition to this, the behavioural responses are a major factor for the creation of incentives for the firms to force down the turnover rate that can provide access to the payments.It is mainly the residents of Australia who are eligible for JobKeeper payments. For enjoying the associated benefits of this particular scheme, besides the need of the person concerned to be a certified citizen of Australia, the other applicable options include the fact that the person concerned either should be a permanent resident or needs to have a Protected Special Visa.
Discuss effectiveness of JobKeeper payment on overall market demand and to whom it must concern
From the point of view of a Business Economics Analyst, it can be stated that the provision of JobKeeper payments to part-time or full-time employees irrespective of their visa status is deemed to be a necessary one. This is because such a scheme has eventually been initiated by the Australian Government to ensure that almost all organisations operating within the very economy are adequately supported. Now, employees, irrespective of their country of origin are undoubtedly considered to be building blocks of any organisation. For instance, the ABC Company can be seen to be run by several temporary as well as student visa holders on a full-time and part-time basis.
The sudden outbreak of Covid-19 has adversely affected almost every such individual. Thereby, in order to keep workings of the Australian economy in order through production of adequate amounts of goods or services within the geographic boundary of Australia, initiation of JobKeeper payment upon employees irrespective of their visa status is likely to prove effective with regard to maintaining the level of productivity throughout (Bekkers& Koopman, 2020, p.97).
Analysis of associated impact on market demand
The associated impact on overall market demand level is illustrated with the help of a diagram as follows:
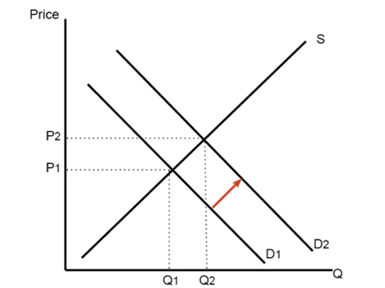
Figure 1: Impact on Overall Market Demand
(Source: Created by Learner)
With reference to the above figure, it can be seen that a provision of JobKeeper payment is most likely to indicate an increase in quantity demanded from Q1 to Q2 thereby shifting the demand curve rightwards from D1 to D2. Such an increase in quantity demanded bears high probability to impose a relatively high pressure upon the suppliers concerned owing to emergence of supply constraints backed by imposition of rules or regulations to avoid further spread of Covid-19 pandemic in this regard. This automatically seemed to have contributed to rise in corresponding market price of the products concerned from P1 to P2 guided by the sole motive of maintaining an equilibrium position within the existing market scenario. Besides this, such increment in price level accompanied by arousal greater demand from individuals getting insured by JobKeeper grants might also have been a result of costlier production process as a result of need for maintenance of certain safety norms while manufacturing the products.
With examples, analyse impact of JobKeeper grants on individual supply, demand, and price
Demand and supply rate is dependent on the ratio of business and production, where elasticity in the Australian economy rolled up to a new extent. In this portion, the sudden outbreak of the Covid-19 pandemic affected the Australian economy with the result in the unemployment generation that led to the prevalence of a situation where excess supply condition grew in the initial terms driving the decrease in the supply ratio (Hodder, 2020, p.268).
Due to this fact that employees in Australia are losing their jobs, it led to the generation of acute contraction where the economic scenario can get a chance of loss in the supply ratio and demand graph. Moreover, the introductions of JobKeeper payments are based on boosting the demand level of the individuals to some extent. In addition to this, the gradient increment undoubtedly shows an impact on the supply level of the products where the dependency on the sales in the market is broadly based on the services in the market and demand. To understand the extent of the impact of the change in demand from the supply level, it is important to focus on the following explanation:
Impact on individual demand, supply, and Price:
The JobKeeper grant is likely to enhance the level of purchasing power available in hands of the individuals at large. Such increment bears a high probability to show the corresponding impact upon goods of varied types. However, the associated impact upon supply level is unlikely to be high owing to the prevalence of supply constraints thereby contributing to enhancement of associated price level in order to maintain an equilibrium position.
Some of the scenarios are illustrated as follows:
Normal Goods: These goods are referred to as the kind of goods that experience an increment in their demand level due to the hike in the income of customers. The supply of normal goods is based on the factor of income elasticity where the hike in the income leads to the increase in the demand for the goods. The supply of these goods is most likely not affected by the exposure of the JobKeeper payment option in the business organisation of Australia (Mohner&Wolik, 2020, p.641).
Necessary Goods: These goods relate to the services or products based on which the customers need to purchase irrespective of the change in the income level. These goods are not affected by the change in income and remain constant during the changing business scenario as well as income stability. Thus, the changes in the demand are constant.
Inferior Goods: These goods refer according to the demand change and hence show a slight change in the income level. Moreover, there is an inverse relationship with the income level and decreasing income level leads to the increase in the supply of these products. Thus, the automatic shift in the business and income affects the supply curve towards the left leading to the increase in the supplied link.
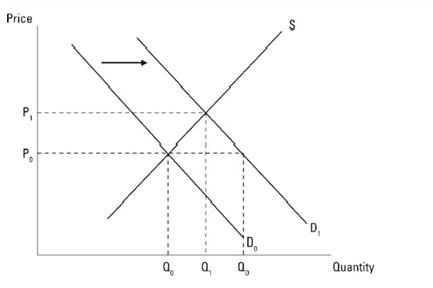
Figure 2: Impact on Individual Demand, Supply, and Price Level
(Source: Created by Learner)
From the above figure, it can be deduced that exposure to JobKeeper payment kind of initiated to individuals demands a greater number of products Q1 than before which was Q0. The supply level, to cope up with this excess amount (Q1-Q0), contributed to raising the price level from P0 to P1. For instance, it can be seen that Covid-19 was a lesson for the government of Australia where they need to focus on undertaking an initiative to boost the manufacturing sector of Australia, and in addition to this, it is estimated that $107 million is required to strengthen the supply in the required commodity.
For instance, the lump sum amount of investment is deemed to be ofgreat help onpart of businesses to prioritise the concept of both medical products and medicines thereby playing a vital role in boosting the needs of individuals. This is becausecritical supplies are based on boosting the stages of demand. Co-investment is based on the financial resources of the finished products where these concepts enable to fix the six-priority area of the government.
These include the following:
• Products that enable health such as medical products
• Critical and limited resources as well as resource technology
• Food and beverages
• Clean energy and recycling
• Space
• Defense
From the above six priorities of the critical assessment, the manufactures in Australia have risen to address the challenges that can deliver manufactured products during the Covid-19 and even in the long-term scenario. In addition to this, presently the businesses are focusing on presenting the unlocked potential of delivering the essential materials for the future. Moreover, the delivery of each material is based on playing an important role in the development of strengths as well as strategically investing in boosting the role of technology or science in the industry (Rapacciniet al., 2020, p.231). In every aspect of the supply growth, it is important to focus on the change in the quality of the products. This can be supported by referring to the fact that clear supply effects owing to incidences such as closed factories, quarantines, impaired mobility, and disruptions witnessed in the supply chain have undoubtedly affected the level of production. Irrespective of the non-availability of consumer price index information for a number of months as a result of economic lags, the breakeven inflation expectations following the hit by Covid-19 shock has enabled obtain somewhat a brief idea about the actual workings of JobKeeper grants at large.
Question 2
With examples, point out the impact of JobKeeper upon price elasticity and income elasticity
Taking the case of Covid-19 into consideration, it can be reviewed that the individual needs to focus on the assessment of buying products in normal life. However, the current scenario of the business and income is continuously changing with the impact on the income as well as on the price elasticity. The current on-going scenario of the Covid-19 crisis impacts the daily wage with the exposure to the risk scenario and loss in the work in Australia. The incorporation of the JobKeeper payment scheme is hence based on accessing the greater amount of financial resources.
Price Elasticity: It is referred to as the primary key of the economic measure that states the degree of responsiveness and the change in the quantity of the product purchased by the people and change in the demand price level.
Elastic Demand: It is a type of price elasticity where the quantity changes in the product or service are more than the change in the price level. The exposure to the Covid-19 crisis led to several issues that were balanced with the access to the JobKeeper Payment scheme that acted as a relief in controlling the economy of Australia. It is also observed that there is a decrease in the demand of an individual by households resulted instabilisation of the taxation and prices for better ranges (Rapacciniet al., 2020, p.227). For example, exposure to such an economic downturn made individuals reduce the demand level of luxury items such as branded apparel, luxurious home appliances, expensive branded watches, and cars from Ford Motor or Daimler thus making the people focus more on saving and limit the expectations.
Inelastic Demand: This particular kind of price elasticity focuses on the factors regardless of the increase or decrease in the price level of the products and service, the purchasing process remains the same irrespective of the nature of the small amounts.
The JobKeeper Scheme focuses on the exposure of all these uncertain economic scenarios leading to a minimal fall in quantity demanded. These changes are not discouraged by the customers in order to reduce the consumption of limited resources such as oil irrespective of the rise in the market price.However, irrespective of such an attempt on part of consumers to limit their expenses level, demand for medicines have shown a sharp rise irrespective of their market price level thereby indicating prevalence of the inelastic nature of demand for necessary or life-saving commodities even in such pandemic situation.
Income Elasticity: This income elasticity is related to the economic measure by giving an idea of the responsibility to exchange the goods and services based on the income level of each individual. The assessment of the JobKeeper payments plays an important role in the management of the individual part where the low-income background and other options of engaging the individuals in consumption and inferior products lead to the economic crisis at the initial phase of the lockdown. Thus, negative influence of the income elasticity focused on the economic crisis during the growth of lockdown.
With proper evidence and diagram, discuss whether people use substitution effect to manage affordability
The individuals, guided by the sole motive to afford the necessary products within the number of financial resources available in their hands, are likely to opt for the substitution effect. This is most likely to be guided by an initiative on their end to switch to alternative items that are as cheap as possible to cope up with such an economic crisis.
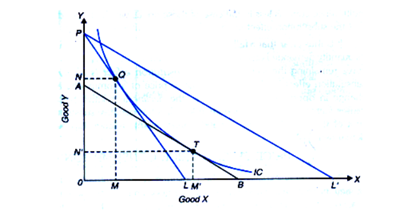
Figure 3: Substitution Effect to manage affordability
(Source: Created by Learner)
By referring to the figure above, the income effect shows an impact on quantity purchase as a result of a change in associated income level. This results in a movement to a different indifference curve (IC) backed by such change in the ability to purchase a given quantity of Good X against a new quantity of Good Y, which is a substitute of Good X. Besides this, prevalence of supply constraints in this regard has also been another major factor behind the emergence of such substitution effects as a result of partial curb down of various sectors.
Taking the Covid-19 pandemic scenario into consideration, it can be seen that such an outbreak affected the global business scenario with the influence on the global health of individuals. Based on this ratio, the manufacturing industry suffered from the changes in the lifestyle pattern and demand demographics. In addition to this, the complete scenario of the manufacturing business emerged as history and required a path to enable the business growth with the focus on availability of the stocks. In this ratio, the Australian Manufacturing sector focused on the concept of a modernised view of the workforce as the work criteria in the Chinese business manufacturing industry can be seen (Norouzi et al., 2020, p.101654).
Moreover, the initial analysis of the hit should focus on the results of Covid-19, where the Australian supply chain analysis provides a report of the major disruption of the demand structure. This can be due to the result of the limited supplies that the Australians are facing due to the huge crisis. Given this, domestic manufacturing is the major purpose for which the limited supplies and demand limitation can be an important factor. However, these results are limited to a point of supplies only. Thus, the period of crisis led due to the outbreak of Covid-19 emerged as a forced scenario with the decrease in the large percentage of manufacturing reduced. In addition to this, rapid adaptability is growing where the companies are associated to enlarge their particular industry so that they can ramp up the capability of the sector.
Based on the above analysis, the Australian Government adopted some strategies to initiate the growth of the individual industries. On this note, the Australian Government in order to refuel the economy based on taking the initiative so that it can move away from the short-term solutions that are cheap or indicate the overseas labour that focuses on the investment of the local system. Every bit of the business economic growth is based on the high profitability as well as on the solution that can particularly move the manufacturing sector on the local premises.
Conclusion
It can be concluded that the JobKeeper scheme is of great help to bring real benefits in the business organisations by involvement of the utilisation of the existing teams, brand new services or products, and many more. Moreover, it is important in the scenario of economic recession where harsh conditions can lead to destruction in casual employment.
Reference List
Petrov, A., & Petrova, D. (2020). Sustainability of transport system of large Russian city in the period of COVID-19: Methods and results of assessment. Sustainability, 12(18), 7644. https://www.mdpi.com/2071-1050/12/18/7644
Bekkers, E., & Koopman, R. B. (2020). Simulating the trade effects of the COVID?19 pandemic: Scenario analysis based on quantitative trade modelling. The World Economy.30(2), 56-178. https://onlinelibrary.wiley.com/doi/full/10.1111/twec.13063
Norouzi, N., de Rubens, G. Z., Choubanpishehzafar, S., & Enevoldsen, P. (2020). When pandemics impact economies and climate change: exploring the impacts of COVID-19 on oil and electricity demand in China. Energy Research & Social Science, 68, 101654.https://www.sciencedirect.com/science/article/pii/S2214629620302292
Hodder, A. (2020). New Technology, Work and Employment in the era of COVID?19: reflecting on legacies of research. New Technology, Work and Employment, 35(3), 262-275.https://onlinelibrary.wiley.com/doi/full/10.1111/ntwe.12173
Mohner, M., & Wolik, A. (2020). Differences in COVID-19 risk between occupational groups and employment sectors in Germany. Deutsches Ärzteblatt International, 117(38), 641.https://www.ncbi.nlm.nih.gov/pmc/articles/PMC7817783/
Rapaccini, M., Saccani, N., Kowalkowski, C., Paiola, M., & Adrodegari, F. (2020). Navigating disruptive crises through service-led growth: The impact of COVID-19 on Italian manufacturing firms. Industrial Marketing Management, 88, 225-237.https://www.sciencedirect.com/science/article/pii/S0019850120304247

- Assignment - Child Care
- Assignment - Mathematics
- Assignment - Accounting
- Assignment - Auditing
- Assignment - Biology
- Assignment - Law
- Assignment - Management
- Assignment - Nursing
- Assignment - Finance
- Assignment - Computer Science and IT
- Assignment - Humanities
- Assignment - Economics
- Assignment - Statistics
- Assignment - Architecture
- Assignment - Engineering
- Assignment - cookery
- Assignment - Marketing
- Case Study - Chemistry
- Case Study - Accounting
- Case Study - Law
- Case Study - Management
- Case Study - Nursing
- Case Study - Finance
- Case Study - Computer Science and IT
- Case Study - Engineering
- Case Study - Economics
- Case Study - Biology
- Case Study - Auditing
- Case Study - Marketing
- Case Study - Project Management
- Coursework - Diploma
- Coursework - Accounting
- Coursework - Auditing
- Coursework - Biology
- Coursework - Management
- Coursework - Nursing
- Coursework - Finance
- Coursework - Computer Science and IT
- Coursework - Engineering
- Coursework - Humanities
- Coursework - Child Care
- Coursework - Project Management
- Coursework - Economics
- Coursework - Cookery
- Coursework - Law
- Dissertation - Accounting
- Dissertation - Auditing
- Dissertation - Biology
- Dissertation - Law
- Dissertation - Management
- Dissertation - Nursing
- Dissertation - Finance
- Dissertation - Computer Science and IT
- Dissertation - Humanities
- Dissertation - Economics
- Essay - Politics
- Essay - Childcare
- Essay - Accounting
- Essay - Biology
- Essay - Law
- Essay - Management
- Essay - Nursing
- Essay - Computer Science and IT
- Essay - Humanities
- Essay - Economics
- Essay - Auditing
- Essay - Engineering
- Essay - Architecture
- Essay - Finance
- Essay - Science
- Essay - Marketing
- Programming - Computer Science and IT
- Reports - Management
- Reports - Computer Science and IT
- Reports - Project Management
- Reports - Marketing
- Reports - Nursing
- Reports - Engineering
- Reports - Accounting
- Reports - Humanities
- Reports - Finance
- Reports - Architecture
- Reports - Biology
- Reports - Economics
- Reports - Childcare
- Reports - Law
- Research - Accounting
- Research - Auditing
- Research - Biology
- Research - Law
- Research - Management
- Research - Nursing
- Research - Finance
- Research - Computer Science and IT
- Research - Science
- Research - Engineering
- Research - Humanities
- Research - Economics
- Research - Project Management
- Research - Statistics
- Research - Architecture
- Research - Marketing
- Thesis Writing - Computer Science and IT
- Thesis Writing - Engineering
- Thesis Writing - Biology
- Thesis Writing - Finance
- Thesis Writing - Humanities
- Thesis Writing - Auditing
- Thesis Writing - Economics
- Thesis Writing - Law
- Thesis Writing - Nursing
- Thesis Writing - Accounting
- Thesis Writing - Architecture


.png)
~5.png)
.png)
~1.png)


.png)


