Data science and Analytics Assignment Sample
Project Title - Investigating multiple imputations to handle missing data
Background: Multiple imputations are a commonly used approach to deal with missing values. In this approach an imputer repeatedly imputes the missing values by taking draws from the posterior predictive distribution for the missing values conditional on the observed values, and releases these completed data sets to analysts. With each completed data set the analyst performs the analysis of interest, treating the data as if it were fully observed. These analyses are then combined with standard combining rules, allowing the analyst to make appropriate inferences that incorporate the uncertainty present due to the missing data. In order to preserve the statistical properties present in the data, the imputer must use a plausible distribution to generate the imputed values. This can be challenging in many applications.
Objectives: The project will implement this approach and investigate its performance. Depending upon the student’s interest the project could include some of the following objectives:
1. Comparing multiple imputations with other approaches to deal with missing data in the literature.
2. Exploring the effect of Not Missing at Random data on inferences obtained from Multiple Imputation.
3. Explore the effect of a Missing at Random mechanism that is non-ignorable when using Multiple Imputation.
Approach: The project will illustrate performance of the methods being investigated through simulations to begin with. The methods could also potentially be applied to a data set measuring the survival times of patients after undergoing a kidney transplant or a relevant data set available from an online public repository.
Deliverables:
The main deliverable will be providing recommendations from the investigation of the area well as any indicating any limitations identified with the approach being considered. This will be evidenced with illustrations given through simulations as well as potentially using a real data example as well.
Key computing skills:
Knowledge of R or an equivalent programming language such as Python would be required. Knowledge of statistical computational techniques such as Monte Carlo Methods would be desirable.
Other key student competencies for assignments help
Knowledge of fundamental concepts of Statistical Inference and Modelling. An appreciation of Bayesian inference and methods would also be desirable.
Data availability:
Any data set we consider will be available to download from an online public repository such as the UK Data Service or made available to student via the Supervisor.
Any other comments:
Little RJA and Rubin DB (2002), Statistical Analysis with Missing data, Second Edition.
Instruction
1. Size limit of 10,000 words (excluding preamble, references, and appendices). Anything beyond this will not be read. In general, clear and concise writing will be rewarded.
2. Must include an Executive Summary (max 3 pages), which should be understandable by a non-specialist, explaining the problem(s) investigated, what you did and what you found, and what conclusions were drawn.
Written thesis
1. Times New Roman font size 12, with justification, should be used with 1.5 line spacing throughout. Pages should be numbered. Section headings and sub-headings should be numbered, and may be of a larger font size.
2. For references the Harvard scheme is preferred, e.g. Smith and Jones (2017)
3. Any appendices must be numbered
Solution
INVESTIGATING MULTIPLE IMPUTATIONS TO HANDLE MISSING DATA
Chapter 1: Introduction
1.1 Introduction
Multiple Imputation (MI) is referred to as a process that helps to complete missing research data. It is an effective way to deal with nonresponse bias and it can be taken into action when people fail to respond to a survey. Tools like ANOVA or T-Test make it easier for analysts to perform Multiple Imputations and retrieve missing data. It is also beneficial for extracting all sorts of data and leads to experimental design (Brady et al. 2015, p.2). However, the process of using single values raises questions regarding uncertainty about the values that need to be imputed; Multiple Imputation helps by narrowing the uncertainties about the missing values by calculating various different options. In this process, various versions of the same data set are created and combined in order to make the best values.
1.2 Background of the study
A multiple Imputation is a common approach made towards the missing data problem. The data analysis can only be possible if accurate information is procured (Alruhaymi and Kim, 2021, p.478). This process is commonly used in order to create some of the different imputed datasets that aim to properly combine results gained from each of the datasets. There are different stages involved in the process of Multiple Imputing in order to retrieve and fill in missing data. The primary stage is to create more than one copy of a particular dataset. Apart from that, there are different methods and stages that are involved in the actual process that determines the way of calculating missing data in a particular place by replacing the missing values with imputed values.
Gönülal, (2019, p.2) in his research paper “Missing Data Management Practices” pointed out that Multiple Imputation has the potential of improving the whole validity of research work. It requires a model of the distribution of each and every variable with their respective missing values from the user, in terms of the observed data. Gönülal has also said that Multiple Imputation might not be used as a complementary technique every time. It can be applied by specialists in order to obtain possible statistics.
1.3 background of the research
Managing and dealing with missing data is one of the biggest concerns that a company needs to manage whenever the overall management of the workforce is being managed by the company and its employees. Though the effectiveness of implementing an appropriate business and workplace model in practices missing data or data thief can lower its efficiency and effect6ivenes all over the workplaces. This also develops lots of difficulties regards with the elimination of personal biases where it becomes really difficult for the managers of business firms in acquiring an adequate research result. ITS or an interrupted time series are vastly utilized by hierarchies in business firms where they are capable of evaluating the potential effect of investigation over time due to utilization of real and long-term data. Both learnings on statistical analysis and missing data management can be beneficial for this type of sector where there is a balance among both population levels adapt and individual levels data (Bazo-Alvarez et al. 2021,m p.603). The non-responsive and unprocessed data mainly gets missed whenever the company deals with an activity it has been dealing with for a long time. Saving data in a systematic way requires a proper understanding of the ways data is being selectively simplified by effective deals. Gathering data, data analysis, and storing requires a proper understanding of the ways data can be managed in an organization.
As per the study of Izoninet al. (2021, p. 749), it can be said that managing and controlling missing data is amongst the most popular trends in this market. These are also considered smart systems which are utilized by large business firms which can help them in managing their assets, resources, and personal and professional business data. By mitigating missing data processes a huge number of business firms can be benefitted due to their ability in managing assets and conclude their tasks within the scheduled team. Different tools that are being used in research help to identify the missing data which has a great impact on the topic. Multiple imputations are one of the most crucial processes that help to gather or recover the data that are being used for a long time. Missing data needs to be recovering in selective time otherwise the data and its sources get lost in the wild cloud system (Haensch, 2021, p.111).
Developing a process by using different tools like ANOVA or t-test help to analyze the ways missing data got lost and also help to retrieve the missing data by maintaining a format is a process (Garciarena and Santana, 2017, p.65). Non-trivial methods to procure missing values are often adopted for using sophisticated algorithms. Known values are used to retrieve missing values from the database. This particular discussion on understanding the way huge data in cloud storage systems got lost and the ways this particular data that is highly needed for any company are retried are mentioned and elaborated in this study. Different data needs to be managed by the proper Data collection format and data storing systems. The proposed format of the research comprises different parts that have active involvement while providing a critical understanding of the missing data and data protection activities. The selected structure is being mentioned in the overall discussion that is maintained by the researcher while developing the research. In some cases, the data involves the process of critical information saving which got lost sometimes and for that using multiple inputting services the retrieve data and filling of lost data by using some other ones are also used and important ones. Also, this research provides a briefing about the "Missing Data Management Practice" which has an effective impact on the organizational function related to data safety and data security (Garciarena and Santana, 2017, p.65). Data security and data security-related other functions need a proper understanding of the ways the overall function of missing data-keeping targets are managed by the general approach of multiple imputations to serve the commonly used statistical understanding of the data. The uncertainty of the data and its combining results that are obtained from the critical understanding that helps to evaluate the representativeness of bias data packages are related to the values of the missing data. Missing information, different cases, statistical packages, and other things provide the knowledge which is related to the overall activity that is given importance by the organization and its other functions (Krause et al. 2020, p.112).
1.4 Problem statement
Missing data creates severe problems that eventually create a backlog for the organization or institute. The main problem of missing data and handling the exact ways of recovering those missing data presents the critical scenario of data management. The absence of data develops critical situations while dealing with research for a project because even the null hypothesis gets rejected while developing a test that has no such statistical power because of the missing data. The estimated parameters of the research outcome can cause biased outcomes because the data that are missing and also the misleading data from different sectors lower the task force as well. Also, the representative approach of the data samples got ruined by the missing one.
1.5 Rationale
The preliminary issue raised in this research is the implementation of Multiple Imputations in order to handle missing data.
This is an issue because it is an effective and helpful technique that helps in filling in missing data. Most of the time, important surveys are left incomplete because of less response from the people. Multiple Imputation helps in completing the surveys by gathering all the needed data after performing analysis of the whole data set (Grund et al. 2018, p.113).
It is an issue now because nowadays people are becoming ignorant about questionnaires and online surveys which is impacting the ultimate result of the survey. This method can help the completion of the surveys by filling in the missing data after replacing the missing data with imputed data.
This research can help in finding the best tools for performing Multiple Imputation methods to handle missing data.
1.6 Aim of the research
Aim
The primary aim of the research is to investigate Multiple Imputations in order to handle missing data.
1.7 Objectives of the research
Objectives
The main objectives of this research are:
? To investigate the factors that contribute to the process of Multiple Imputation that helps in handling missing data.
? To measure the capabilities of Multiple Imputations in handling missing data.
? To identify the challenges faced by the analysts while performing different Multiple Imputation techniques to fill in missing data.
? To identify the recommended strategy for mitigating the challenges faced while performing different Multiple Imputation techniques to fill in missing data.
1.8 Questions of the research
Question 1: what are the exact ways that help to contribute to the process of multiple imputations in order to handle the missing data in a systematic way?
Question 2: What are the exact ways that help to measure the capabilities of multiple imputations while handling different missing data?
Question 3: What exact challenges do the analysts face while mitigating data gaps by using multiple imputations techniques of filling the missing data?
Question 4: what are the exact recommended strategies that are provided for mitigating the challenges faced while performing different multiple imputation techniques to fill in missing data?
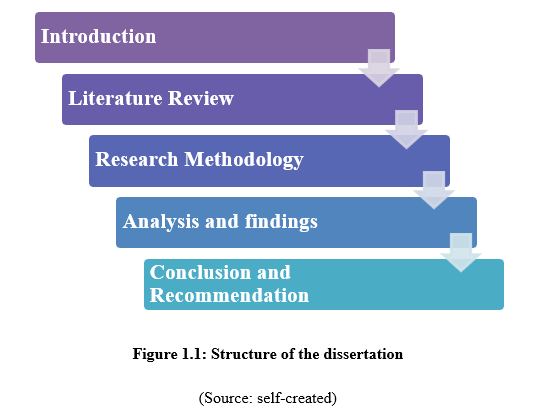
1.9 Proposed structure of the dissertation
1.10 Summary
This discussion comprises the overall concept of using multiple imputation techniques for retrieving missing data and restructuring is critically analyzed and mentioned for better understanding. The ways different data that have got lost somehow and still exist in the cloud bases of the data folder can be retrieved is the basic function of multiple imputations which is also mentioned in the discussion. The overall concept of the multiple imputations helps to reduce the place of losing data and keeping that data intact with the exact process for an organization are elaborately described in this study. In the above-discussed section, the complex multiple imputations which are used as a secondary tool for data analysis purposes are mentioned with integrity and transparency.
Chapter 2 Literature Review
2.1 Introduction
Multiple imputation is a process of managing data that are missing. The management of data can reduce the risks of losing a project for an organization or an institute. Through the differences in the data sets, the operational process of multiple imputations became complicated. Through this chapter, the researcher is going to describe the concept of multiple imputation processes in tackling missing data. A secondary tool of data analysis helps the researcher to gather all the information on the above-mentioned research topic. There is no scope of denying the fact that this chapter is one of the crucial parts of research as it works with the information of previous researchers on the same research topic. Through the analysis of the data of past researches, the possibility to complete research became possible.
A literature review helps the researcher to analyze the research topic from several sides. The characteristics of multiple imputation processes are going to be described in this chapter of the research. The areas that the process of multiple imputations covers have been described in this chapter. This chapter also consists of the negative as well as the positive impact of multiple imputation processes in managing missing data. This is one of the important chapters of research that provides information about the overall concept of the research.
2.2 Conceptual Framework

2.3 Concept of Multiple Imputation in handling missing data
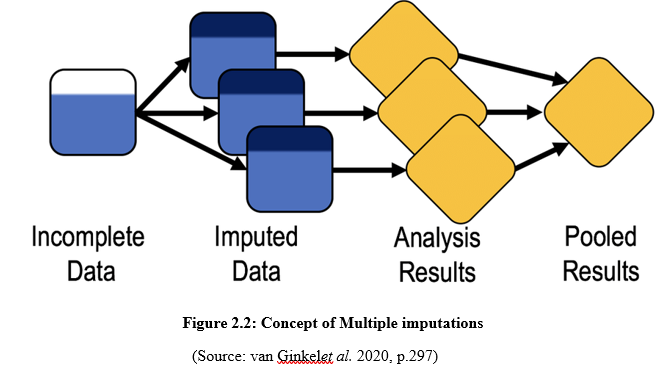
Handling missing data is a quintessential aspect of analyzing bulk data and extracting results from it. It is a complex and difficult task to pull off for the professionals in this field. While optimizing the missing data and trying to retrieve it, professionals need to use effective strategies and technologies that can help them retrieve the lost or missing data and complete the overall report. Multiple Imputation is considered to be a straightforward procedure for handling and retrieving missing data. The common feature of Multiple Imputation was to prepare and convince these types of approaches in separate stages(Bazo-Alvarez et al. 2017, p.157). The first stage involves a data disseminator which calculatingly creates small numbers of the present dataset by filling in the lost or missing values with the collected samples from the imputation model. In the second stage data, analysts perform the computation process of their dataset by estimating it and combining it using simple methods in order to get pooled estimation of the dataset and the standard errors in the whole dataset.
The process of Multiple Imputations was initially developed by statistical agencies and different data disseminators that provide several imputed datasets for repairing the problems and inconsistency in the dataset. MI can offer plenty of advantages to data analysts while handling or filling in missing data. Multiple Imputations replace the values of the missing sales with relevant data by analyzing the whole dataset and helps surveyors to complete a survey. The information filled in by the MI method is fully based on the information of the observed dataset. This process generates efficient inferences and provides unbiased and potentially realistic distribution of the missing data. The working structure of Multiple Imputation follows a series of steps which involves fitting the data into an appropriate model, estimating a missing point of the collected data, and then it repeats the first and the second step in order to fill in the missing values. After that, the process performs data analysis using T-Test or ANOVA which runs across all the missing data points (Nissen et al. 2019, p.20). Finally, it averages the values of the estimated parameters or standard errors acquired from the data model in order to provide a single-point estimation for the model. Sometimes calculating or approximating the missing values in a dataset is dynamic and surprisingly complex. In this scenario, MI involves two of the most competent and efficient methods to analyze the dataset. Those methods are Bayesian analysis and Resampling Methods. Nowadays data analysts use relevant computer software in order to fill in missing data by performing the Multiple Imputation process.
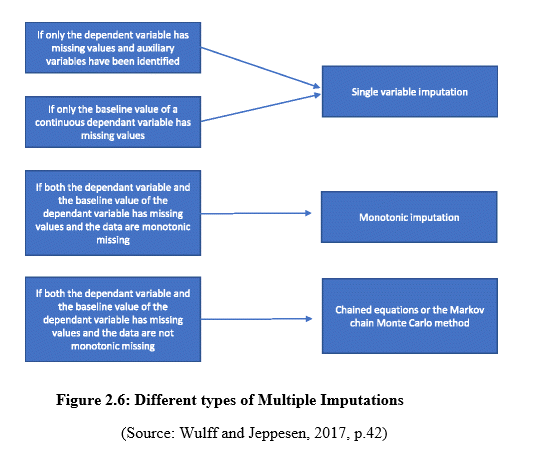
2.4: Different types of Multiple Imputation
Multiple Imputations is a simulation-based technique that helps in handling missing data. It has three different steps which involve the Imputation step, Completed-data analysis or estimation step, and pooling step. The imputation step generally represents one or multiple sets of plausible values for missing data (Nissen et al. 2019, p.24). While using the techniques of multiple imputations, the values that are missing are primarily identified and then a random plausible value replaces it with a sample of imputations. In the step of completed data analysis, the analysis is generally performed separately for each and every data set that is generated in the imputation step. Lastly, the pooling step involves the combination of completed data analyses. On the other hand, there are different types of Multiple Imputation in handling missing data. The three basic types of Multiple Imputation are Single Variable Regression Analysis, Monotonic Imputation, Markov Chain Monte Carlo (MCMC), or the Chained Equation method.

Single Variable Regression Analysis
The Single Variable Regression Analysis involves some dependent variables. It also uses a stratification variable for randomization. While using a dependent variable continuously, a base value of the dependent variable can be comprised in the process.
Monotonic Imputation
Monotonic Imputation can be generated by specifically mentioning the sequence of univariate methods. Then it gets followed by drawing sequentially synthetic observations under each and every method.
Markov Chain Monte Carlo or Chained Equation method
The basic process of Markov Chain Monte Carlo (MCMC) methods comprises a class of algorithms in order to sample from a profitability distribution. One can easily obtain a sample of the expected distribution by recording the different states from the chain (Stavsethet al. 2019, p.205). MCMC also has the expected distribution as its equilibrium distribution.
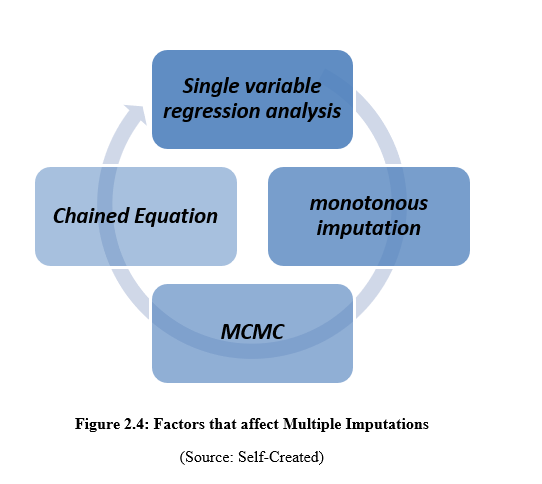
2.5: Factors that affect Multiple Imputation in handling data
Multiple imputation is a process that helps in managing data sets through missing values. The multiple imputation process works by providing a single value to every missing value through the set of plausible values. Single variable regression analysis, monotonous imputation, MCMC as well as Chained Equations are the factors that affect multiple imputation processes in managing missing data (van Ginkel et al. 2020, p.305). Multiple imputations are a process or technique that no doubt works by covering several areas to manage missing data. There are several steps like imputation, estimation and lastly pooling step in this data protection process. The process of collecting as well as saving data through the multiple imputation process is complicated as well as difficult. With the differences in the types of data, the process of managing missing data became difficult. The performance of the steps of multiple imputation processes is also different as all of them cover different kinds of data sets.
2.6: Advantages and disadvantages of using Multiple Imputation to handle missing data
Handling missing data is dynamic and complex yet an important task for surveys where some of the datasets are incomplete due to missing values. In those scenarios, data analysts use Multiple Imputation as an unbiased and efficient process in order to calculate the missing values and fill in those values properly in place. The process of Multiple Imputation expands the potential possibilities of various analyses that involve complicated models and will not converge given unbalanced data due to missingness (Stavsethet al. 2019, p.12). In such situations, the involved algorithms cannot estimate the parameters that are already involved in the process. These problems can be mitigated through Multiple Imputations as it can impute missing data by estimating the balanced data set and by doing an average of the parameters involved with it.
Multiple Imputations also create new avenues of analysis without collecting any further data, which eventually is a benefit for the process of imputation. Sometimes data analysts may determine their process of pursuing their objectives about handling missing data. Especially in complex and complicated datasets, performing imputations can be expensive. In this case, multiple imputation methods appear as a cost-beneficial procedure to handle missing data. As it is an unbiased process, it restricts unnecessary processes from entering the analysis (Takahashi, 2017, p.21). This also appears as a potential advantage of using Multiple Imputations. Apart from that, it provides an improved validity of the tests which eventually improves the accuracy of the results of the survey. Multiple Imputations is considered to be a precise process that indicates how different measurements are close to each other.
Although Multiple Imputation is an efficient process that helps in filling in missing values, it also has some drawbacks that can appear as potential problems for the researchers who are dealing with data. Initially, the problem begins while choosing the exact imputation method for handling missing data. Multiple Imputation is an extensive process that involves constant working with the imputed values, in some ways the process of working sometimes misbalances the congruence of the imputation method. Also, the accuracy of Multiple Imputations sometimes relies on the type of missing data in a project (Sim et al. 2019, p.17). Different types of missing data require different types of imputation and in this case, Multiple Imputation sometimes finds it difficult to compute the dataset and extract proper results out of it. Additionally, Multiple Imputations follow the dependent variables and those missing values consist of auxiliary values which are not identified. In this scenario, the complete analysis can be used as a primary analysis and there are no specific methods that can be used to handle missing data. But in this case, using multiple imputations can cause standard errors and it may increase these errors in the result as it encounters uncertainty introduced by the process of Multiple Imputation.
Multiple Imputations can have some effective advantages in filling in the missing data in a survey if used currently. Some advantages of Multiple Imputation (MI) are:
? It reduces the bias which eventually restricts unnecessary creeps from entering into an analysis.
? It improves the validity of a test which simply improves the accuracy of measuring the desired result of a survey. It is more appropriate while creating a test or questionnaire for a survey. It helps in addressing the specific ground of the survey which ultimately generates proper and effective results.
? MI also increases precision. Precision refers to the process which indicates how close two or more measurements are from each other. It provides the desired accuracy in the result by increasing precision in a survey.
? Multiple Imputations also result in robust statistics which outlines the extreme high or extreme low points of data. These statistics are also resistant to the outliers.
2.7: Challenges of Multiple Imputation process
There may be several challenges of multiple imputations at the time of handling missing data like-
Handling of different volumes of data
The operational process of the multiple imputation process is difficult as it works with the handling of missing data. The process of storing data that are in the database is simple, however, the possibility to recollect missing data is complicated. The process of multiple imputations takes the responsibility to complete a data set by managing as well as making plans related to the restoration process of missing data (Murray 2018, p.150). MI can work in several manners, moreover, it can be said that data argumentation is one of the most important parts of MI in controlling the loss of data. The operational process of multiple imputations is based on two individual equipment such as bayesian analysis and at the same time resampling analysis. Both methods are beneficial in managing the loss of data.
Time management
The challenge that multiple imputation processes face is related to the management of data sets no doubt. There may be the cause of missing a huge amount of data which creates a challenge for multiple imputations to complete the data set in minimum time. Moreover, this can be said that the multi-item scale of data makes the restoration process more complicated. Multiple imputations most of the time affect existing knowledge. Sometimes the restoration process takes a huge time which can cause the loss of a project. The amount of data matters at the time of collection of restoring data no doubt (Leyratet al. 2019, p.11). A small amount of missing data can be gathered at any time when a large amount of data takes much time to be restored. Though there are many advantages of multiple imputations, there is no scope of denying the fact that this process of missing data management is challenging at the time of its implementation.
Selection of the methods to manage missing data
The selection of the process of recollecting the data is also challenging as the management of the data set depends on the restoration of the same data that existed before. The selection method of the data restoration process depends on the quality of the data that are missing.
Different types of missing data
While considering the impact of missing data on a survey, the researchers should crucially consider the underlying reasons behind the missing data. In order to handle the missing data, they can be categorized into three different groups. These groups are Missing Completely At Random (MACR), missing At Random (MAR), and Missing Not At Random (MNAR). In the case of MACR, the data are missing independent of the unobserved or observed data. In this process of data, no difference that is systematic should not be there between the participants with the complete data and the missing data (Sullivan et al. 2018, p.2611). On the other hand, MAR refers to the type of missing data where the missing data is systematically related to the observed data but not related to the unobserved data. Lastly, in MNAR the missing data is related to both the unobserved data and observed data. In this type of missing data, the messiness is directly related to the factors or events that researchers do not measure.
2.8: Implementation of Multiple Imputation in handling missing data
Missing data can appear as a major restriction in surveys where the non-bias responses from people can cause an incomplete survey. In this scenario, researchers have to use some efficient statistical methods that can help in completing an incomplete survey. A variety of approaches can commonly be used by researchers in order to deal with the missing data. Primarily the most efficient technique that researchers use to deal with the missing data nowadays is the method of Multiple Imputations. At the initial stage, MI creates more than one copy of the dataset which contains especially the missing values replaced with imposed values. Most of the time these data are examined from the predictive distribution based on the observed data. Multiple Imputations involve the Bayesian approach and it should account fully for all the uncertainties to predict the values that are missing, by injecting the proper variability into the multiple times imputed values (Tiemeyer, 2018, p.145). Many researchers have found the multiple imputation techniques to be the most precise and effective technique in terms of handling missing data.
2.9: Capabilities of Multiple Imputation
Multiple imputation process is an effective process of handling the datasets that are missing due to lack of storing process of data. The cause behind the loss of data is the negligence of people in providing value to that data that was once beneficial for the operational process. There are some capabilities of multiple imputations like-
Protection of missing data
Protection of the data that are missing is one of the important parts of the operational process of multiple imputations. During deleting the unnecessary creeps, the opportunity of losing useful data is common. The process of deleting data is easy; however, the restoration process can be difficult. The negligence or the lack of carefulness of people at the time of managing data can be considered as the cause behind this losing data. There may be several cases when excessive data is lost by the management of an organization at the time of handling creep or useless data (Audigieret al. 2018, p.180). Sometimes the restoration process takes more time than expected which may cause the loss of a huge amount of projects for the management of an organization.
Managing the operational process
The management of the operational process is one of the important capabilities of multiple imputation processes. Through the management of data, the possibility to manage the loss of a project became less. It also helps to improve the validity related to a test that improves the aspired result. The test is completed through questionnaires as well as tests that develop the authenticity of data. This testing helps in the improvement of the operational process of an organization.
Increasing precision
This process refers to the closeness of one or more than one measurement with each other. The multiple imputation process is also related to robust statistics that outline a high as well as low volume of data. The size of data matters in the process of collection of restoring data no doubt. A small size of missing data can be gathered at any time, on the other hand, a large amount of data takes much time to be restored (Grund et al. 2018, p.140). There is no scope of denying the fact that this process of missing data management is challenging at the time of its implementation.
2.10: Characteristics of missing data and its protection processes
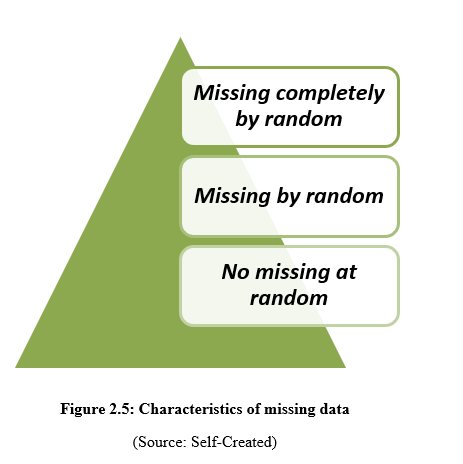
Missing data can be also recognized as data that is not stored perfectly. Missing data can provide several problems in the operational process of an organization. The absence of data can decrease the balance in the operational process of an organization or an institute. There are several types of missing data such as-
Missing completely by random
This missing data is related to negligence in managing data which causes the absence of data. This kind of missing data is not acceptable as it can reduce the reputation of an organization in the market. The operational power may be lost due to Missing data completely by random, however, the parameters which are estimated are not lost due to the missing of the data (Jakobsen et al. 2017, p.9).
Missing by random
This kind of data refers to the absences of the response of people. This type of missing data reflects that most of the time absence of data does not create big problems. This does not reflect that absence of data is beneficial or can be ignored easily.
No missing at random
This kind of missing data reflects the problems that missing data can cause. This missing data type provides the information of the negligence of people in handling or storing data. Missing values can be considered as the medium of this missing data. Moreover, it can be said that perfect planning related to storing data can reduce the risks of missing data (Enders 2017, p.15).
The operational process of the multiple imputation process is difficult as it works through the handling of missing data. The process of storing data which is in the database is simple; however, the possibility to recollect missing data is complicated. The process of deleting data is easy; however, the restoration process can be difficult. The negligence or the lack of carefulness of people at the time of managing data can be considered as the cause behind this losing data. There may be several cases when excessive data is lost by the management of an organization at the time of handling creep or useless data (Brand et al. 2019, p.215). There is no scope of denying the fact that the adobe mentioned types of missing data are difficult to be handled as losing data is easy and restoring data is difficult.
2.11: Different methods of Multiple Imputation to handle missing data
Multiple Imputation is a straightforward process that helps in filling in the missing values in a dataset. There are different methods involved in performing Multiple Imputations. The methods of MI sometimes vary due to the work structure and missing data type. In general, there are three types of Multiple Imputation and according to the complexity; these methods are taken into action by the data analysts (Huqueet al. 20108, p.16). These three types are 1) Single Value Regression Analysis, 2) Monotonic Imputation, and 3) Markov Chain Monte Carlo (MCMC) method. These methods are generally used by professionals while using Multiple Imputation in handling missing data. On the other hand, there are some different MI methods that data analysts use especially in imputing longitudinal data (Sullivan et al. 2018, p.2610). Some of the longitudinal methods are allowed to follow the subject-specific variance of error in order to produce stable results within random intercepts. Apart from that, there are different studies that professionals use while conducting the Multiple Imputation process.
Single Value Regression Analysis
This analysis process is generally concerned with the relationship between one independent numeric variable and a single dependent numeric variable. And in this analysis, the single dependent variable relies upon the independent variable in order to get things done. Also, these variables include an indicator in case the trial is multi-center and there is usually more than one variable with the prognostic information which are generally correlated with the outcomes. While using a dependent variable continuously, a general baseline value of those dependent variables might also be included in the process of analysis.
Monotonic Imputation
The imputation of missing data can be generated with a specific sequence of some univariate processes in the monotone imputation. This process follows the sequential synthetic observations under different methods. In the missing data, the method of monotone imputation is ordered into a specific pattern that follows monotone imputation. On the other hand, if the missing data is not monotone, the process of Multiple Imputation is conducted through the MCMC method which is a potential method for conducting Multiple Imputations to handle missing data.
Markov Chain Monte Carlo
MCMC is a probabilistic model that provides a wide range of algorithms for random sampling from the high-dimensional distribution of probability. This method is eligible for drawing independent samples from the actual distribution in order to perform the process of imputation. In this process, a sample is drawn where the first sample is always dependent on the existing sample. This process of dependability is called the Markov Chain. This process generally allows the actual algorithms to narrow down the quantity that is approximated from the process of distribution. It can also perform a process if a large number of variables are present there.
2.12: Practical Implication of Multiple Imputation in handling missing data
Multiple Imputation is a credible process that is generally implemented by professionals of the statistical field in order to generate the missing values within a statistical survey. The preliminary goal of Multiple Imputation is to calculate the uncertainty in a dataset because of the missing values that are present in subsequent inference. The practical implication is a bit different from the gothic objectives of Multiple Imputation (Haensch, 2021, p.21). The implication of MI in the revival of missing values is generally attained through simpler means. The working process of Multiple Imputation is similar to the task of constructing predictive and valid intervals with a single regression model. In this case, the Bayesian imputation models are the most competent method in order to perform the imputation process properly and achieve the approximate proper imputations that are generally needed for handling the uncertainties of the chosen model. The Bayesian imputation process is a reliable natural mechanism that helps in accounting for the different models with uncertainty.

Figure 2.7: Bayesian analysis
(Source: Choi et al. 2019, p.24)
In the analysis, the imputations are generated from the assumed value where 0 is a parameter that is indexing the model for Y. In order to show the uncertainties in the model, compositionally the imputations can be sampled. Here in this formula, the uncertainty of the model is represented with P and the intrinsic uncertainties of the missing values are represented with PY here. In both cases, the worth of Bayesian imputation is proven where the influence of the technique is proved as useful here. Also, the Bayesian bootstrap for a proper hot-deck imputation is a relevant example of the practical implication of Multiple Imputations in handling missing data.
2.13: Literature Gap
Different imputation-related inputs have been discussed under the different areas of discussion. Utmost effort is made of the different factors, Advantages in order to strengthen the concepts. Different important elements like Hot Deck, Cold Deck, and Mean Substitutions have been created here. This could and needs to be identified that a basic frame could act towards catering to the different sections of the analysis. This could have been discussed while understanding and analyzing the different mean values and biases. Notwithstanding different aspects to it, there are certain areas where flaws and frailties could arise (Choi et al. 2018, p.34). The Gap areas included different analyses like Non-Negative Matrix Factorization, Regression analysis, and so on. Even the different analyses like Bootstrapping, Censoring (Statistics), and others. Taking all these into consideration this could be opined that the overall literature Review contains the divergent aspects of MMC and other models and most recent and generic discussions. Although the researchers have tried to provide a clear insight of the factors that are generally used in Multiple Imputation to handle missing data, there are some limitations that were there while preparing the literature for the research. Firstly, the outbreak of COVID-19 has appeared as a drawback for the researchers to collect relevant data for the research. Apart from that, the literature of this research tries to explain the different methods used by the data analysts while performing Multiple Imputations for different purposes. Some of the grounds of Multiple Imputation were not available to the researchers because of the restricted allotted budget. Although, after all these constraints, the literature attempts to provide a fair insight into how Multiple Imputations can be useful in handling missing data.
Chapter 3: Methodology
3.1 Introduction
In order to develop this particular research tools and strategies have been implicated that have a vigorous impact on the overall research outcome. The methodology is one of the tools that help to evaluate the understanding of the ways effective strategies shape the research with proper aspects and additional understanding (Andrade, 2018). In this particular research, a conflicting understanding about the missing data and critical implication of Multiple Imputations (MI) are mentioned throughout that help to judge the ways missing data are creating complications while dealing with the project formation and strategies.
3.2 Research Philosophy
Research philosophy can be referred to as a belief that states the ways in which research should be conducted. It also states the justified and proper watts of collecting and analyzing data. In order to research around the implementation of Multiple Imputation in handling missing data, the researchers will use the Positivism Philosophy. The positivism philosophy is a philosophy that adheres to the point of view of the factual knowledge gained through several observations while conducting the whole research (Umer, 2021, p.365). This chapter represents the estimation of parameters of exponential distribution along with the assistance of the likelihood of estimator under both censored and general data.
Justification
Using positivism philosophy for this research can be justified because it helps in interpreting the research findings in an objective way. It also helps the researchers to collect precise and effective data for the research which eventually helps in conducting the research with minimum casualties.
3.3 Research Approach
The researchers will use the Deductive Approach for this research as it is completely focused on developing hypotheses based on the deductive theory. It also helps in designing a particular research strategy in order to check the credibility of the hypotheses made regarding the research topic (van Ginkel et al. 2020, p.298). Choosing the deductive approach for this research project will expectedly act positively for the researchers as it will allow them to research extensively on the application of Multiple Imputation in order to handle missing data. A deductive approach may help the researchers to figure out the causal links between the different methods of Multiple Imputation in order to handle missing data.
3.4 Research design
For this research development, the researcher has chosen a descriptive and exploratory research design. Descriptive research design helps to investigate the variables with a wide variety and also so the outcome which has an impression on the research topic is evaluated by this particular research design. The descriptive research design helps to analyze the topic with proper investigation ideas and provides an outcome with justified notations. Exploratory design helps to conduct research on the basis of previously done studies and on earlier outcomes (Eden and Ackermann, 2018). While developing this research and finding out the ways missing data evaluate the overall project structure are also mentioned with proper understanding and justification.
3.5 Research Method
In order to develop this research, the researcher has used both qualitative and quantitative research methods for a systematic project development formation. Both primary and secondary data sources have been used for this research structure development. Qualitative data help to develop research by implicating the outcomes which have previously been confirmed by some other researchers who have dealt with the topic (Cuervo et al. 2017). Critical matters related to missing data and its functions are measured by the quantitative research method implication on the other hand the qualitative research method helped the quantitative outcome to come to a conclusion.
3.6 Data Collection and Analysis Method
Collecting and analyzing data is the most important aspect of research. In this case, the researchers need to collect their needed data efficiently in order to conduct their research regarding using Multiple Imputations to handle missing data. Most importantly, the researchers need to use both primary and secondary sources to collect data. Also, they need to use procedures like ANOVA and T-test in order to analyze their collected data (Wang and Johnson, 2019, p.81). The software for analyzing the data should be based on R studio and Stata in order to generate accurate results. Also, the researchers will be using primary data sources like questionnaires and interviews of the professionals in order to gather their needed information regarding this technique. Additionally, the researchers can use datasets available online. Journals and scholarly articles regarding this topic will be helpful for the research especially the journals from the professionals can provide the researchers with extensive exposure to the implication of the Multiple Imputation process in managing missing data.
3.7 Research strategy
For this particular study development research has you step-by-step research strategy for gathering information to direct the action of the research with effort. Enabling research with systematic development criteria is all about developing the course that has the power to evaluate the result at once (Rosendaal and Pirkle, 2017). In this research, the development researcher has used the systematic action-oriented research strategy for its strong core development.
3.8 Data Sources
For the research methodology part, the researcher has used different kinds of primary and secondary sources of data to develop an analysis of the missing data and its activities. Previously done researches have helped the course of the topic related to deal with the conception of the missing data and retrieving the data by using the Multiple Imputation technique. The overall understanding also provides an idea that the data sources that have been used while developing the research have helped to manage the overall course of the ideal research development. With previous existing files, an R studio and Stata have been conducted as well to generate the result also the ANOVA and T-TEST have been conducted as well to gather the data for the resulting outcome.
3.9 Sampling technique
Sampling is very important in conducting and formulating the methodology of any research. By the sampling method, the information about the selected population is being inferred by the researcher. Various sampling techniques are there that are being used in formulating the methodology of research such as simple random sampling, systematic sampling, and stratified sampling. In this research of handling the missing data by the investigation of multiple imputations, a simple random sampling technique is to be used in which every member of the population has an equal chance and probability of getting selected effectively (Kalu et al. 2020). Moreover, by the simple random sampling technique, the error can be calculated in selecting and handling the missing data by which the selection bias can be reduced effectively which is good for the conduction of the research effectively. By this sampling technique, the missing data that is to be handled can be selected appropriately and they can be sampled effectively. Thus, by the implementation of the sampling technique properly, the research can be conducted and accomplished appropriately.
3.10 Ethical issue
Several ethical issues are being associated with the conduction of this research of handling the missing data by the investigation of multiple imputations. In handling the missing data, if there becomes any mishandling by the researcher or if there is an error in the data collection and data analysis, the occurrence of mishandling of the data can be done. As a consequence of this mishandling of the data, those data can be leaked or can be hacked by which the privacy of the data can be in danger. Moreover, those data can have important and personal information about different human beings or different organizations. By mishandling the data, they can be leaked or hacked effectively. Thus, this is a serious ethical issue that is being associated with the conduction of the research and this issue is to be mitigated appropriately for the proper conduction of the research effectively. All these ethical issues are going to manage by the following legislation from the Data Protection Act (Legislation.gov.uk, 2021).
3.11 Timetable
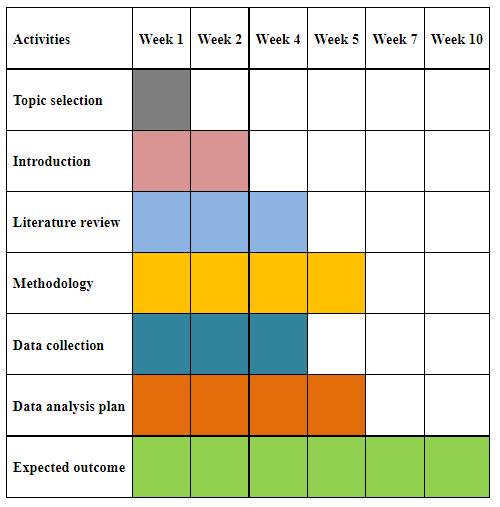
Table 3.1: Timetable of the research
(Source: Self-created)
3.12 Research limitation
Time: Though the research is being conducted very well, it does not complete in the given time and exceeds the time that is being conceded for accomplishing this research. Thus, this is a limitation in the accomplishment of the research that needs to be given more concern in the future.
Cost: The cost that was being estimated for the conduction of the research has been exceeded its value which is a limitation of conducting this research.
Data handling: Some of the missing data could not be handled well in the conduction of the research by which there is a chance of leaking data which is a big limitation in the conduction of the research.
3.13 Summary
Conclusively, it can be said that the methodology part is very important in the proper conduction of the research as by selecting the proper aspects of the methodology and formulating the methodology properly, the research can be accomplished appropriately. Moreover, the research philosophy, approach, research design, data collection, sampling technique, ethical issues, and timetable of the research are being formulated and discussed that is applicable to the conduction of the research. In addition to this, there are some limitations in the research that is also being discussed in this section effectively. These limitations need to be mitigated for the proper accomplishment of the research appropriately.
Chapter 4: Findings and Analysis
After analyzing the collected data regarding the implications of Multiple Imputations in order to handle missing data an extensive result can be extracted from the observed dataset. Researchers can yield the results after removing the rows that contain the missing values in an incomplete survey. The researchers can use a combination of different approaches in order to yield the best results. Additionally, the analysis process can follow the TDD where every method must be tested empirically. Also, the use of the ANOVA method in order to fill in the missing data stands out to be the most effective aspect of using Multiple Imputation techniques for dealing with missing data (Wulff, and Jeppesen, 2017, p.41). The research has also aimed to find out the working process of MI technology and how it replaces the missing number with the imputation value. Another finding can be extracted from the research that the MI method is the easiest method to implement and it is not computationally intensive in order to fill in missing data. Within the replaced missing values the researchers can evaluate the efficiency of the various data handling techniques along with Multiple Imputation techniques (Xie and Meng, 2017, p.1486). These processes have now moved to machine learning technologies where it is now conducted with software based on Python coding and technologies like ANOVA and T-Test have made it easier for the researchers to find out the missing values with the Multiple Imputation technique.
4.2 Quantitative data analysis
The quantitative data analysis includes the statistical data analysis that also includes the mathematical data such that the analysis has been shown using the Stata software. This also includes the representation of the mathematical results such that all the data is acquired from the Stata software. This different data analysis includes the survey data that has been shown using the data set such that the wlh has been shown. The quantitative data analysis includes the numerical data that has been shown using the Stata software. R Studio software has been utilized along with the STATA software to show the visualization and analysis such that the Linear regression, T-test, Histogram, and other visualization has been shown using the STATA software.
Thus, the assessment has also shown the different results that have been acquired from the conducted analysis that has been shown using the Stata software. The main aim of the quantitative analysis includes the determination of the correlation between the attributes that are present in the data set. Thus, from the different data visualization process the R studio and the STATA software the data visualization and different algorithm has been shown using the R studio software such as this includes the Z test, T-test and the Annova test that has been performed by the assessment using the R studio software such that this also includes the execution of the specific codes that has been implemented using the R studio software.
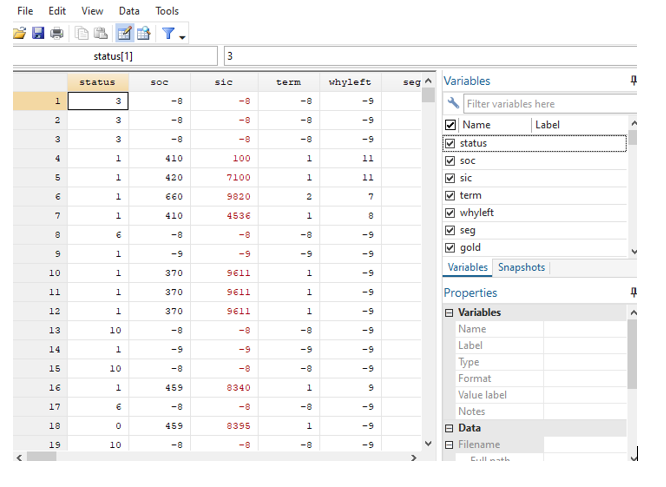
Figure 4.2.1: Reflects the data set in Stata
(Source: Self-created)
This figure reflects the data set that has been shown using the Stata software such that this shows the different variables that are present in the data set. In this research report, the assessment has been shown using the R studio and the Stata software. According to Girdler-Brown et al., (2019, p.180), the R Studio software has been used to show the Anova Test T-test upon the data set such that the complete report has been reflected using the two different software such as the R studio and the Stata.
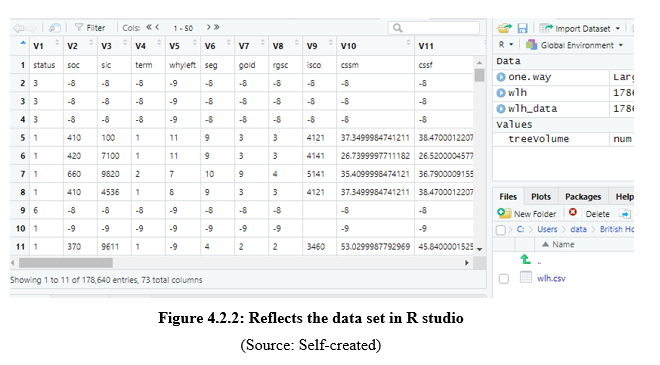
This placed figure reflects the data set that has been imported by the assessment such that the codes to view helped to reflect the data set using the R studio software.
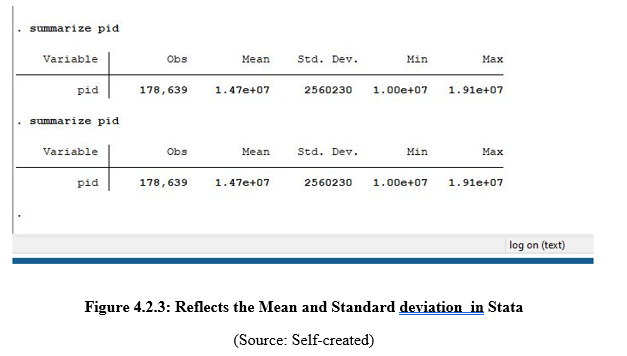
This figure reflects the mean and standard deviation using the Stata such as this reflects the mean and standard deviation has been extracted upon the PID column. This figure also reflects the value that shows that the standard deviation has been extracted with a value of 2560230 and the mean value has been extracted as 1.47 from the observation such as 178639.
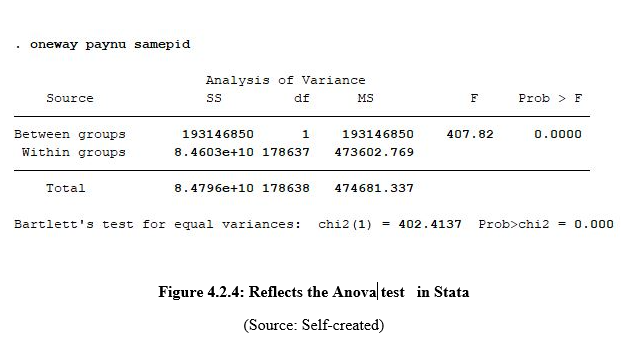
This placed figure reflects the Anova test that has been performed by the assessment using the Stat software upon the Payment column such that the value of variance has been observed as 402.4137.
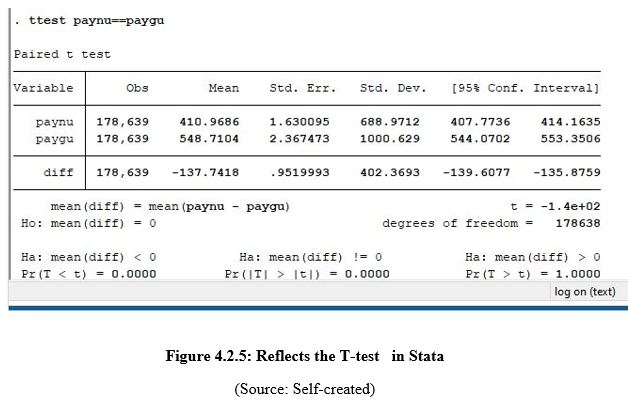
This placed figure reflects the T-test that has been performed by the assessment using the Stata software such that the degree of freedom has been extracted between two columns such “paygu” and “paynu”.
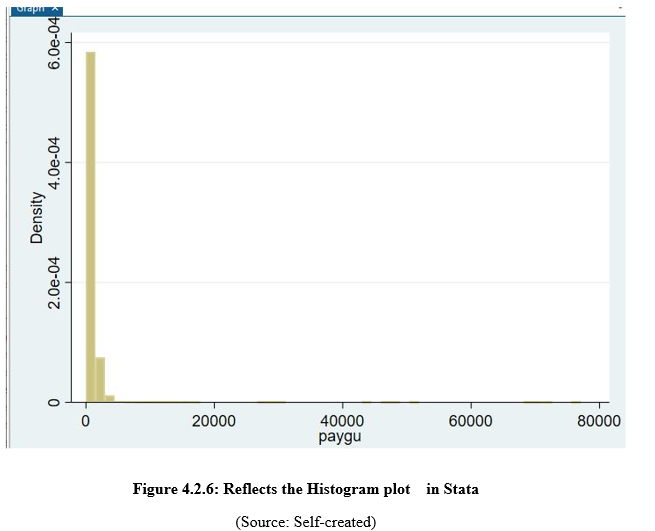
This placed figure reflects the Histogram plot that has been plotted between the payments of the employees and the density.
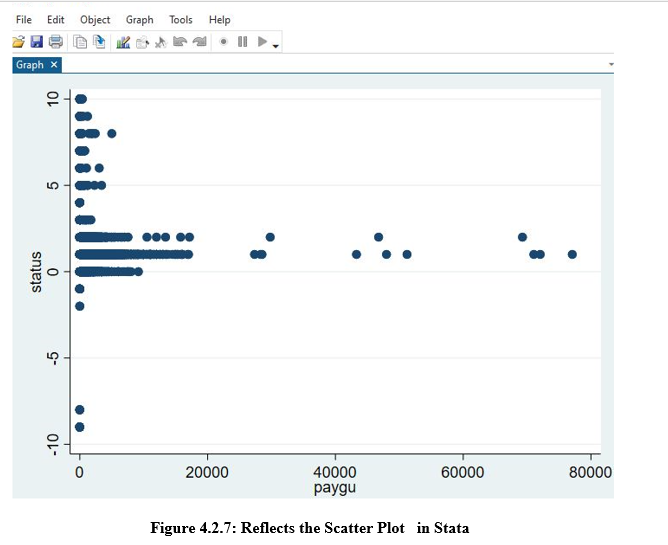
This placed figure reflects the Scatter plot that has been plotted between the payment of employees and the status of the employees with the help of the Stata software to determine the correlation between and closeness between the attributes.
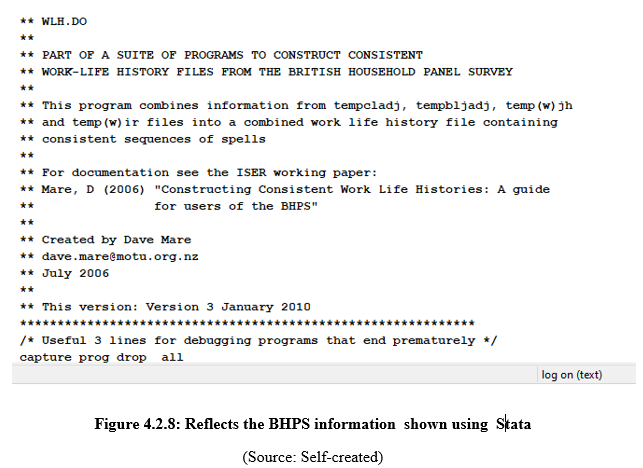
This figure reflects the bhps information that has been shown using the Stata software such that the assessment has reflected the information from the given do files. This BHPS information has been implemented such that this has been extracted using the
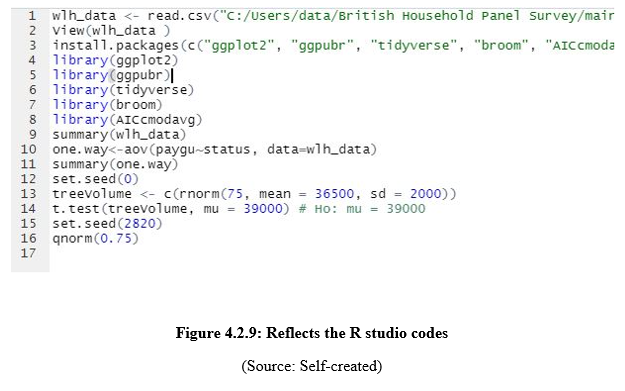
This placed figure reflects the R studio codes such that this R studio includes the installation of packages such that this also includes the summary and other different types of data analysis such as the T-test, Z-test such as the assessment.
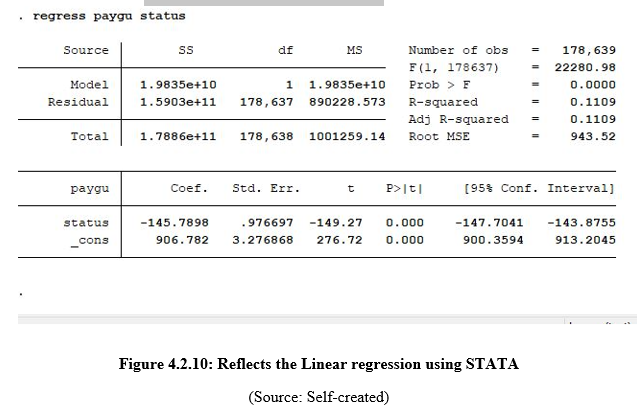
This figure reflects the result of linear regression that has been performed by the assessment using the STATA software. This figure reflects that the F1 score has been obtained from the R studio software such that this includes the 22280.98.
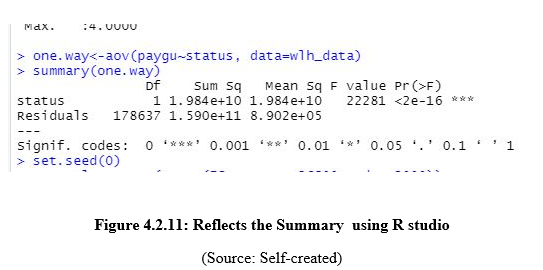
This figure reflects the summary report that was extracted by the assessment using the R studio software such that this Mean and other parameters have been extracted using the software.
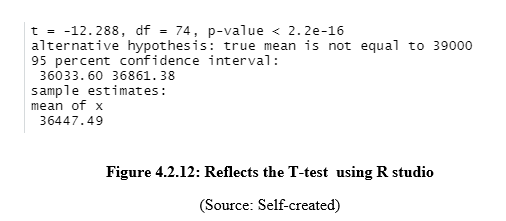
This figure reflects the T-test hypothesis that has been extracted by the assessment using the R studio software such that this shows the mean of x such as this includes the 36447.49. This summary has been extracted by the assessment using the STATA software such that this reflects the Anova test that has been implemented upon the R studio software such that this includes the 95% of the confidence level that has been implemented using the specific R studio codes that have been shown in the above figures (Nguyen et al., 2019, p.154). Here the detailed application of the ‘ggplot’ and ‘tidyverse’ helps to create the statistical test implementation. The collections of the above R studio packages help to develop the data representation. The application of those artifacts is able to present the evaluation of ANOVA and T-test. The application of the ggplot package inj the software interface of R helps to present the final visualization outcomes of the statistical data analysis method. Here is the correlation between different columns.
This different kind of data visualization and the data analysis using the two different methods such that this implemented different analysis has helped to extract the data and the data visualization(Baker, 2020, p.187). From the different data visualization, the correlation between the attributes has been shown in this research report with results of implemented analysis and visualization. Thus, The main aim of the quantitative analysis includes the determination of the correlation between the attributes that are present in the data set.
This complete section reflects the Quantitative analysis and within this quantitative analysis the results that have been extracted have been shown such as the WHl data set has been imported in both the software platforms. quantitative data analysis includes the numerical data that has been shown using the Stata software. R Studio software has been utilized along with the STATA software to show the visualization and analysis such that the Linear regression, T-test, Histogram, and other visualization has been shown using the STATA software. Thus, the assessment has also shown the different results that have been acquired from the conducted analysis that has been shown using the Stata software (Dvorak et al., 2018, p.120). This complete process involves deep research using the different methods that have been acquired using the software.
Finding 1: The effect of missing data is extremely hazardous
The effect of missing data is one of the most critical complications that different organizations face when it comes to managing and saving data for organizational function purposes. In order to manage organizational function, a company needs to gather previous data that provide knowledge about the way a company has maintained its function helps to evaluate the future therefore losing some of this data causes a tremendous hazard. Losing data has critical importance in the method of handling the overall structure of the workforce that has been implicated in an organization. Managing data is like connecting dots which needs to be in a systematic formation to provide the outcome in a formative way (Garciarena and Santana, 2017, p.65). Data science provides an understanding that missing data tends to slip through cracks from the appropriate form of data.
Handling missing data and dealing with the havocs requires proper management skills and understanding of the length of the data. It has been seen that how much bigger the dataset is the chances of losing some data has a tremendous chance. Retrieving missing data from a small data set is quite easy but as soon as the length of the data set got bigger the problem got bigger as well. The proliferation of data and understanding its values related to invertible missing scenarios related to the behavioral sciences as well (Choi et al. 2019, p.36). The academic, organization or any functional activities required to save the previously done dataset to understand the ways critical complications are already have been managed in otherwise in the past and also the way things can be managed in future depends on the way previously done. Missing data creates confusion and difficulty to conclude when it comes to making decisions.
Finding 2: There is a connection between missing data type and imputation method
There is an interconnection between the type of missing data and the imputation techniques being used to recover those datasets. The different missing data types are missing completely at random (MCAR), missing at random (MAR), missing not at random (MNAR), missing depending on the value itself (MIV) (Ginkelet al. 2020, p.308). All these data types are identified by the way they got lost and the variety of reasons behind the loss can be considered as the most formally distributed data set experiences of loss. Implicating imputation methods by understanding the ways they have got lost are considered as the full feeling part which can be executed by the differences of the consideration of the data loss. The quality of the data and the importance and method are interrelated because the classification of the problems and supervising those classifications needs to implicate proper algorithms which only can be possible if the right way of lost data type can come to light. The classification and multiple imputations depend on the way things are being managed by learning classifiers with proper supervised ways that depend on the performance and the missing data type as well. The improper choice of using multiple imputations also creates problems when it comes to dealing with lost data sets. Therefore identifying the type of the data set comes as the priority while using multiple imputations to find out the data that an institution exactly needs.
Finding 3: Multiple Imputations has a huge contribution when it comes to retrieving missing data
In order to achieve an unbiased estimate of the data outcome implicating multiple imputations turns out to be one of the most effective and satisfying ways of retrieving missing data. Using multiple imputations has severe results and its outcome helps to build the understanding with standard statistical software implication results and its interpretation is highly needed when it comes to managing organizational function. Multiple imputations work in four different stages: first, the case deletion is the primary target of this system, choosing the substitution of the missing cells is managed by this one as well, statistical imputation is the core of this function, and at last, it deals with a sensitivity analysis (Grund et al. 2018, p.149). Multiple imputations have the primary task to manage the consequences of the missing data which addresses the individual outcomes which has a vigorous impact on the workforce function. The flexibility of the data and the way statistical analysis of the data is being managed semi- routinely to make sure the potential of the result validity may not get any biased decision. The potential pitfalls of the understanding and the application of multiple imputations depend on the way statistical methods are used by using the concept of the data types which are being missed from the data set (Kwak and Kim, 2017, p.407). Replacing missing values or retrieving The lost one depends on the way statistical imputation is working. The sensitivity of the analysis that can vary the estimated range of the missing value turned out to be both good and bad and the missing number which is quite moderate helps to provide the sensitive outcome based on different circumstances.
Finding 4: Increasing traffic flow speed is also dependent on multiple data imputation
Managing a website depends on different data sets which stock the previously identified data which has a vigorous impact on the overall work function. Increasing website traffic flow depends on the way the data which has been lost is retrieved and properly implicated in website modification. The overall concept also comprises the critical analysis of the findings that are gathered while using multiple imputations whenever a traffic jam created in a website depends on the way data is being handled by the management team. Website and its function is a cloud-based portal that is managed through proper data integration understandings which eventually evolved the course of data implication in a website. Managing website flow in order to reach the customer and also to manage the organizational function flow having the sense of dealing with critical postures related to the data set provides an understanding regarding the ways data can be managed (Enders, 2017, p.18).
4.4 Conclusion
This part of the project can be concluded on the basis of the above observations and their expected outcomes. Data analysis is amongst the most essential segments in any kind of research which have the capability of summarizing acquired research data. This process is associated with the interpretation of acquired data which are acquired through the utilization of specific analytical and logical reasoning tools which play an essential role in determining different patterns, trends, and relations. This also helps researchers in evaluating the researched data as per their understanding of researched topics and materials. It also provides an insight into research and how the researchers derived their entire data and understanding of personal interpretation. In this part of the research, the researchers are able to conduct both quantitative and qualitative data analytical methods in concluding their research objectives. In this research in maintaining the optimum standards and quality of research, the researchers have utilized several Python-based algorithms including T-Test and Supportive vector mechanisms along with multiple imputation techniques. Moreover, they are also able to implement machine learning mechanisms and ANOVA in their practices which helps them in acquiring the research data they have desired to deliver before the commencement of the research and able to acquire an adequate research result.
Chapter 5: Conclusion and Recommendation
5.1 Conclusion
Handling missing values with the help of multiple imputation techniques is dependent on many methods and practices. These methods are distinctive and fruitful in their own aspect of work. Also, it can be extracted from the research that the size of the dataset, computational cost, number of missing values acts as a prior factor behind the implication of Multiple Imputation in handling missing data. Also, multiple imputations can be an effective procedure in order to validate the missing data and refill the left data. The results validity of Multiple Imputation is dependent on the data modeling and researchers should not implement it in incompetent scenarios.
The Multiple imputation process is considered to be an effective tool in order to handle missing data although, it should not be implemented everywhere. Researchers should use the MI technique particularly in the research works where the survey is incomplete but consists of some relevant data beforehand. The working process of Multiple Imputation involves analyzing the previous data and concluding according to it. Also, researchers should use three of the different methods of MI technique according to the situations given. If the messiness is not monotone, researchers should use the MCMC method in order to achieve maximum accuracy in their results.
The research work has been particularly focused upon developing the concept prior to analyzing the dataset to understand the dataset and make the necessary analysis of data using different strategies. The following research work has used different statistical tools like T-test and Anova in understanding the pattern of missing information from the data set. Missing data is a very common problem while handling big data sets, multiple imputation strategy is very commonly used. Missing pieces of information creates a backlog for any organization requiring additional resources to fulfill them in an unbiased manner. Execution of the analysis clarified the different challenges that are faced while extracting data and understanding the gaps that are present. Missing data management practice has been identified with its subsequent effects and impacts it can have on particular business activity.
During the process of handling data, there can be multiple points of imputation, in analyzing this information the system is required to collect necessary samples from the imputed model and consecutively combine them in the data set aligning it to standard error. Resampling Methods and Bayesian analysis being the two of the commonly used strategies to analyze imputed data have been utilized for constructing the research work. Missing data can be broadly classified under different categories based on the nature and type of data missing from the data set. Complete random missing of data, the random missing of data, and no random missing of data are the broad categories of missing data. The different characteristics of missing data have been investigated in this research work along with the processes that can be applied to protect the necessary information. Missing data can be handled through different methods. MCMC method, Monotonic imputation, and single value regression constitute some of the models that can be used by professions in the identification of missing data. During the imputation process, 0 is taken as a parameter for indexing the model.
5.2 Linking with objective
Linking with objective 1
The research work has included the usage of different statistical tools along with a comprehensive and extensive study of different kinds of literature. Information gathered from different academic sources has been exceptionally beneficial in understanding the different factors which are involved and consecutively contribute to the process of handling missing data. The application of multiple imputation processes has proven to be an advantageous stage towards finding missing data in the data set that has been used for analysis. The combination of results of several imputed data sets has assisted in linking with the fiesta research objective.
Linking with objective 2
The presence of multiple imputations in a particular set of data makes allowance for researchers to obtain multiple unbiased estimates for different parameters used in the sampling method. These missing data, therefore, have allowed the researcher to gain good estimates over the standard errors. Replacement of identified missing values with plausible values has allowed variation in parameter estimates.
Linking with objective 3
Multiple imputations of missing data information present themselves in a very challenging manner. Through practical application of the analysis process, the challenges have been realized in a more constructive manner. The literature review of existing studies had proved to be a repository of information allowing the researcher to identify appropriate variables to be included along with random stratification and allocation of values. Diverse strategies applied to gain information regarding the methods to fill out missing values and appropriate application in the analysis process has assisted in linking with the third objective of the research work
Linking with objective 4
Identification of a recommended strategy that is going to prove beneficial in mitigating the diverse challenges faced during filling up of missing data in data imputation techniques required gaining detailed knowledge on the topic itself. Moreover, hands-on analysis assisted in the consolidation of the theoretical knowledge into a practical manner allowing the researcher to view the challenges from a detailed perspective. Through the appropriate application of prior knowledge gained through the literature review section and its consecutive application in mitigating the different challenges faced, the fourth objective has been met.
5.3 Recommendations:
Though the effectiveness of multiple imputations in handling missing data also has some of its own critiques. Amongst these, its similarities with likelihood techniques and limitations in assuming missing data at random are amongst its capabilities. In this section, the researchers are able to provide recommendations by which individuals can enhance their capabilities in handling missing data and which can help them in acquiring adequate results. These include-
Recommendation 1: Train individuals in improving their understandings of patterns and prevalence of missing data

Recommendation 2: Implementation of machine learning methods in handling missing data
Deductive, mean median mode regression
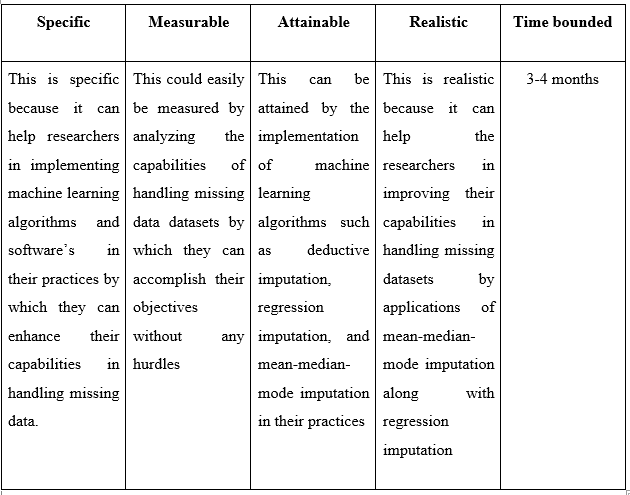
Recommendation 3: Stochastic regression imputation in handling missing data
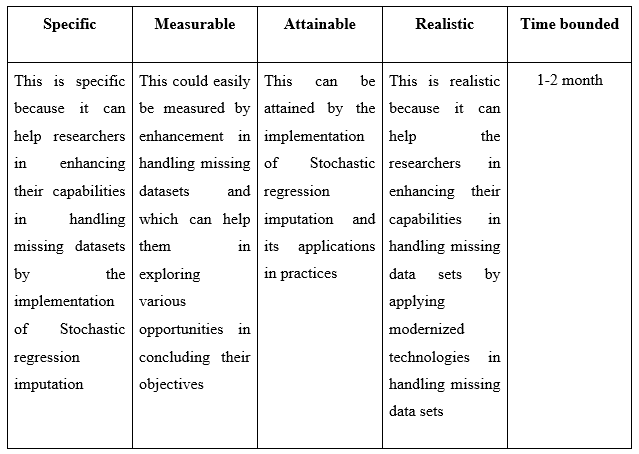
Table 5.3: Recommendation 3
(Source: Self-Created)
Recommendation 4: Deletion method in handling missing data
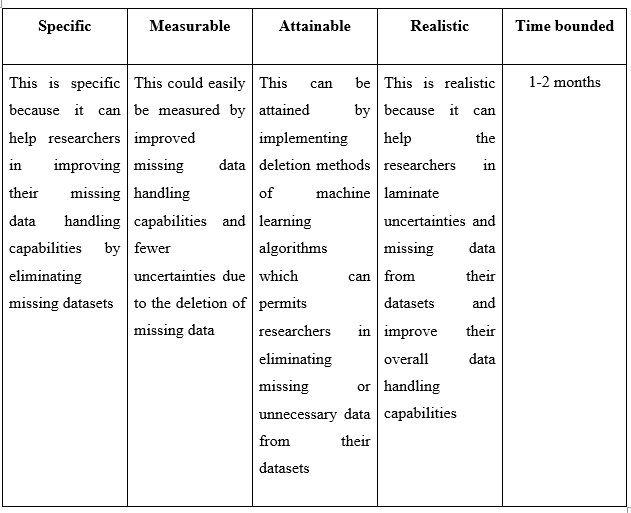
Table 5.4: Recommendation 4
(Source: Self-Created)
Recommendation 5: Technological implementation in handling missing data
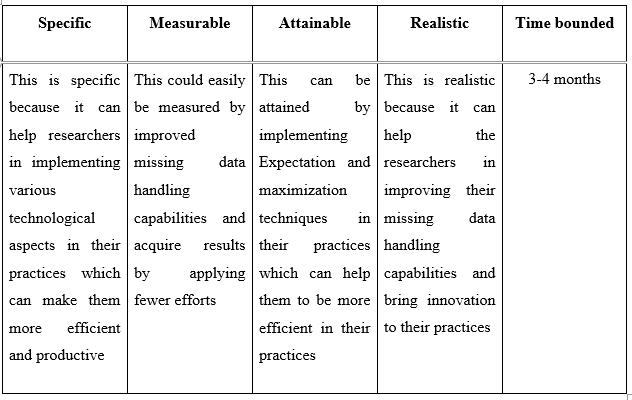
Table 5.5: Recommendation 5
(Source: Self-Created)
Recommendation 6: Alternative methods in handling missing data
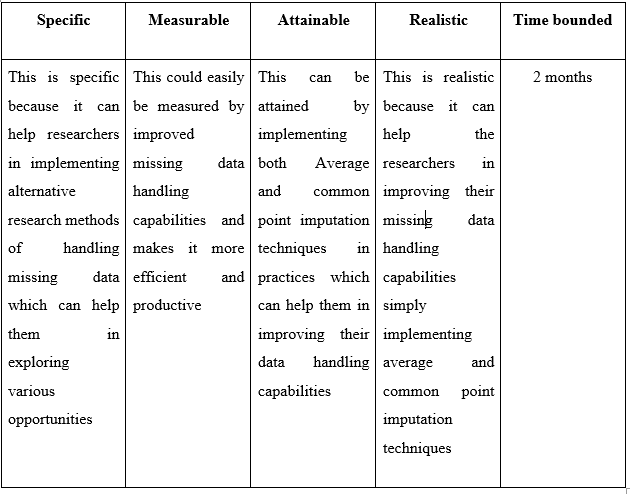
Table 5.6: Recommendation 6
(Source: Self-Created)
5.4 Limitation
One of the main disadvantages of using multiple imputation methods for the identification of missing data is that the process fails to preserve the relationship amongst variables. Therefore, in the future perspective, mean imputation can be incorporated in analyzing data so that the sample size remains similar providing unbiased results even if the data sets are missing out at random. Instances when large amounts of data are considered instances of missing information hampers the research work and simultaneously reduces the standard of information in a system. In this regard, different data sets present easily across the public platform need to be assessed so that efficient procedural planning can be executed to understand the relationship amongst the variables even better.
5.5 Future research
There has been a growing interest in the field of synthetic data attracting attention from different statistical agencies. In contrast to traditional sets of data synthetic data possesses the capabilities of optimal modification of inferential methods so that scalar quantity interval estimates can be performed for larger data sets. These strategies are also beneficial in the analysis of complex data, factor analysis, cluster analysis, and different hierarchical models. Therefore, in the future, these synthetic design strategies can be incorporated into the research work so that a better allocation of resources can be obtained.
Missing data or information has the statistical capability to lead towards great loss in different business sectors, ranging from healthcare, transport, agriculture, education, construction, and telecommunication, therefore necessary approaches need to be applied so that technology can be developed to predict missing values which do not disrupt the primary data set. Considering sets of data from different countries the models can be trained better to identify the missing information and fit them significantly eliminating the challenges brought with it. Moreover, the adoption of these approaches through future research has the benefit of developing efficient resource planning strategies.
References
.png)
.png)
.png)

- BDA601 Big Data and Analytics Report
- PSY30008 Psychology of Personality Assignment
- Construction Waste Management
- COMP1001 Data Communications and Networks Assignment
- PUBH6005 Epidemiology Assignment
- Agile Project Management Assignment
- BUMGT6958 Comparative Issues in International Management Essay 3
- Finance Broking in Practice Assignment
- PROJ6003 Risk and Communication Management Assignment
- HI6027 Business and Corporate Law
- Healthcare Systems Report
- BE275 Global Supply Chain and Operations Management Assignment
- NUR1203 Cultural Safety and professional Practice Assignment
- MBA5008 Business Research Methods Report 3
- CSM80017 Managing Quality and Safety in Construction Site Operations Report 2
- PSYC20036 Assignment 3
- MIS607 Cybersecurity Report
- BSBWOR502B Ensure Team Effectiveness Assignment
- MBA633 Real World Business Analytics and Management Case Study
- Economics Assignment


.png)
~5.png)
.png)
~1.png)


.png)


