HI6007 Statistics for Business Decisions Assignment Sample
Assignment Specifications
Purpose:
This assignment aims at assessing students’ understanding of different qualitative and quantitative research methodologies and techniques. Other purposes are:
1. Explain how statistical techniques can solve business problems
2. Identify and evaluate valid statistical techniques in a given scenario to solve business problems
3. Explain and justify the results of a statistical analysis in the context of critical reasoning for a business problem solving
4. Apply statistical knowledge to summarize data graphically and statistically, either manually or via a computer package
5. Justify and interpret statistical/analytical scenarios that best fit business solution
Instructions:
• Your assignment must be submitted in WORD format only.
• When answering questions, wherever required, you should copy/cut and paste the Excel output (e.g., plots, regression output etc.) to show your working/output. Otherwise, you will not receive the allocated marks. Moreover, you must attach your excel file which includes data, output etc.
• You are required to keep an electronic copy of your submitted assignment to re-submit, in case the original submission is failed and/or you are asked to resubmit.
• Please check your Holmes email prior to reporting your assignment mark regularly for possible communications due to failure in your submission.
Group Assignment Questions for Assignment Help
Assume your group is the team of data analytics in a renowned Australian company. The company offers their assistance to distinct group of clients including (not limited to), public listed companies, small businesses, educational institutions etc. Company has undertaken several data analysis projects and all the projects are based on multiple regression analysis.
Based on the above assumption, you are required to.
1. Develop a research question which can be addressed through multiple regression analysis.
2. Note: This should be a novel research question and you are not allowed to directly copy from internet.
3. Explain the target population and the expected sample size
4. Briefly describe the most appropriate sampling method.
5. Create a data set (in excel) which satisfy the following conditions. (You are required to upload the data file separately).
a. Minimum no of independent variables – 2 variables
b. Minimum no of observations – 30 observations
Note: You are required to provide information on whether you used primary or secondary data,
data collection source etc.
3. Perform descriptive statistical analysis and prepare a table with following descriptive measures for all the variables in your data set. Mean, median, mode, variance, standard deviation, skewness, kurtosis, coefficient of variation.
4. Briefly comment on the descriptive statistics in the part (5) and explain the nature of the distribution of those variables. Use graphs where necessary.
5. Derive suitable graph to represent the relationship between dependent variable and each independent variable in your data set. (ex: relationship between Y and X1, Y and X2 etc)
6. Based on the data set, perform a regression analysis and correlation analysis, and answer the questions given below.
a. Derive the multiple regression equation.
b. Interpret the meaning of all the coefficients in the regression equation.
c. Interpret the calculated coefficient of determination.
d. At 5% significance level, test the overall model significance.
e. At 5% significance level, assess the significance of independent variables in the model.
f. Based on the correlation coefficients in the correlation output, assess the correlation
between explanatory variables and check the possibility of multicollinearity.
Solution
Introduction:
Under the changing business scenario, firms are now concerned about making strategies with the factors that actually influence their market value. Though there are various factors that can influence the market value, core factors like profit, sales and asset value are considered to be major element that has direct impact on market value. There has been considered able amount of research that demonstrates association between market value and various core factors; however, there is very limited study that demonstrate the relation for the Indian companies. Hence, to demonstrate the association between market value with the profit, sales and asset from the perspective of the Indian public listed companies, present study has been done. To perform the study, here statistical analysis has been done using excel where descriptive statistics and inferential statistical analysis has been used.
Research Question:
Research question of the present study is as follows:
How the market value of the Indian public listed companies is influenced by the profit, sales value and asset value of the company?
Target population and sample size:
In the present study Indian public listed companies enlisted in the Forbes 2000 list has been considered (Forbes.com 2021). As per the list, there were total 50 Indian companies who have successfully endured during the pandemic and performed best to be in top 2000 companies in the world (Forbes.com 2021). Thus, the population size of the study is 50 and considering 95% confidence interval with 5% margin of error, 45 observation has been considered as the sample for final study dataset.
Sampling method:
In the contemporary research work, sampling has various approach and they can be classified into two major groups, probability sampling and non-probability sampling. If the sample size considered based on randomisation, then it is probability sampling, whereas, if the sample size is decided by the convenience of the researcher, then it is non probability sampling (Etikan and Babtope 2019, p1006(2-5)). In case of probability sampling, it can further be divided into four types, which are random sampling, systematic sampling, stratified sampling and cluster sampling. For the present study, researcher has considered sample based on the randomisation, hence, the probability sampling has been considered and as the researcher has selected data randomly, from the population, thus it can be mentioned that sampling method has followed random sampling approach. Choosing non-probability sampling would make the bias selection of the data by the researcher making validity of the finding invalid. On the other hand, choosing systematic, stratified or clustered sampling is not justified as researcher has not made any group for the purpose of analysis. Thus, random sampling is the justified option for choosing sample.
Dataset creation:
Present study has considered data from the Forbes 2000 list where top 2000 public listed companies from world has been presented (Forbes.com 2021). As the dataset has been collected from the online source, thus secondary data collection approach has been used for making the dataset (Olabode et al. 2019, p(28(2)). The complete dataset available in Forbes provides country and industry wise top public listed company names who has exceled during pandemic. From this online data source, dataset from present study has been considered where four major variables were present which are:
• Market value
• Profit
• Sales value
• Asset value
All the values of the chosen variables have been presented in the form of Billion $. For making the dataset, first all available Indian public listed companies in the Forbes 2000 list have been considered and then through the random sampling, 45 companies have been used for making final sample dataset (Forbes.com 2021). For the further analysis, market value has been marked as the dependent variable, and profit, sales value and asset value has been marked as independent variable.
Descriptive statistical analysis:
Comment on descriptive statistics:
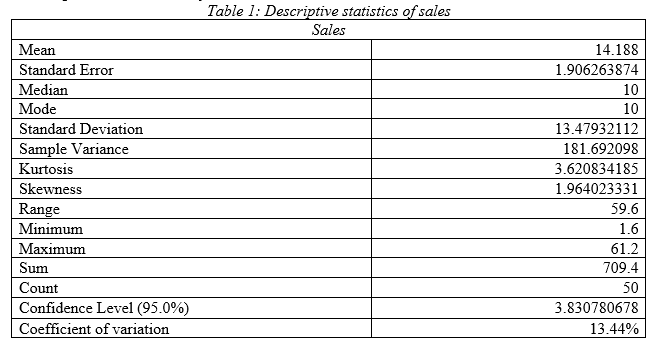
As per the descriptive statistics of sales it can be seen that mean value of annual sales of the Indian public listed companies is 14.18 billion $ with standard deviation 13.47 and variance 181.69; hence, the Indian public listed firms have high variability in sales value (Acosta et al. 2020, p3(3)). Median is 10 and mode is 10; hence most of the firms have profit of 10 billion $. As per the kurtosis and skewness, it can be seen that data has outlier and there is right tail. High range of 59.6 demonstrates, upper and lower sales value has high difference that satisfies the fact that sales data has high variability in it. Comparing the coefficient of variation, it can be stated that it has lower variation in data compared to other variables.
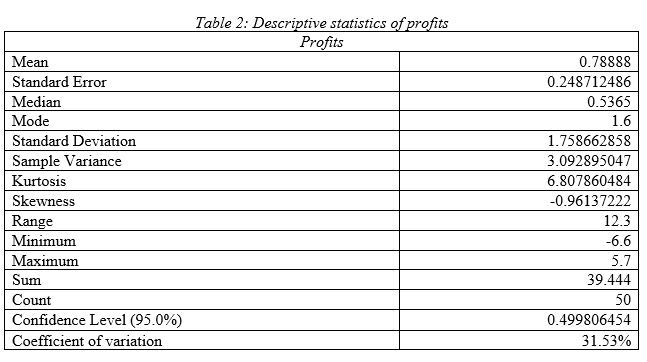
As per the descriptive statistics of profits it can be seen that mean value of annual profit of the Indian public listed companies is .79 billion $ with standard deviation 1.75 and variance 3.09; hence, the Indian public listed firms have low variability in profit value. Median is .54 and mode is 1.6; hence most of the firms have profit of .536 billion $. As per the kurtosis and skewness, it can be seen that data has outlier and there is left tail. Moderate range of 12.3 demonstrates, upper and lower profit value has low difference that satisfies the fact that profit data has low variability in it. Comparing the coefficient of variation, it can be stated that it has highest variation in data compared to other variables.
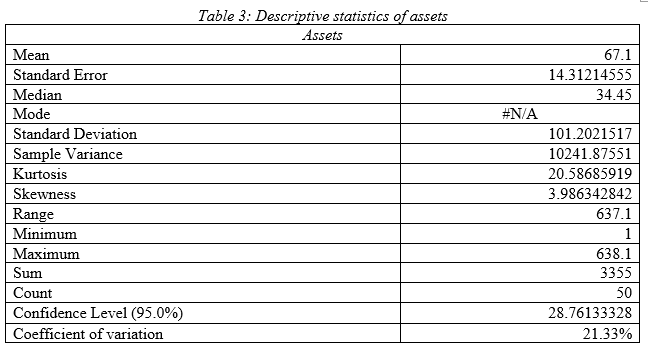
As per the descriptive statistics of assets value it can be seen that mean value of annual asset value of the Indian public listed companies is 67.1 billion $ with standard deviation 101.20 and variance 10241.87; hence, the Indian public listed firms have very high variability in assets value. Median is 34.45; hence most of the firms have asset value of 34.45 billion $. As per the kurtosis and skewness, it can be seen that data has outlier and there is right tail. High range of 637.1 demonstrates, upper and lower asset value has very high difference that satisfies the fact that asset value data has high variability in it. Comparing the coefficient of variation, it can be stated that it has high variation in data compared to other variables.
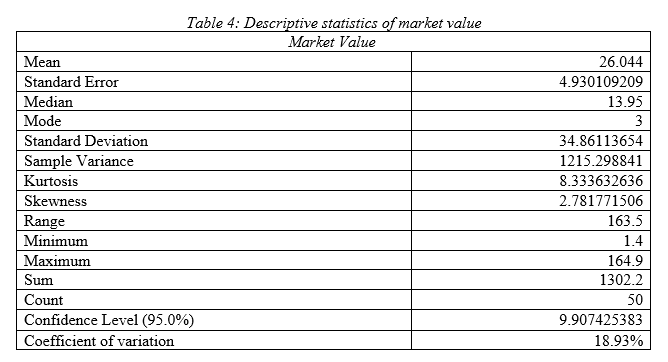
As per the descriptive statistics of market value it can be seen that mean value of annual market value of the Indian public listed companies is 26.04 billion $ with standard deviation 34.86 and variance 1215.29; hence, the Indian public listed firms have high variability in market value. Median is 13.95 and mode is 3; hence most of the firms have market value of 10 billion $. As per the kurtosis and skewness, it can be seen that data has outlier and there is right tail. High range of 163.5 demonstrates, upper and lower market value has high difference that satisfies the fact that market value data has high variability in it. Comparing the coefficient of variation, it can be stated that it has moderate variation in data compared to other variables.
Graphical presentation of association between dependent and independent variable:
In order to represent the association between the dependent variable (market value) and independent variable (profit, assets and sales value), graphical presentation has been used.
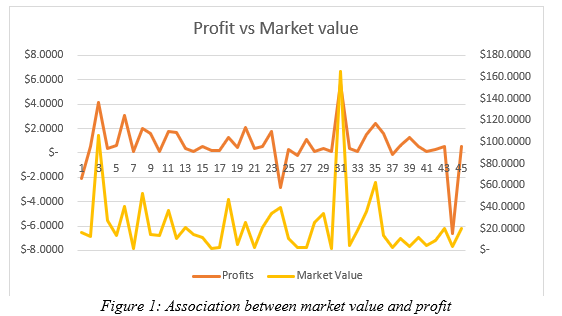
As per the figure 1, it can be seen that there is a good association between the market value and profit. As the profit of different firm changed, market value of the same has changed also. Major spikes can be seen for the 3rd, 31st and 43rd firm, where high change in the profit, and market value can be seen; however, the changes, is unidirectional. This means, overall change in the profit has resulted in change in market value in same direction.
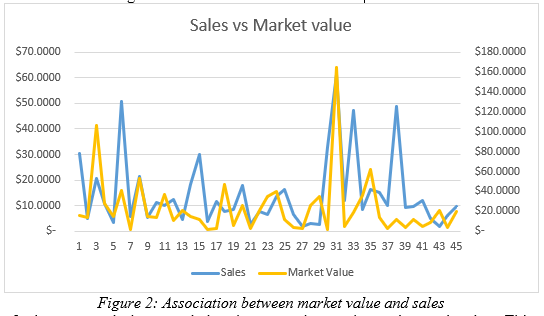
Figure 2 demonstrated the association between the market value and sales. This figure demonstrates a positive association between the dependent and independent variable. As the change occurred in sales value among the chosen Indian public listed companies, market value of the same has also changed. However, it is also important to mention that, there are some firms like 15th, 31st, 37th to 41st firm, where change in the sales value has not demonstrated identical change in market value. Thus, though the association between dependent and independent variable is positive, yet they are not very strong.
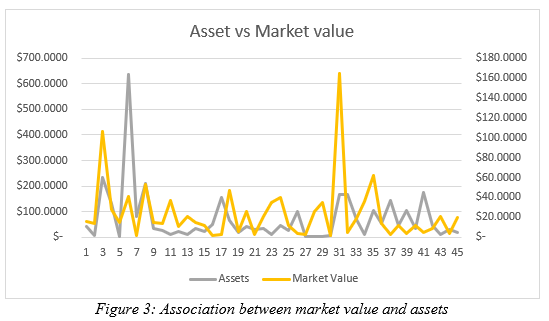
Figure 3 demonstrated association between the asset and market value. Here also change in asset price of the Indian public listed companies represent positive change in market value. However, it is also important to mention that there are certain companies like 5th, 31st, 21st to 25th, where change in asset price has been high, where as market value change has been very low. This demonstrates, though the association between asset price and market value is positive, yet it is not very strong.
Using the figure 3,
Regression analysis:
a.
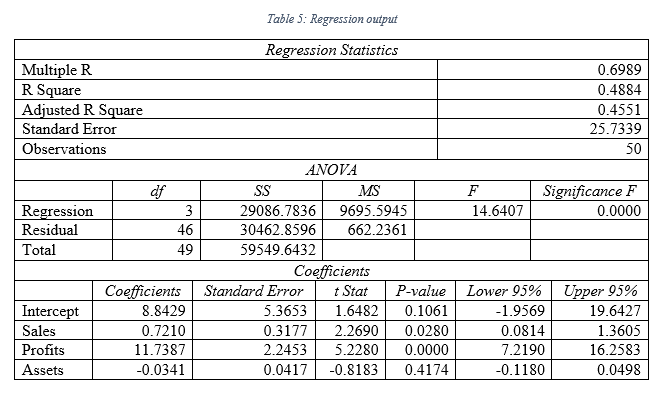
As per the regression output presented in table 5, following regression equation can be formed:
Y = 8.84 + 0.72x1 + 11.74x2 – 0.03x3
[Y represents the dependent variable market value, x1 is sales value, x2 is profit value and x3 is asset value]
b.
As per the outcome of the table 5, intercept term has been found to be 8.84; this means, even if the sales, profit and asset is nil, market value will be 8.84 billion $ for the Indian public listed companies. Sales coefficient demonstrates that, with change in each billion $ of sales, market value will be increased by .72 billion $. Coefficient of profits of 11.74 demonstrates, change in each billion $ of profit will lead to rise in market value of the Indian public listed companies by 11.74 billion $. Lastly, coefficient of -0.03 for assets, determines that change in each billion $ of assets can lead to change in market value by .03 billion dollars negatively; hence, if there is rise in asset, there will be fall in market value and vis-à-vis (Chicco et al., 2021, p6(2-3)).
c.
As per the table 5 outcome, coefficient of determination, which is R Square has been found to be 0.49. This defines that, independent variable in regression model developed can explain 56% of variability in the data of dependent variable (Kadim et al., 2020, p860(2)).
d.
At 5% level, F value significance has been found to be 0.00 and the F value is 14.64. Thus, the model is significant and a good fit model.
e.
At 5% significance level, independent variable can be considered to be significant, if the p value is lower than 0.05, which is critical value. As per the output in table 5, p value of sales has been 0.02, p value of profits has been 0.00 and p value of assets has been 0.41 respectively (Miko 2021, p2(3)). Hence, at 5% level of significance, sales and profit can significantly influence the market value as their p value is lower than 0.05.
f.
To check the multicollinearity, Variance Inflation Factors (VIF) has been used (Shrestha 2020, p39(2)).
VIF = 1/(1 – R Square) = 1/(1-.48) = 1/.52 = 1.92
As per the calculated VIF, it is lower than 5, hence there is multicollinearity.
Conclusion:
As per the analysis, it has been found that there is positive association between the market value and independent variables like sales, profit and asset value. Though the association between dependent and independent variables are positive, yet, the association for market value with sales and asset is weak. As per the regression analysis, it can also be seen that assets do not influence the market value significantly, whereas, profit and sales can influence the market value significantly.
Reference:
A Kadim, N Sunardi, T Husain (2020), The modeling firm's value based on financial ratios, intellectual capital and dividend policy, Accounting, 6(5), pp.859-870. http://m.growingscience.com/ac/Vol6/ac_2020_48.pdf
B Miko (2021), Assessment of flatness error by regression analysis, Measurement, 171, p.1 - 10. https://www.sciencedirect.com/science/article/pii/S0263224120312264
Chicco, D., Warrens, M.J. and Jurman, G., 2021. The coefficient of determination R-squared is more informative than SMAPE, MAE, MAPE, MSE and RMSE in regression analysis evaluation. PeerJ Computer Science, 7, p.e623. https://peerj.com/articles/cs-623/
Forbes.com 2021. GLOBAL 2000, The World's Largest Public Companies. Available at: https://www.forbes.com/global2000/#3f01c42f335d
I Etikan, O Babtope (2019), A basic approach in sampling methodology and sample size calculation, Med Life Clin, 1(2), p.1006. http://www.medtextpublications.com/open-access/a-basic-approach-in-sampling-methodology-and-sample-size-calculation-249.pdf
MN Acosta Montalvo, MA Andrade, E Vazquez, F Sanchez, F Gonzalez-Longatt, JL Rueda Torres (2020), Descriptive Statistical Analysis of Frequency control-related variables of Nordic Power System. https://openarchive.usn.no/usn-xmlui/bitstream/handle/11250/2758995/2020GonzalezLongattDescriptive_POSTPRINT.pdf?sequence=4&isAllowed=y
N Shrestha (2020), Detecting multicollinearity in regression analysis, American Journal of Applied Mathematics and Statistics, 8(2), pp.39-42. https://www.researchgate.net/profile/Noora-
Shrestha/publication/342413955_Detecting_Multicollinearity_in_Regression_Analysis/links/5eff2033458515505087a949/Detecting-Multicollinearity-in
-Regression-Analysis.pdf
SO Olabode, OI Olateju, AA Bakare (2019), An assessment of the reliability of secondary data in management science research, International Journal of Business and Management Review, 7(3), pp.27-43. https://www.researchgate.net/profile/Akeem Bakare 2/publication/344346438_AN_ASSESSMENT_OF_THE_RELIABILITY_OF_SECONDARY_DATA_IN_MANAGEMENT
_SCIENCE_RESEARCH/links/5f6a7ff0a6fdcc0086346109/
AN-ASSESSMENT-OF-THE-RELIABILITY-OF-SECONDARY-DATA-IN-MANAGEMENT-SCIENCE-RESEARCH

- ENGR8762 Networks and Cybersecurity
- MITS5003 Wireless Networks and Communication Case Study
- IND301A Industry Consulting Project Assignment
- SAP201 Alcohol and Other Drugs Essay 2
- The Australian Solicitors Conduct Rules
- SBU716 Corporate Financial Management Report
- MBA673 Business Analytics Lifecycle Report 3
- MBA643 Project Initiation Planning and Execution Report 3
- BUMGT5920 Management in a Global Business Environment Assignment
- Risk Return and Capital Asset Pricing Model Assignment
- DATA4900 Innovation and Creativity in Business Analytics Report 4
- MGT602 Business Decision Analytics Report
- BDA601 Big Data and Analytics Report
- ACCY962 Auditing and Risk Assurance Assignment
- Construction Waste Management
- RSK80006 Risk Management
- ISYS5003 Principles of UX Design Assignment
- MBA6301 Event Management Report 3
- DATA4300 Data Security and Ethics
- LAW500 Business Law Assignment


.png)
~5.png)
.png)
~1.png)


.png)


