Accounting Coursework Assignment Sample
Section A
Question 1: Role of Financial Ratios
1.1. Calculation of Ten Financial Ratios
1.1.1. Calculation of Financial Ratios
Table 1: Financial Ratios of Nuttall Plc
.png)
Profitability Ratios
The ability of the company to make a profit is determined by profitability ratios. For Nuttall Plc, four different profitability ratios were computed.
The sum of money left over after deducting the cost of items is known as a company's gross profit margin (Atrill, 2000). This ratio aids in determining the company's profitability before other costs are taken into account (Atrill and McLaney, 2011). The observed good gross profit margins for Nuttall Plc in 2012 and 2013 are 40% and 42%, respectively (2011). This suggests that the business is in sound financial standing.
The ratio of earnings before interest and taxes to the difference between total assets and current liabilities is known as the return on capital employed (ROCE). ROCE is crucial since it identifies an organization's general effectiveness.
Organization and assists in determining how to employ the available cash to produce profitability (Atrill, 2009). It has been noted that the ROCE for Nuttall Plc was 10.48% in 2012 and 9.42% in 2011. As a result, it is determined that the company offers a marginal return on the capital invested.
The term "return on total assets" (ROA) is used to describe the relationship between the firm's total assets and its overall profitability (before interest and taxes). This ratio demonstrates a company's ability to make a profit before fulfilling its overall responsibilities. According to Atrill and McLaney (2011), the efficiency with which a corporation utilizes its assets increases with the level of return on total assets. The corporate assets are effectively managed at Nuttall Plc. The ROA was 7.16 percent in 2012 and 6.65 percent in 2011.
The return on shareholder funds is the profitability ratio that is ultimately calculated (ROSH). This ratio aids in calculating the entire profit generated during a specific time period and provided to the company's shareholders. This ratio assists the investor in determining a company's competitive advantage so they can turn their investments into earnings (Collier, 2009). Nuttall Plc has provided an effective return on equity, it has been noted. Overall ROSH for the business was 7.16% in 2012 and 6.65% in 2011.
Liquidity Ratios
The ability of an organization to meet its immediate obligations can be determined using liquidity ratios. This section talks about two liquidity ratios.
The current ratio which is also shown by our accounting assignment help here shows how a company's liquid assets compare to its current liabilities. Any company should aim for a 2:1 current ratio (Collier, 2009). The ratio demonstrates the company's capacity to meet its obligations. It was noted that Nuttall Plc's current ratio was 2.32, which was excellent.
212, 2.68, and 2011. This suggests that the business could have paid its debts.
On the other hand, the quick ratio is also referred to as the acid test ratio. This ratio is employed to satisfy urgent needs and aids in determining a company's short-term liquidity. The inventories are not included in this ratio because it is unknown what their exact value is or how long it will take to turn them into cash. It has been determined that a ratio of 1 and higher is necessary for healthy short-term liquidity (Atrill, 2000). A extremely favourable quick ratio of 1.11 in 2012 and 1.57 in 2011 was noted for Nuttall Plc. This shows that the business was able to fulfil its immediate responsibilities.
Operating Ratios
Operating ratios are those that show how effectively a company manages its operating costs in relation to its overall revenue. The current report examines two operating ratios.
The relationship between total turnover (i.e., sales) and the overall performance of a company is determined in part by the net asset turnover of that organization, according to Atrill (2009).
Belongings to the business. A properly balanced net asset turnover ratio is required. The corporation would have high revenues with modest investments if the ratio was too high. However, a ratio that is too low would suggest that the business has been underperforming and is not effectively managing its assets. It is noted that the company's net asset ratio was 0.66 in 2012 and 0.48 in 2011. Because of the ratio's low value, demonstrates the necessity to investigate how Nuttall Plc's assets are managed organizationally.
Interest cover is described by Collier (2009) as an organization's capacity to settle its debt. It is described as the proportion of total interest expense to earnings before interest and tax. 1.5 would be the best interest cover ratio. One may get the conclusion that the company has trouble producing enough cash flow if the ratio is less than one. Nuttall Plc has an effective interest cover ratio when measured against the net asset turnover ratio. The corporation has a high ratio, which was 5.38 in 2012 and 5.88 in 2011. This demonstrates Nuttall Plc's ability to control its interest, cost-effectively, and that even if its earnings were to temporarily decline, it would not go bankrupt.
Gearing Ratio
The gearings ratio is crucial since it clarifies an organization's financial leverage. This ratio can be used to determine how much a company's operations are directly supported by the company/owner and a creditor.
To determine the percentage of a company's equity and debt, use the debt equity ratio.
It financed the assets through debt. A high debt to equity ratio shows that the company's financing has been debt-driven (Atrill and McLaney, 2011). A recommended debt-to-equity ratio is 2:1 since the business can benefit from its ability to use financial leverage. However, if the corporation is unable to strike a balance between debt financing and operational activity, it could result in bankruptcy. It is noted that the company's debt-to-equity ratio, which was 0.31 in 2012 and 0.32 in 2011, is considered to be modest. Thus, it may be said that the business is in rather good financial health.
Investor Ratios
In the current study, two different investor ratios are addressed.
A dividend distribution is the percentage of earnings that are given to the investors in dividends (Atrill, 2000). This ratio aids in assessing the efficiency with which earnings fund dividend payout. In 2012 and 2011, the company paid out 48% of its earnings as dividends, giving it a reasonably high payout ratio.
The price-earnings ratio calculates the value of a company's current share price in relation to its earnings per share (Collier, 2009). This is frequently used as a gauge of the company's previous market performance. Over the past year, Nuttall Plc's P/E increased from 0.18 in 2011 to 0.22 in 2012.
1.1.2. Examination of Nuttall Plc Performance
The last section looked at the various ratios that can be used to gauge a company's performance. In this section, we'll contrast how these ratios, the profit and loss statement, and share data are all used to assess a company's performance.
In 2012, Nuttall Plc showed an increase in operational profit of 10% and an increase in profit after tax of 12.5%, according to an analysis of the profit and loss statements. All of this suggests that Nuttall Plc performed better in 2012 than it did in 2011. Examining share prices reveals that the cost of a share increased from 202 pence in 2011 to 277 pence in 2012.
Regarding the financial ratios, the following findings are reached. The increase/decrease in financial ratios is summarised in the table below.
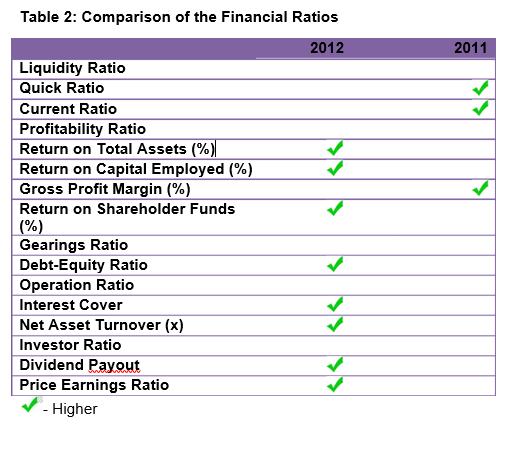
It has been noted that the liquidity ratios (quick ratio 29% and current ratio 13%) have decreased overall. However, it is discovered that every profitability measure has a high value. The ROA is up 8%, and the ROCE is up 6.9%.
ROSH by 7.64%, too. Only a 4% reduction in the gross profit margin is observed. All of this suggests that the business is profitable.
Additionally, it was discovered that the entire debt-to-equity ratio has decreased by 2%, indicating that there are more firm investments and less debt financing. This is yet another sign of the company's financial prosperity.
It is additionally noted that the company is effectively using its assets as seen by the rising operational ratios (net asset turnover 16% and interest cover 10%). These ratios provide a favorable picture of the business success.
Finally, from 2011 to 2012, the corporation increased the dividend payments it made to its shareholders. In 2011, payout accounted for 45% of earnings. In comparison, the business spent 48% of its profits in 2012. Additionally, the company's overall price-to-earnings ratio rose from 0.18 to 0.22. This suggests that the company's previous performance is improving and that its future market performance will be better.
1.1.3. Importance of Cash Flow
Based on accounting principles, the profitability of a corporation can be ascertained from its income statement. It can be seen that Nuttall Plc's entire revenue, expense, and net income are determined by the corporate balance sheet and the profit and loss accounts (Collier, 2009). However, this income accounting simply offers details on when revenue or expenses occur. Comparatively, accrual accounting offers details on all revenues and costs, when business deals are made. Although this gives a more lucid view of profitability, it is crucial to remember that focusing on accrual-based profitability without recognizing cash inflow and outflow can result in a lack of transparency.
Cash accounting and cash flow statements are used to balance out income accounting and accrual accounting. The quantity of cash a corporation generates is disclosed in this statement. Actual cash inflows and outflows are tracked in the cash flow statement. There are three distinct activities that make up the cash flow operations.
1. Cash flow from operating activities: This section shows how much money the company generates from its main line of activity. This reveals how the business makes money to benefit its shareholders.
2. Cash flow from investing activities: This section displays the amount of investments made by the organisation in capital expenditures and monetary investments (the buying and selling of money market instruments) (property and equipment).
3. Cash flow from financial activities: This part details the cash flow of business dealings between the creditors and the company's owners.
Therefore, in Nuttall Plc, the provision of a cash flow statement will aid in illuminating the causes of a decline in the liquidity ratio, the foundation of the operational ratios, and other similar aspects. Therefore, both cash flow and accounting statements (P&L and balance sheet) should be considered in any financial analysis since they aid in presenting shareholders with useful information.
1.2. Importance of Statement of Financial Position
Information on the company's assets and liabilities can be found in the statement of financial position. The difference between the company's assets and liabilities identifies the net assets or equity of the business.
The assets fall into two categories: current assets and non-current assets. Within a specific accounting period, current assets are frequently transformed into cash. In contrast, non-current assets are those that are used over a long period of time (Atrill and McLaney, 2011). An organization's liabilities can be divided into current and non-current liabilities. While non-current liabilities are frequently long-term borrowings by the corporation, current liabilities are commitments that must be paid immediately. Paid-in capital and retained earnings can be used to categorise equity broadly. Paid-in capital refers to the sum of money that the shareholders have contributed. Retained earnings show the overall income (profits) the company has generated since its founding, less dividends paid to shareholders (Atrill and McLaney, 2011).
You can determine a company's financial health by looking at its statement of financial condition. Generally speaking, an organisation can be considered to be in a pretty strong position if its assets exceed its current liabilities. It cannot, however, provide precise information on a company's earnings, costs, or profit. The statement of income is necessary for this. The total revenue, net income, and earnings per share are among the details directly needed by investors that are included in this statement. It follows that the statement of financial position (balance sheet) only slightly depicts the value of a corporation.
1.3. Role of Auditor
An auditor is a designated expert who certifies that the financial statements have been prepared in conformity with the Companies Act 1985 by presenting an impartial report to a company's members (shareholders, owners, and board of directors). If the company's accounts have been presented in a genuine and fair manner, this report should state so (Cascarino, 2007).
Reporting authority: The company's directors appoint the auditor, who serves in that capacity until the conclusion of the next meeting (usually annual). The auditor, who may be internal or external, reports to the company's stakeholders (shareholders, owners, and board of directors).
Functions of the Auditor: An auditor's main responsibility is to create the audit report (Cascarino, 2007). In addition to doing this task, the internal auditor can additionally follow up on internal controls; Analyze operations and financial data; Examine the operations' economy, efficiency, and effectiveness; examine whether laws, rules, and other external requirements are being followed and Launch specialised inquiries into frauds and other matters.
Section B
Question 2: Cost Volume Profit Analysis
2.1. Comparison of Driving School Schemes
Table 3: Comparison of Driving Schemes
.png)
It is clear from the preceding table that the current scheme has a higher break-even point (8600 hours). The driving school's break-even point is the point at which there are no profits nor losses. So, at 8600 hours, the current plan reaches this position. The current design, in contrast, needs 9010.98 hours to get here. The new scheme does, however, appear to have a higher profit margin (155400 GBP) and a higher proportion of safety margin (45%). The overall increase in fixed expenses is what caused the break-even point for the new plan to climb. As a result, if the new plan is put into place, the driving school's sales would increase by 45%. Therefore, it is advised that the driving school execute the revised plan.
2.2. Comparison of Engineering Production Schemes
In the upcoming year, 8,200 of a single type of machine produced by Sue's Engineering are anticipated to be produced and sold at a cost of £550 each. The following table shows total costs over the past five years together with the output volume levels that they correspond to. The variable cost of production for various years is determined using this table.
Table 4: Variable Cost
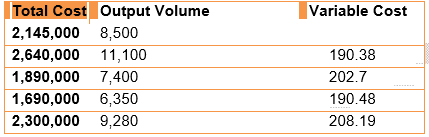
The aforementioned table demonstrates that the variable cost of production is not constant throughout time. As a result, it is impossible to determine the variable cost related to 8,200 units directly. The business is looking at two distinct plans. In the first scheme, there will be an increase in fixed expenses of £150,000 but a decrease in the variable cost per unit of £28. The second plan will result in a £375,000 reduction in fixed expenses but a £44 increase in variable costs per unit. With this context, the researcher takes the incremental numbers as given and evaluates the efficiency of Scheme 1. When comparing the two choices (i.e., raising fixed expenses and lowering variable costs), it can be seen that the incremental profit is £65,400, break-even is at 7292 units, and the margin of safety is at 909 units. It has been found that both strategies would produce consistent results when they reach break-even (i.e., 7292 units).
Table 5: Comparison of Production Schemes
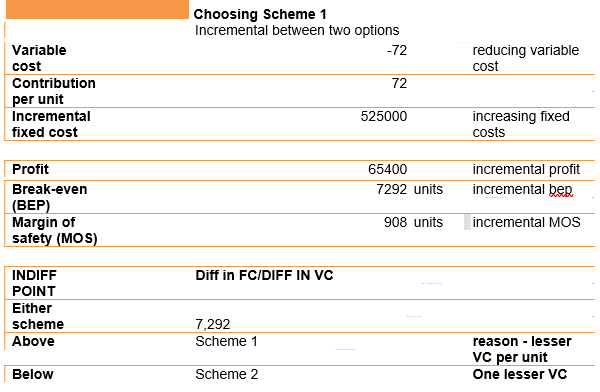
Choosing Scheme 1
Incremental between two options
The indifference point is then determined after this. The cost indifference point analysis tool identifies the cost point where two alternative solutions are equally expensive. When the manufactured units exceed the break-even mark, the circumstance with the lower variable cost should be taken into account (i.e. Scheme 1). Consider the situation with lower fixed costs if the manufactured units are smaller than the variable point (i.e. Scheme 2). Scheme 1 is favoured because there are 8200 manufactured units, which is higher than the 7200-unit threshold.
It has been determined that Sue's Engineering ought to select Scheme 1.
2.3. Weaknesses of Cost Volume Profit (CVP) Analysis
The CVP analysis has some of the following drawbacks.
There isn't much information on various product activities provided by this analysis. It is acknowledged that when many items are utilized, CVP must be completed independently for each product.
Only under the presumption that there would be no changes to the manufacturing facilities over the calculation period can this study be completed.
If input and selling prices are reasonably stable, only then will this study produce useful findings. It is challenging to employ this strategy for products when there is minimal growth and decline over brief periods of time.
The fixed expenses remain constant, but the variable costs are sometimes thought of as fluctuating throughout the course of the full period. In actuality, though, it might not come to that.
The variations between the opening and closing inventory are not taken into account. This is impossible in some circumstances.
Question 3: Capital Budgeting
3.1. Strength and Weakness of Capital Budgeting Methods: Importance of NPV
Capital budgeting is the process of estimating the future worth of assets such as new construction, machinery, and plants. This approach involves looking at a project's lifetime cash flow (both inflow and outflow). This method's objective is to ascertain whether asset returns can meet a predetermined benchmark (Mao, 2012). An organisation will explore several viable projects when the market conditions are favourable in order to boost shareholder value and boost competitive performance. However, in practise, the organisation can be constrained by a tight budget. In these circumstances, it is crucial that capital planning be done in order to comprehend the entire yield of a specific project, the time it will take for payback to be complete, as well as the time it will take to determine the optimum return on investment (Schall et al., 2012). The researcher will look at internal rate of return, net present value, discounted payback, and payback.
3.1.1. Methods of Capital Budgeting
This section will first review the definition, advantages and disadvantages of payback, NPV, and internal rate of return in order to comprehend why NPV is superior to alternative capital budgeting techniques (IRR).
Payback method: The payback method can be used to determine the exact amount of time needed to generate a given investment's return. The payback period approach can be used to calculate how long it will take an investment to pay for itself (Mao, 2012). If
A shorter payback period is favoured over a longer one if all other circumstances are equal. Additionally, it has been noted that this strategy is widely employed as a result of its simplicity. The bias in favour of liquidity that repayment has supports its adoption. Therefore, it might be viewed as the best way to monitor short-term cash flows.
The following formula can be used to determine the payback period:
Period of payback = Y+ (A/B)
Y = The overall number of years prior to the payback year.
A= The total amount still owing in order to create a cumulative cash flow 0
B = The overall repayment year's total payback amount.
Discounted payback Method: The discounted payback approach is a variant of the payback period method. This approach aids in determining the project's overall worth and calculates the payback by evaluating the time needed to cover all project costs, including a positive discounted cash flow (Frino et al., 2009).
The following formula can be used to calculate the discounted payback period:
Period of payback = Y+ (A/B)
Y = The overall number of years prior to the payback year.
A= The total amount still owing in order to create a cumulative cash flow 0
B = The overall repayment year's total payback amount.
Net present value: The second capital budgeting approach is called net present value (NPV). By utilising discounted cash flows, time- and risk-related variables, and the overall physical assets of a specific project, this approach can be helpful (Lee and Lee, 2006). By discounting back and employing time and the average cost of capital, the NPV approach, according to Frino et al. (2009), can help assess the delivery of overall cash flow to a project. The total difference between the present value of cash inflows and outflows is known as net present value, to put it simply. After taking into account variables like inflation and returns, it would be possible to determine the worth of the input capital at some future period by utilising the net present value approach. Consequently, the NPV calculation can be used to determine a project's profitability (Mao, 2012).
According to the following formula, NPV can be determined:
NPV equals Discounted Savings - Initial Cost
Internal rate of return method: The internal rate of return approach is the last technique utilised in capital planning (IRR). With the aid of this procedure, it is possible to determine the discount rate at which the net present value of all projected cash flows will be equal to zero. This strategy is used to rank several projects that the company is considering. The project's potential ability to generate a profit increases with the rate of return. Therefore, given that all other conditions are equal, the project with the highest IRR can be regarded as the best suitable one to invest in (Schall et al., 2012).
3.1.2. Disadvantages of Payback and IRR
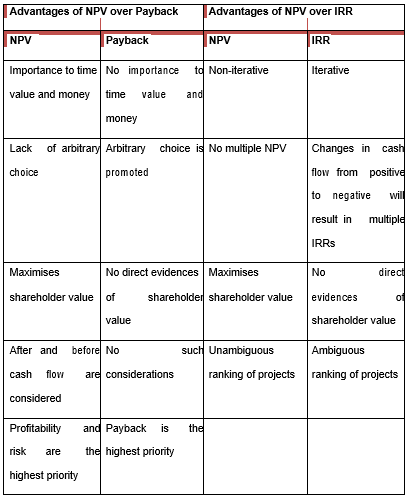
The payback period's fundamental flaw is that it disregards the time worth of money. Neither IRR nor NPV present such restrictions. Additionally, there is no established rule for choosing a hurdle point within the repayment term. Only short-term projects can be said to benefit from the payback period; long-term projects cannot be said to benefit from it. This is due to the disregard for the cash flow that continues over the cutoff threshold. The fundamental drawback of the discounted payback approach is similar in that it ignores cash flows after a certain point. As a result, it is possible that this approach will disqualify projects that genuinely have a positive net present value (Lee and Lee, 2006). The NPV technique does not reveal these drawbacks.
There are a few issues with using the IRR approach. The IRR process's iterative calculating methodology is the first downside. As a result, finding the best IRR takes a lot of time and involves several distinct iterations (Pedro, 2001). In contrast, no such iteration is necessary for NPV.
Second, if the appropriate initial discount rate is not established, changes in the cash flow from positive to negative or vice versa may result in many IRRs or no IRRs at all. In contrast, with NPV, no such differences are seen. The usage of IRR does not offer a valid way to rank projects, to sum up. Even if this method shows the return on investment from a single project, ranking two different projects cannot be done so clearly (Mao, 2012; Lee and Lee, 2006; Frino et al., 2009).
NPV aids in demonstrating the project's direct impact on shareholder wealth. This is due to the fact that the final value obtained using this method is in the form of currency. In comparison, the payback method can only display the number of years/months while the IRR approach can display the rate of return as a percentage. Therefore, the NPV method is superior in terms of directly enhancing shareholder value. The NPV technique also clearly ranks projects that are mutually exclusive, which is a benefit (Lee and Lee, 2006).
The use of NPV is not without its drawbacks, though. The fact that NPV depends on cash flow and discount rate values is one of its main drawbacks. Since they are estimates, these numbers cannot be taken as absolutes. A comparable drawback is seen with other metrics as well, though. Additionally, NPV approaches do exhibit decreased reliability when projects of various sizes are taken into account (Frino et al., 2009).
The benefits of NPV over payback and IRR are outlined in the following table.
Table 6: Advantages of NPV
3.2. Calculation of NPV, IRR and Payback
Table 7: NPV, IRR and Payback Calculations - Project I
Project 1
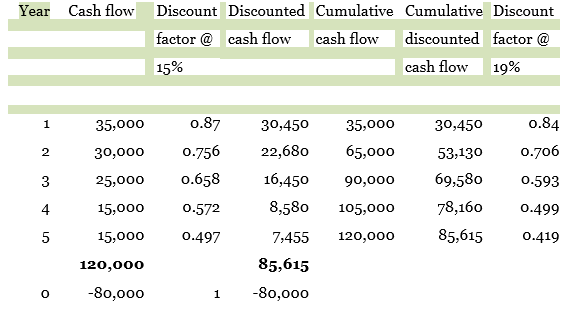
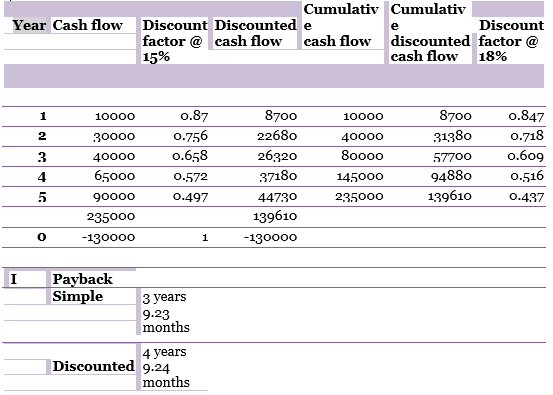
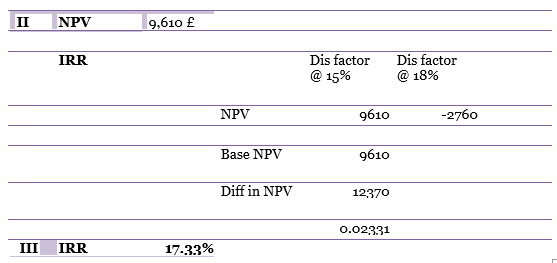
Table 8: NPV, IRR and Payback Calculations - Project II
Project 2
The following table summarizes the different capital budgeting measures.
3.3. Recommendations
The following table identifies the different projects based on individual capital budgeting methods.
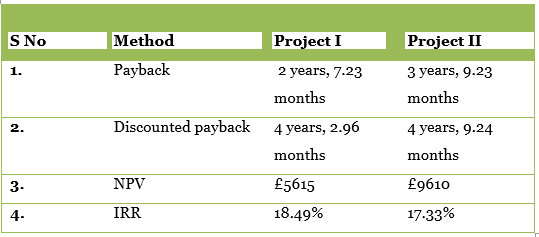
It is obvious from the following table that Project I is deemed to be a better investment by the payback and IRR methodologies. The NPV technique, however, is the most accurate way to measure capital budgeting, according to Section 3.1. In the aforementioned project, Project II's expected returns (£9610 as opposed to £5615) are discovered to be significantly higher than Project I's. Project size variations can be used to explain variances in the NPV and IRR results between the two projects, which are mutually exclusive. It is noted that the NPV is regarded as the key financial measure because the company's goal is to maximise profit and increase shareholder value.
Accounting Course Work - Capital Budgeting most effective capital budgeting criterion. As a result, it is advised that Project II PGD Ltd. has taken on.
References
Atrill, P. (2000) Financial Management for Non-specialists, 2nd ed. Harlow: Pearson Education Limited.
Atrill, P. (2009) Financial Management for Decision Makers, 5th ed. Harlow: Financial Times Prentice Hall.
Atrill, P. & McLaney, E. J. (2011) Accounting and finance for non-specialists, Pearson Education Limited.
Cascarino, R. E. (2007). Auditor's guide to information systems auditing. John Wiley & Sons.
Collier, P.M. (2009) Accounting for Managers, 3rd ed. London: John Wiley & Sons Ltd.
Frino, A., Chen, Z., & Hill, A. (2009). Introduction to corporate finance. Pearson Education Australia.
Hillier,D.J., Ross, S. A., Westerfield, R. W., Jaffe, J., & Jordan, B.D.(2010).Corporate finance: 1st European edition (No. 1st Edition). McGraw-Hill.
Lee, C. F., & Lee, A. C. (Eds.). (2006). Encyclopedia of finance. Springer.
Mao, J. C. (2012). Survey of capital budgeting: Theory and practice. The Journal of Finance, 25(2), 349-360.
Pedro, B. (Ed.). (2001). Economic analysis of investment operations: analytical tools and practical applications. World Bank-free PDF.
Schall, L. D., Sundem, G. L., & Geijsbeek, W. R. (2012). Survey and analysis of capital budgeting methods. The Journal of Finance, 33(1), 281-287

- LAW6000 Business and Corporate Law Assignment
- MBA404 Consumer Behavior and Marketing Psychology
- MCR007 Introduction To Project Management Assignment
- DATA4000 Introduction to Business Analytics Case Study 1
- CVE80010 Principles of Sustainability Report 3
- Accounting Coursework Assignment
- Recognitions Measurements and Disclosures of IAS 41
- DATA4300 Data Security and Ethics Case Study Sample
- Statistical Analysis Assignment
- EDET461 Effective Teaching 6 Professional Engagement and Reflection Report
- MBA643 Project Initiation Planning and Execution Report 3
- SIT763 Cyber Security Management Assignment
- HLTENN035 Practice Nursing With The Australian Health Care System Assignment
- HVAC System Design Assignment
- TACC606 Accounting Business Report
- COMP1702 Big Data Assignment
- BSBWOR502B Ensure Team Effectiveness Assignment
- BE553 Principles of International Marketing Assignment
- BC400 Communication and Media Management Report 2C
- Impact of US China War On The Chinese Economy and Its Long Term Implications


.png)
~5.png)
.png)
~1.png)


.png)


