CIS7030 Geospatial Analysis Assignment Sample
Task 1 – Descriptive explaining
a) Utilization of geospatial information are widely associates in social context with the support of different geospatial applications.
Discuss the following topics/techniques in conducting a geospatial data analysis.
1. Coordinate Reference Systems
2. Techniques for manipulating Geospatial Data
3. Proximity Analysis
Your answer should contain the following key points. (But not limited to those.)
An example describes real-world usage.
A code snippet/s that supports your answer.
b) The usages of geospatial technology are very minimal in Sri Lanka, comparative to other countries in the world.
Resources management and Taxation are two (2) different geospatial applications, which can fulfill the current needs of Sri Lankans. Although, these applications can fulfill Sri Lankan needs, they are not being implemented in Sri Lanka, yet. Prepare a proposal to implement those applications in Sri Lanka. Following aspects should be incorporated in each proposal
- Need assessment
- Different types of data to be input
- Proposed functions / operations
- Expected output
Task 2 – Geospatial Application (25%)
Geospatial analysis can be applicable for the matters not only contexts in social, but also environmental, economic and political. The objective of this exercise is focused to select suitable spatial regions for hospitals at Vancouver, BC. When building a new hospital, there are criteria that should be followed in order to find the most appropriate location. These criteria consist of required proximities or distances from certain features, such as roads and public washrooms.
Thus, the required criteria are as follows,
At least 500m away from Existing Hospitals
Closer (within 100m) to the Residential Area (Dwellings)
Less than 100m away from Road
Less than 100m away from Street
Less than 100m away from Sub street
Less than 200m away from Metro
At least 500m away from Public Washrooms
Less than 500m away from Fire positions
Use the existing CRS (EPSG: 26910) as project CRS and prepare a map to present your result.
Task 3 – Geospatial Modeling through Programming
Use of python/R programming to analyze Geospatial data in social context.
You are provided all kinds of crime details during first six month of the year 2017 in Colombo Municipal Council area (1-15 divisions). Further details of schools and police stations are also provided. You may use graphs, charts or map, where necessary and explain your answer for following questions.
I. What are divisions having highest overall crime densities?
II. What is most occurring crime in each division?
III. Which month occurred the highest number of crimes in each division?
IV. Prove/disprove the statement – “Drug occurrence mostly occurs in the areas lesser than 150m from school”.
Solution
Introduction
The respective assessment research has been carried out in an extensive manner, in live of presenting contribution to the trending topic of Geospatial analysis. The respective report aims to achieve the fulfilment of providing a detailed comprehension regarding the aspect of Geospatial analysis along with recognising its utilisation throughout various sectors along with the benefits that it is capable of serving.
The respective research would comprise of a detailed and descriptive explanation towards the utilisation approaches of the Geospatial information along with shedding light upon the utilisation of Geospatial technology throughout the reason of Sri Lanka along with comparing the statistics with that of other countries throughout the world, concerning the implementation of Geospatial analysis along with the observed benefits throughout those respective Nations or regions, thus assisting the company of Novartis, Germany for fulfilling their goals.
Furthermore, a detailed explanation towards the applications of Geospatial technology would be described along with presenting a detailed map as a proposal for the using the respective technology for the detection of effective spatial regions regarding the hospitals throughout this state of Vancouver. Additionally, a detailed modelling of Geospatial technology and programming would also be presented through the medium of this report by the utilisation of python programming language to carry out the analysis of Geospatial data with respect to the social context.
Task 1 – Descriptive explaining
Coordinate Reference Systems
A coordinate references system, otherwise commonly referred as CRS indicates towards the approach throughout which the respective special data capable of representing the surface of the earth is flattened, so as to enable the drawing out of two-dimensional mapping of the respective surface. Still, it could be observed that each of these respective two-dimensional surfaces are utilising varied mathematical approaches towards carrying out the flattening process, which in turn a result in the differentiations throughout the coordinates system grids. These respective approaches for carrying out the flattening of given data have been particularly developed and designed towards implementing effective levels of optimisation throughout the accuracy of the respective information with regards to the length as well as the entire area.
In attempt towards putting a definition to the location of any given region, individuals could be observed for often utilising coordinate systems. This particular system comprises of the procedure which carries out operation upon the basis of the X as well as Y values located throughout a given 2 or more-dimensional space.
.png)
Figure 1 Coordinate system musing X, Y for defining location of objects
The above presented example displays the coordinate system comprising of a two-dimensional mapping and space, while it is well known that all the individuals a reside throughout a three-dimensional Earth, which also happens to be round in shape. Therefore, in attempt towards implementing definition of the various location of objects throughout the entire globe, it is necessary that a sophisticated coordinate system should be applied which has capabilities of adapting with the shape of the earth (Dissanayake et al., 2020).
.png)
Figure 2 CRS defines the translation between a location on the round earth and that same location.
The Components of a CRS
Any given respective coordinator reference system could be observed of being developed upon the basis of the below described key components:
Co-ordinate system: the utilisation of the variables X as well as Y throughout the great upon which the respective data is overlayed along with carrying out the procedure towards it defining the respective point of location throughout the space.
Horizontal as well as vertical units: these respective units are incorporated and utilised towards implementing a sophisticated and effective definition of the entire grid along with the variables of X Y as well as Z to be utilised like that of co-ordinate axes.
Datum: it could be defined like a modelled version of the entire shape of the earth capable of defining the specific origin to be utilised for implementing and placing the entire coordinates system throughout the space.
Project information: the respective mathematical equation which has been implemented and utilised towards flattening the various objects observed to be seen on around surface, so as to view these respective objects upon a flat surface (Piyathilake et al., 2021).
Importance of CRS
It is of imperative importance that the comprehension towards the co-ordinate system utilised by the data, particularly implements and works with varied and diverse range of data that is being store throughout various types of coordinate systems. If the individual possesses the data regarding the same exact location which is already stored throughout various other coordinate reference systems, they would not be capable of lining up throughout any type of GIS as well as other categories of programs, until the individual possesses a program like that of ArcGIS or QGIS capable of extending support to the "projection on the fly aspect".
Techniques for manipulating Geospatial Data for assignment help -
Zooming technique
Zooming upon a given respective model allows a given individual to move from a standard overview of a given respective object to that of a detailed one regarding some small part. Only the few major salient features required the necessity towards appearing throughout the generalized model, various other types of smaller details are there in deemed as in significant up till this point. As the viewer carries out the operation of zooming in, and increase within the clarity and accuracy of the details become more and more apparent. This could be better understood by a real-world example where one individual is capable of starting with a map of any given respective city like New York along with zoom in up on the region known as long Island and then further carry out the zooming process to efficiently view a given respect campus by the name of Stoney Brook at the end of the map.
This could be achieved by the implementation of sophisticated and adaptive hierarchical triangulation. This particular hierarchy could be identified to comprise of various categories of fixed levels comprising only of the least significant details that are already eliminated from the coarser levels (Seevarethnam et al., 2021).
Multi resolution views
It can be identified that an ideal terrain model regarding the real time simulation should indeed comprise of representations for:
A tree, throughout which each and every type of possible pruning can be identified as being the valid terrain model. It should also further be efficiently continuous throughout the entire surface regarding each and every pruning. Also, it should also be only single valued, implicating the formula of Z = f (x,y).
The multi resolution display, in similarity to zooming technique, show cases the capability of allowing the utilisation of much fewer and highly generalized triangles for the representation of areas which are identified as being further from the perspective of camera or being categorised as less important to the respective viewer. Dissimilar to the zooming technique, the multi resolution views could be further identify to poses the combination of varied levels of significant details throughout a given single seamless model. The multi resolution display is popularly utilised towards the rendering of various types of perspective views regarding a given scenario throughout which the entire 4 ground is capable of showcasing a great deal of details, as compared to the background (Somasiri et al., 2022).
Line of sight
The line-of-sight technique for the manipulation of Geospatial data is utilised for conducting effective levels of calculation for determining whether the given two points (p1, p2) in a space as well as an object model are capable of viewing each other or not, which would also be understood as whether or not their own respective views are getting obstructed by any given object.
In the most typical approach, the line of side can indeed be calculated by conducting the driver Singh of the entire path from a given respective point to that of another. Each of this respective surface patch could also be identified towards being encountered as well as tested regarding the aspect of obscuration.
Within a highly precise model, the entire number of patches to be examined could indeed be identified as being significantly large.
The line-of-sight calculation as well as the respective technique could also be identified as been the most significant analytic function to be carried out which also further comprises of merit study throughout the past.
Proximity Analysis
Proximity analysis can be defined as one of the approaches towards conducting a detailed analysis of various location regarding the features by conducting a measurement of the distance throughout them as well as various other features in the given respective area. Any given respective distance throughout a point A as well as point B, could indeed be measured by the medium of a straight line or by following a highly sophisticated networked path, like that of a street network.
This could be also further explained and comprehended in detail by the help of an example throughout which a site selection scenario could be taken, where the given prospect is highly interested towards building a large-scale manufacturing plant throughout and area known as the Daytona beach, further comprising of a significant consideration to be observed regarding the distance from the interstate as well as the airport (Wijesekara et al., 2021).
A given respective GIS user should indeed be capable towards simply clicking upon the point of locations representing the given respective site as well as the interstate exit Ramp or that of an airport to further gain the approximate measurement of the distance to be covered. After determining the entire distance, another significant information to be considered can be identified as the water as well as sewer availability along with considering the price per acre as well as the factor of availability regarding the labour to be analysed from the given respective database.
Feature-based proximity tools
Regarding the factor of feature data, various tools could be identified to be comprised within the proximity tool set along with having capabilities towards being implemented for the determination proximity relationships. These tools are also further capable of showcasing their prowess regarding the output information comprising of various buffer features or tables. Buffers could be further utilised for delineating the protected zones across the various features all to carry out the representation of various regions of influence. Further utilisations of the multiring buffer tool could be implemented for the classification of various areas across a given respective feature in to the upcoming year or moderate distance as well as the long-distance class, for conducting a sophisticated analysis (Mathanrajet al., 2019).
Usages of geospatial technology (Sri Lanka Case)
The respective section or rather the subsection focuses upon the utilisation of Geospatial technology throughout the case of Sri Lanka regarding the resource management as well as taxation related Geospatial application, capable of full feeling the needs of the respective nation according to its current on-going scenario. The respective section could be identified as a proposal towards the implementation of these respective applications throughout Sri Lanka, further comprising of the entire assessment of the scenario along with comprehension towards the various functions as well as operations along with the general overview of the expected output regarding the implementation of the Geospatial applications.
Assessment
It is a major fact that groundwater plays a highly significant role throughout several regions having high levels of population as well as irrigated agriculture along with having insufficient surface for utilising the water resources. In accordance to this, it would be identified that there are significant range of consequences regarding the over development of groundwater along with the predominant reduction of the entire bought table as well as the over exploitation and quality deterioration throughout the aquifers.
This could be specially observed to occur throughout the coastal regions where the intrusion of saline water into that of the coastal aquifer has indeed been identified to become a significant consequence, as a resultant of the unplanned exploitation of the groundwater. Therefore, it is highly imperative and essential to carry out the assessment of the different variations throughout the quality of groundwater as well as considering the factor of its availability towards identifying the risk zone of contamination throughout the aquifers, on that of a regional scale regarding the effective management of resources.
The geographical information system otherwise also commonly known as the GIS applications indeed pose a high level of significance with regards to the mapping as well as conducting administration and monitoring along with the modelling of the entire resource management, due to the fact that the entire procedure of data monitoring would be carried out at highly limited number of sites due to the reason of high cost of installation as well as maintenance, with concerns to money and time.
Furthermore, with considerations to the factor of taxation, the land valuation could be identified like that of art as well as science regarding the assessment of the values of any land property along with a determining the supplier as well as demand of the respective land property within the market. The entire factor of land parcel value is entirely dependent upon its geographical location, all the while considering a number of various physical as well as socio economic character traits, which could be identified to be internship to the respective area of land. The respective land owner holds the liability towards making payment of the rate until being exempted by the local government (Liyanage et al., 2022).
Therefore, the entire procedure regarding the valuation of a land could be described like that of the careful estimation and considerations to be presented regarding the calculation of the birth of any given respective land property upon the basis of the experience as well as judgement and the identification and assessment of the various characteristics regarding the given piece of land. The purpose to be fulfilled by conducting the process of valuation is to present the determination regarding the entire value of the respective area of land, along with presenting it in general terms as the market value or benefit value of it.
The various influence upon the given property or a land due to the aspect of location has been broadly regarded like that of the most significant factor to be considered, yet their incorporation throughout the methodology of valuation is indeed highly implicit. Due to the introduction of the GIS based value maps, individuals have obtained a medium towards showcasing the variations throughout the respective aspect of value, with regards to the level of individual properties. Furthermore, a diverse range of characteristics could be identified that make the entire process of valuation highly difficult as well as subjective and dependent upon the significant degree of experience as well as a local knowledge, like for example the entire aspect of heterogeneity throughout the interest as well as economic influences at that of the regional, local and national scale (Dissanayake et al., 2020). These respective characteristics are not capable of getting altered, thus making the entire procedure of valuation, a challenging profession. However, it could be made easier by the implementation or introduction of GIS based if applications which would make them seem prudent towards the minimalization of valuation as well as the factor of complexity by implementing improvements throughout the accessibility and dissemination of the respective data to be operated upon.
Different data to be input and Proposed functions and expected outputs.
Regarding the resource management through the utilisation of Geo special applications, the entire aspect of data to be utilised as input could be understood by taking an example of water resource management within Sri Lanka.
This would comprise of carrying out the process of gathering the information and data regarding the quality factor of the water samples as well as the assessment of the quantity levels. This would implicate the meaning that the identification of all the sampling points regarding the ordinary Wells which are dug at various locations should be identified along with the once which are in operational conditions as well as the ones which are not along with the ones which are utilised for agriculture and domestic purposes respectively.
The factor of electrical conductivity could also be measured throughout the situ, why the utilisation of CE470 (hack) conductivity metre.
Further data to be input wood comprise of the information and details regarding the quality of the water as well as the data regarding the availability assessment which was carried out along with carrying out the gradient analysis.
The gradient analysis is to be utilised for conducting the study of the entire spatial pattern throughout the EC as well as the DTW variation within the entire study.
In addition to this, another major factor should also be taken under consideration that is regarding the local indicators regarding the spatial auto correlations, also known as LISA. Has been the dimension regarding the spatial relationships, LISA is capable of allowing the individuals to carry out the detection of various clusters regarding the geographic parameters under the presented assumption that the entire spatial pattern is indeed non-random distribution.
With regards to the aspect of taxation as a Geo special application, it can be set that the integrated geographical buffering systems otherwise also known as the IGBS, is the highly effective as well as easy to understand procedure to be implemented along with possessing capabilities towards providing the individuals with quick as well as highly cheap technological platforms to be utilised like that of a base to conduct analysis. It also presents the individuals or users with the initial stage comprising of the spatial representation regarding the entire property information, to be utilised like that of a input, within the form of value maps(Pathmanandakumar et al., 2021). The capabilities to be demonstrated by the utilisation of the geographical information system could be observed as not only limited to the facilitation of organisations as well as conducting the management of the entire geographic data, but are also highly capable of unable in the researchers towards taking complete advantage of the information regarding locations which are comprised within the database so as to extend their support to the application of the spatial statistical as well as the special econometric tools.
With regards to the factor of complexity throughout the procedure of land valuation, property owners would indeed receive an approach which is highly easy to understand along with being highly capable for presenting explanation regarding how the respective property is being valued, does eliminating the continuous challenge post to the planners as well as assessors. The integrated geographical buffering system which would be operated upon the basis of the GIS as well as GPS is capable of completely full feeling the specified requirements regarding the taxation related procedures, as explained with the help of land valuation. Thus, the utilisation of different buffering modules along with that of a visual value model as well as the required valuation maps could indeed be easily created as well as extend effective levels of support to the individuals.
Task 2 – Geospatial Application
The respective section fulfils its objective of presenting a detailed exercise which drives the focus upon the discerning of suitable spatial regions for the development of hospitals throughout the city of Vancouver, BC. Several considerations have been taken as a concern for following the identification of the most appropriate allocation towards the development of hospitals.
.png)
Figure 3 Mapping for identification for location 500m away from existing hospitals
.png)
Figure 4 mapping for being in range of or away by 100m with various structures or entities.
Figure 5 mapping considerations for placing hospital 200mm away from Metro and 500m away from public Wash rooms and Fire Positions
Through the above presented screenshots representing the showcasing of various map results, it can be imperatively discerned that effective considerations have been presented towards the establishment of hospitals that are at least 500 m away from that of the existing ones. Furthermore, further considerations have also been presented towards selecting areas for establishing hospital which are closer to the residential area (within 100m of range), and effective considerations were also presented towards placing it away from the road Street as well as sub streets, by presenting a consideration of 100 m away. The results were also generated by basing the location upon being 200 m away from any metro, while also providing considerations for placing it away from various fire positions and public washrooms by providing a range of 500 m.
Task 3 – Geospatial Modelling through Programming
What are divisions having highest overall crime densities?
The respective results are generated with orientation towards the fulfilment of needs of Novartis, Germany, along with how the aspect Geospatial Analysis is capable of assisting the respective company.
.png)
Figure 6: Result for overall highest crime.
.png)
Figure 7: Count of overall highest crime
Grand Pass could be identified as the one having the highest overall crime density. But apart from this it can also be observed that the regions like, kollupitiya, Maradana, pettha, Modara and several other regions also present quite a high overall crime density value as they live throughout the range or count of 30 to 40.
What is most occurring crime in each division?
.png)
Figure 8: Most occurring crime
.png)
Figure 9: Count of crime based on type
It can be efficiently observed through the obtained results that the region of wellawatta has presented the most occurring crime as house breaking as well as theft within its respective division.
With regards to the division of Armour Street, it can be efficiently observed that the most occurring crime within this respective division is robbery
Which month occurred the highest number of crimes in each division?
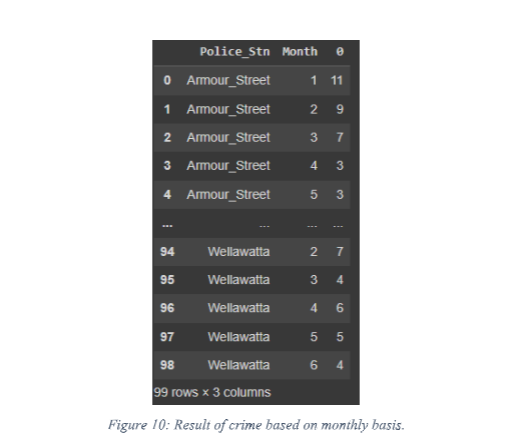
Figure 10: Result of crime based on monthly basis.
It can be efficiently observed through the obtained results that the region of wellawatta has presented the most occurring crime as house breaking as well as theft, on the months of April and July respectively, within its respective division.
.png)
Figure 11: Graphical representation of month count crime.
For Armour Street
The highest crime occurred in month of January.
For division Kurunduwaththa
.png)
Figure 12: Result for Kudurnduwaththa
.png)
Figure 13: In Krurnduwaththa
The highest crime occurred in month of January, march and may.
For division Modara
.png)
Figure 14: For Modara.
The highest crime occurred in month of February.
References
.png)

- BSBSUS511 Develop Workplace Policy and Procedure Assignment
- COIT20256 Data Structure and Algorithms Assignment
- MG401 Leadership in Agribusiness Part c Report 2
- BUSN20016 Research in Business Assignment
- BUS500 Business and Management Assignment
- LMED28001 Chemical Pathology Case Study 1
- ECO500 Economics for Business Assignment
- LB5236 International Political Economy Report
- PROJ6000 Assignment 3
- MEM604 Engineering Management Capstone Assignment
- MGT501 Business Environment Report 2
- DATA6000 Capstone Industry Case Studies Assignment
- External Auditing Process and Its Stages Assignment
- PRJM6003 Project Risk Management Assignment
- TSM11105 International Tourism Assignment
- MITS4002 Object Oriented Software Development Assignment
- LAW1081 The Individual and The State Formative Assignment
- Strategic Management Assignment
- MIS301 Cyber Security Assignment
- DATA4300 Data Security and Ethics


.png)
~5.png)
.png)
~1.png)


.png)


