FIN600/ FINA6017 Financial Management Assignment Sample
Question
Instructions
The basic requirement is to undertake a general financial analysis, comparing financial position and performance over the two most recent financial years, of an ASX listed company. Your Learning Facilitator will provide the details of the ASX listed company. The annual report for the chosen company should be available on the company website and/or will be provided by your Learning Facilitator. The analysis should consider each of the following financial ratios: - profitability and market performance
- Efficiency,
- Liquidity,
- Capital structure
Note: You are to use the ‘consolidated’ data in conducting your analysis. You are only required to look at the most recent financial report. For those ratios which involve averages, you will calculate an average for the most recent year only, the prior year ratio calculation will NOT consider average calculations.
This assignment will contain two elements: 1. Schedule(s) of relevant ratios and other useful calculations
- The detailed calculation of relevant ratios and other useful calculations should be included, as one appendix, prepared using Excel. An example template is provided under the assessment 2 information, Assessment 2 Appendix template.xls.
- You will be advised by your facilitator as to which ratios to calculate.
- You are advised to show the formulae used in determining particular ratios and other figures.
2. A written report The written report is the main element of this assessment. A sample template is provided under the assessment 2 information, Assessment 2 report template.doc. The written report should:
- Explain what is revealed by the ratios and other calculations, in the context of the company’s profitability, asset efficiency, liquidity, capital structure, and market performance.
- In particular, any important changes over the two financial years should be identified, discussed and, where possible, explained.
- Provide an overall assessment of whether the company, over the recent financial year, has been better than the previous financial year, in the perspective of existing equity investors (shareholders).
In preparing this report, you should:
- analyse the financial statements of the business;
- identify key ratios and apply ratio analysis; - argue the case of why the organisation may or may not succeed in the future and what the business should be doing to help it succeed;
- consider the impact of the political and competitive environment on the business;
- include external factors that need to be taken into consideration and the likelihood of a merger or acquisition;
- provide a recommendation, that is, would you invest in this company after your own analysis or under what circumstances would you buy/save the business?
SOLUTION
• Introduction
• Background and Business
Bega Cheese is an Australian Diversified food company with its manufacturing site and headquarters located in New South wales, Victoria and Queens. It was established as an agricultural business in the town of Bega located in New South Wales by suppliers of dairy in Australia. The company subsequently got public in 2011 and got listed in Australian stock exchange. More than half the shares that are currently outstanding in the market, is owns by the farmers of Bega Suppliers. Currently, it is one of the largest companies in the dairy industry of Australia and was responsible for supplying more than 750 million liters of milk for the year ending 2018 (begacheese.com.au 2021).
The primary source of income for Bega is its spread product like along with packaged dairy products and other grocery products with their flagship “Bega” brand owning 15.7% of the Australian cheese retail market. The other major food brands operating under the brand name Bega include Farmers Table, “Picky Picky” and Zoosh. Fronterra is a major distributor of all Bega dairy products under long term agreement. The 1/3 of Bega’s revenue results from export activities of the nation. The Cheese products of the brand are exported to over 40 countries around the world and distributed across Australia where they are easily available in all general stores and supermarkets (begacheese.com.au 2021).
Other business segment of the company comprises of core dairy ingredients such as cream cheese, cheese and powered milk and nutritional products produced under the Bega Bio nutrients brand which contributes to 9% of the total revenue of business. In the year 2017, Bega announced its sponsorship to mumbulla foundation 2017 gala dinner. In 2019, it won a legal dispute against Kraft Heinz over their peanut butter packaging. In 2020, they raised considerable amount of fund to purchase Kirin’s suite of dairy products (begacheese.com.au 2021).
• Company Analysis
• Current Financial performance, Key financial highlights, Economic outlook
For the year ending 2020, the Bega Cheese has performed in a sound and stable way which is why it is critical to assess the financial statement of the company. Against the backdrop of increased uncertainty imposed by covid 19, Bega successfully overcame all odds and strengthen its cash reserves while extending their helping hand in unprecedented times. The challenging year even though have left every industry shook and broke, Bega managed to survive and build resilience through is effective planning and strategy execution. The culture and experience of the business has once again reflected on the firm’s strong financial outlook and financial efficacy over the years (begacheese.com.au 2021).
Financial highlights/events of 2020
• For the year ending 2020, the company successfully increased its revenue by 5% to $1.49 Billion compared to the performance of 2019.
• While the revenue has been steadily increasing, the increasing competitive environment of milk and dairy supply chain has normalized PAT and EBITDA that amounted to $236.4 Million, a reduction of 18% (Kourtis, Kourtis & Curtis, 2019).
• The overall production of the business was drastically impacted by prolonged drought and competition in supply chain which reduced productivity by 2% to 298 thousand tonnes. Bega cheese is persistent in reviewing its infrastructure and integrating it with supply profile and the market.
• Year 2020 was the year of focusing on strengthening the balance sheet of the business and improve cash management which helped the company in reducing its net debt to $236.4 Million as at 30th June.
• The EBITDA of business amounted to $103 Million which is towards the upper end of guidance (Setiawan & Amboningtyas, 2018).
Economic Outlook
• The group is well positioned as it enters the financial year 2021 with improved profit contributions from the recently commissioned lactoferrin facility at Koroit.
• Further, the company is expecting to benefit from reduced debt and working capital which would further strengthen its potential acquisition ability.
• Innovation in the product category would depend on the performance of existing products including Simply Nuts and Vegemite (AREAS, 2018).
• The dairy category of the business would continue to strengthen the company’s performance even further and would enable it to reach new highlights of success while driving more revenue in the long run.
• In the opening quarter of 2021, the prices of milk were lower than 2020, majorly onset by the Covid 19 pandemic which reduced the demand of dairy products (Mitrovi, Kneževi? & Veli?kovi?, 2015).
• Ratio Analysis
• Profitability and Market ratios
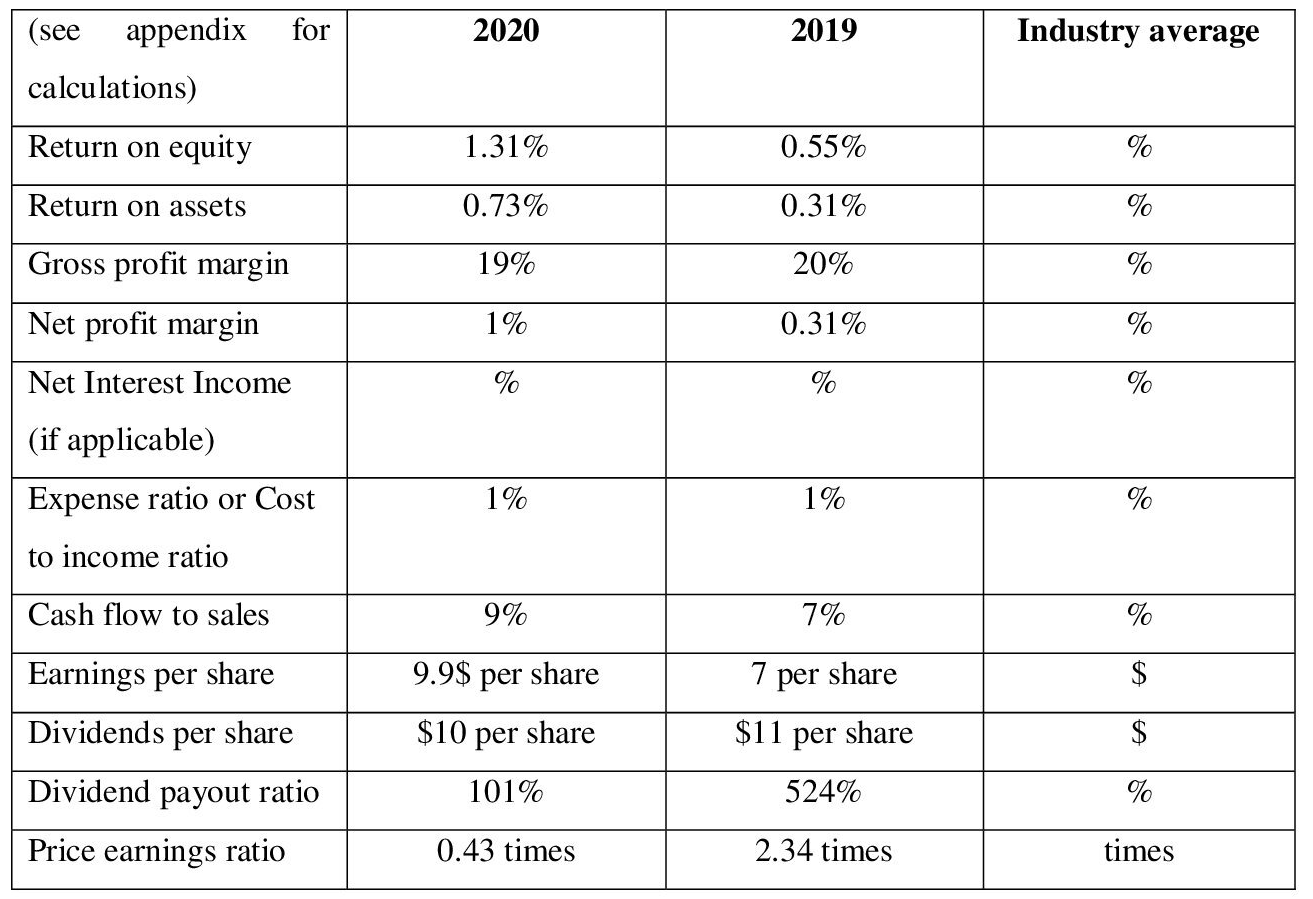
As can be observed by the table above, it represents the financial outlook of Bega Cheese for the years ending 2020 and 2019 to observe its trend and comment on its changing financial positioning. First thing to be observed is a steady growth in the ROE of business. ROE represents the returns that the company is generating from the effective investment of its equity share capital. As can be seen, even though the increase is marginal in nature, it indicates that the company’s expertise to improve its revenue stream from successful investment strategy has increased over a period of one year, and if the management continues to operate in the same pace, then the revenue stream would increase further in the future (Kanapickien? & Grundien?, 2015).
Further, the ROA, which indicates the returns from the total asset, has also increased to a marginal level from 0.31% in 2019 to 0.73% in 2020. This would not have any significant impact on the overall growth, but in general, a growing trend is a good indication and suggests that the assets of the company are effectively increasing its productivity and hence are able to generate better revenue based on the performance (Arkan, 2016).
However, the gross profit, which indicates the income of business after covering for the cost of goods sold, depicts a marginal trend, by falling to 19% in 2020 compared to 20% in 2019. Even though the decline is not drastic compared to the uncertainties that the business went through, if the reason behind the decline is not properly monitored, it would eventually leverage the entire operations of the company and would make the operations highly vulnerable. Usually, a declining trend is observed when the growth in COSG is higher than the revenue, or revenue has significantly declined, or sometimes a combination of both (Olariu, 2016).
The expense ratio seems to be in a constant state indicating the fact that the expenses have been kept effectively under control even under uncertain times like the pandemic, which has put a dent the overall performance of the business. The company needs to significantly focus on increasing its income, and be better able to cover for all the outstanding expenses, which at the moment, it relatively lower than the industry standard and is certainly an area of concern (Nofiana & Sunarsi, 2020).
The cash flow to sales ratio reflects a positive trend by increasing to 9% in 2020 compared to 7% of 2019. This means that the company has improved its cash retaining capacity and is saving more from total sales rather than spending in on operational activities of the firm. However, compared to the industry standard, the ratio is relatively lower, and means that the company is struggling to retain majority of its revenue and is rather spending a lot in its operations (Ball et al., 2015).
Further, the EPS of the business also reflects a increasing trend from 7 per share in 2019 to 9.9 per share in 2020. This means that the company has successfully invested its share in the market to improve its revenue stream. A n increasing EPS is always a good indication and suggests that the company is able of skillfully managing its revenue from and increase it using outstanding equity.
Dividend per share marginally declined which was expected as the company faced much hardship dealing with the impact of covid 19 virus. Finally. The P/E ratio of the company stood undervalued for the year 2020 compared to its value of 2019. This means that the shares of the business are being traded lower than the market value which is an ideal situation for buying shares (Ichsani & Suhardi, 2015).
• Efficiency ratios
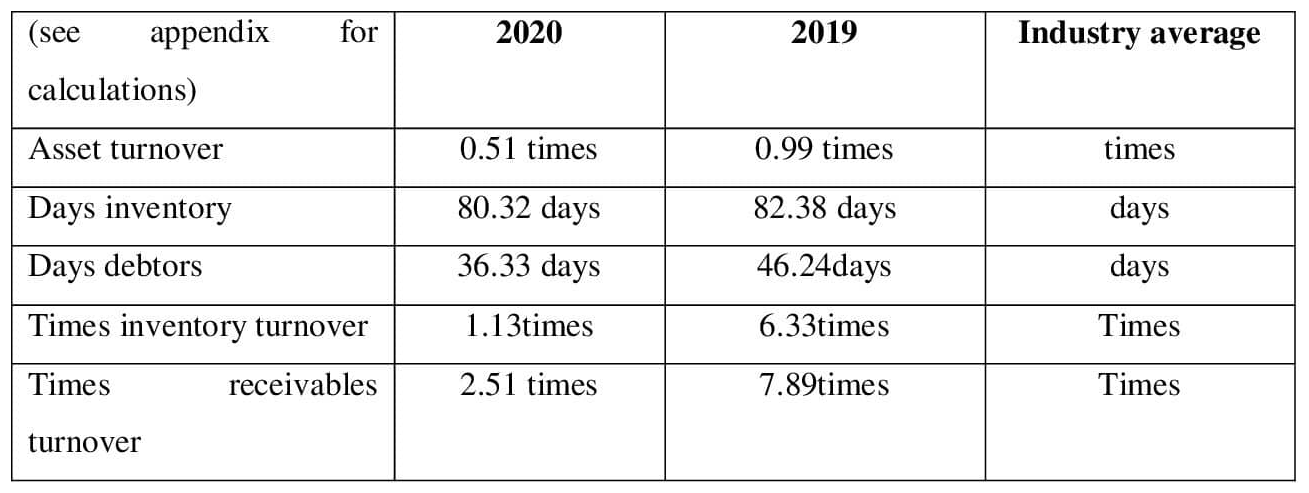
Efficiency ratios helps in assessing the ability of company to work efficiently and use its resources in a way that would generate the highest value for the company and decrease cash outflow as much as possible. Efficiency ratios are critical for the interpretation of company’s performance as it provides insight into the ability of business to effectively manage all the internal resources while keeping check on cash outflows in the process (Olesen et al., 2015).
As can be seen from the table above, the asset turnover of the business has a marginal declining trend and reduced to 0.51 times for 2020 compared to 0.99 of 2019. Even though it would not have drastic or immediate negative impact on the performance of business, a declining trend is indicative of the fact that the efficiency of total assets to generate and improve revenue has reduced, and hence the company needs to invest in the in improving its productivity and ensure that the assets are in demand and strengthen the balance sheet of business.
Day’s inventory is the number of days that the company rakes to sell its entire inventory and replace it with new one. As can be seen from the chart above, the days inventory of the business is relatively higher than the industry average. Investors usually prefer investing in companies with short inventories days as the revenue generation in these companies are usually high. Even though the days inventory of Bega Cheese has a declining trend, it is not very impressive compared to some of its competitors (Bunker, Cagle & Harris, 2019).
Days debtor on the other hand, indicate the amount of time it takes for a business to collect its receivable from debtors. As can be seen, the days debtor’s ratio of Bega cheese reduced from 46.24 days of 2019 to 36.33 days in 2020. This is a good indication and suggests that company is improving its capability of collecting its debts on time and to reduce the chances of incurring bad debts. It can undertake many initiatives to further improve its collection period like providing early bird discount. Times inventory of the business also has a declining trend which is not a good indication and suggests that the number of times an inventory is sold within a financial year has been reduced, primary due to pandemic Covid 19.
Time receivables turnover is the number of times a company collects its receivables from debtors. As can be seen, the times receivable of Bega Cheese for 2020 amounted to 2.51 compared to 7.89 of 2019, a downward trend which is not very preferred by investors as it means that the company is not putting much effort in collecting its receivables (Garanina & Belova, 2015).
• Liquidity ratios
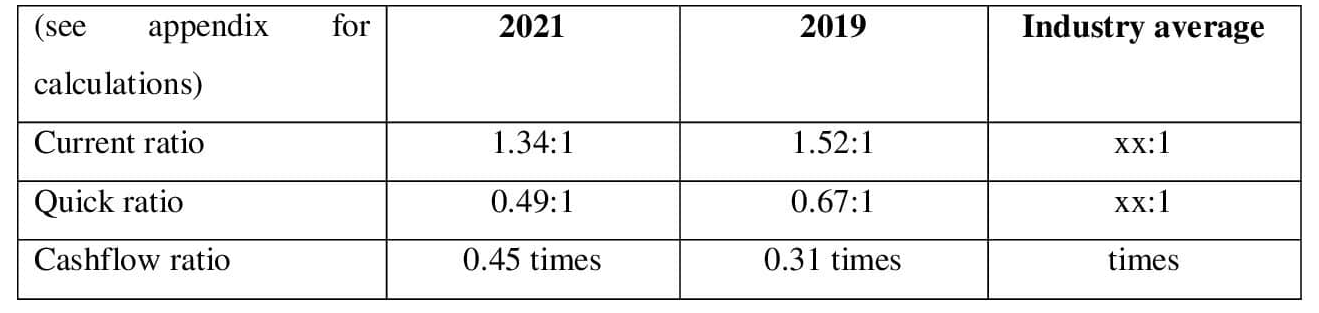
Liquidity ratio helps in assessing the short-term solvency of companies. The first and foremost liquidity that can be observed from the table above is current ratio. This ratio helps in comparing marketable assets with short term debts of the company. Current ratio of Bega Cheese for both the years is observed to be higher than one which means that the current ratio is higher than current liabilities and hence the business is capable enough to cover for all short-term debts without raising external source of funding (Saputra, 2019).
Quick ratio on the other hand helps in assessing the liquidity of business after deducting the inventories from current asset. As seen, quick ratio for both the years has been lower than one which means that the company is not capable enough to meet for its debts if the inventories are excluded from the current assets of the company (Alipour et al., 2015).
• Gearing ratios
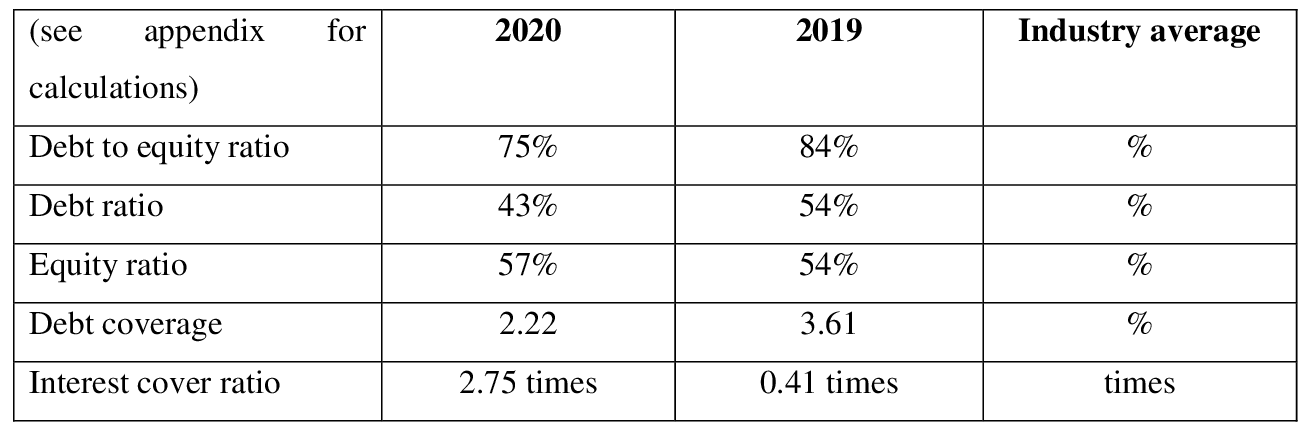
Gearing ratio helps in gaining insight into the liquidity of company. Debt to equity ratio of the business amounted to 0.75 for 2020 compared to 0.84 of 2019. For both the years the debt-to-equity ratio was lower than one which means that company gives more importance to equity to fund most of its operations (Trenca, Petria & Corovei, 2015).
Debt ratio on the other hand provides insight into the number of total debts used to fund the total assets that the company currently owns. The debt ratio of 2020 and 2019 amounted to 0.43 and 0.46 respectively. This means for every $1 spent on asset, 0.43 is funding from debts and rest from other sources of funding. Preference over s specific funding source is a matter of choice. Generally, businesses avoid being highly dependent on debts to fund most of its operation as the chances of becoming highly leveraged increases (Lang & Schmidt, 2016).
On the other hand, it can be noted that equity ratio of the business has an increasing trend which means that preference towards equity to fund the acquisition of assets is high. Also. Equity ratio of 0.57 means that for every $1 dollar spent on asset, 0.57 is sourced from the equity capital. Businesses gives high preference to equity ratio has it does not have the company leveraged and the company is not obligated to return back the capital gathered unlike the debt funding. However, the cost of maintaining equity capital is significantly higher than debt which needs to be keep in mind (Yapa Abeywardhana, 2017).
Debt coverage ratio indicates the ability of company to cover for long term debts using the cash from operating activities. As can be seen from the table above, the debt coverage ratio for both the years have been higher than one, even though having declining trend. This means that the cash from operating activities is significantly lower and can effectively cover for the long-term debts.
Lastly, the interest coverage ratio is a capital structure ratio which indicates the ability of business to cover for interest expense using the EBIT. As can be seen from the table above, the Interest coverage has significantly positive and increasing trend. This means that EBIT of company has increased at a faster pace than interest expense and hence Bega Cheese has become significantly capable of cover for its interest expense without needing funds from external sources (Öztekin, 2015).
• Recommendations and overall assessment
Has the reporting year been better than the prior reporting year for the company?
The reporting year of 2020 has not been better than the previous year, primarily due to the onset of Covid 19 pandemic is reduced prices of its dairy products. Further, the profitability ratios for both the years have not been very impressive given the competitive environment of dairy industry in Australia. Apart from the ROE, ROA and net margin ratios, with a marginal increasing trend all other profitability ratio had a declining trend (begacheese.com.au 2021).
This indicates, that even though the company has gain market leadership in the industry, it is still failing to generate significant income for itself, due to increase competition in the market and inability of investing in new innovative products. Further, the ROE and ROE of the company is not very impressive as well standing at 1.31% and 0.73% respectively which is an area of concern and indicates that the company is failing to generate value from its resources.
Will the company succeed in the future?
Based on the assessment of gearing and efficiency ratio, the chances of business succeeding in future is relatively high, as the business has survived an unfortunate event like the Covid 19 pandemic and was still able to improve its revenue significantly. Also, the current ratios of the business are more than 1 for both the years which means that the company is capable enough to cover for its short-term debts without raising external source of funding.
However, based on the efficiency ratio, the growth and success of business seems doubtful as the company does not have effective strategy in place to collect receivables from debtors and neither has a high receivable turnover ratio which increases the chances of incurring bad debts. As far as the gearing ratio is concerned, Bega Cheese is dependent on the equity share capital for funding most of its capital which means that the company would not get heavily leveraged in the future.
The likelihood of a merger or acquisition of the company?
In the upcoming years, the company is likely to acquire a business rather than getting acquired as it has significant hold over the market place and is a renowned dairy business located in Australia. It is also very likely to increase to create huge synergy through acquisition. However, the company has been lagging behind is significantly improving its profitability which is an area of concern,
Even if the company successfully acquires a business, the chances of becoming highly leverage would also increase. This is due to the fact that the company inclination towards debt money would steadily increase with increased requirement of capital. Further based on its interest coverage ratio, Bega Cheese would be able to cover for its long-term debts without needing external funding.
Suggest what should the company be doing help it succeeds
• There are several things that the business can do to improve its performance. Firstly, it can expand its line of products to attract higher customer base. It can expand its operation to international market which would help gaining traction from all around the world. It can also offer special discounts to its loyal customer to retain their loyalty.
Bega Cheese needs to improve their profitability and efficiency ratio which are considerably lagging behind in the market. The profitability can be increased by increasing revenue while the efficiency can be improved by increasing the returns from invested assets.
External impacts that need to be taken into consideration
The impact of government on the business
The external factors such as economy of country, political factors, technological factors, environmental and social factors are some of the aspects which the business needs to consider while taking any decision. Economic factors such as GDP growth can help boost the revenue of business while political factors can limit the chances of success.
Government can impose higher tax on businesses making significantly high revenue which posses’ immense threat to the income of company. Further, it regulates the performance of businesses in the market which is another reason why it is necessary to abide by the rules and regulation set by the administration of country.
Would you invest in this company?
Based on the performance and evaluation of ratios, I would not invest in the stakes of business and rather look for better alternatives which has higher chances of geniting revenue. The major concern for me is declining EPS and ROE which are two critical areas depending on which a company can the performance is assessed. Also, the shares are trading lower than market value which is another red signal for the company.
• References/Bibliography
Alipour, M., Mohammadi, M.F.S. & Derakhshan, H., (2015). Determinants of capital structure: an empirical study of firms in Iran. International Journal of Law and Management.
AREAS, B., (2018). Financial analysis. growth, 30, p.10.
Arkan, T., (2016). The importance of financial ratios in predicting stock price trends: A case study in emerging markets. Finanse, Rynki Finansowe, Ubezpieczenia, (79), pp.13-26.
Ball, R., Gerakos, J., Linnainmaa, J.T. & Nikolaev, V.V., (2015). Deflating profitability. Journal of Financial Economics, 117(2), pp.225-248.
Begacheese.com.au 2021. Home - Bega Cheese. [online] Retrieved from: https://www.begacheese.com.au/
Bunker, R.B., Cagle, C. & Harris, D., (2019). A Liquidity Ratio Analysis of Lean vs. Not-Lean Operations. Management Accounting Quarterly, 20(2), pp.10-16.
Garanina, T.A. & Belova, O.A., (2015). Liquidity, cash conversion cycle and financial performance: case of Russian companies.
Ichsani, S. & Suhardi, A.R., (2015). The effect of return on equity (ROE) and return on investment (ROI) on trading volume. Procedia-Social and Behavioral Sciences, 211, pp.896-902.
Kanapickien?, R. & Grundien?, Ž., (2015). The model of fraud detection in financial statements by means of financial ratios. Procedia-Social and Behavioral Sciences, 213, pp.321-327.
Kourtis, E., Kourtis, G. & Curtis, P., (2019). Αn Integrated Financial Ratio Analysis as a Navigation Compass through the Fraudulent Reporting Conundrum: Α Case Study. International Journal of Finance, Insurance and Risk Management, 9(1-2), pp.3-20.
Lang, M. & Schmidt, P.G., (2016). The early warnings of banking crises: Interaction of broad liquidity and demand deposits. Journal of International Money and Finance, 61, pp.1-29.
Mitrovi?, A., Kneževi?, S. & Veli?kovi?, M., (2015). RATIO ANALYSIS SPECIFICS OF THE FAMILY DAIRIES’FINANCIAL STATEMENTS. ????????? ????????????, 62(4).
Nofiana, L. & Sunarsi, D., (2020). The Influence of Inventory Round Ratio and Activities Round Ratio of Profitability (ROI). JASa (Jurnal Akuntansi, Audit dan Sistem Informasi Akuntansi), 4(1), pp.95-103.
Olariu, D.B., (2016). Profitability ratio as a tool for bankruptcy prediction. SEA–Practical Application of Science, 4(11), pp.369-372.
Olesen, O.B., Petersen, N.C. & Podinovski, V.V., (2015). Efficiency analysis with ratio measures. European Journal of Operational Research, 245(2), pp.446-462.
Öztekin, Ö., (2015). Capital structure decisions around the world: which factors are reliably important?. Journal of Financial and Quantitative Analysis, 50(3), pp.301-323.
Saputra, A.J., (2019). The Effect Of Liquidity Ratio Leverage Ratio And Activity Ratio In Predicting Financial Distress. Management and Economic Journal, pp.581-592.
Setiawan, H. & Amboningtyas, D., (2018). Financial Ratio Analysis for Predicting Financial Distress Conditions (Study on Telecommunication Companies Listed In Indonesia Stock Exchange Period 2010-2016). Journal of Management, 4(4).
Trenca, I., Petria, N. & Corovei, E.A., (2015). Impact of macroeconomic variables upon the banking system liquidity. Procedia Economics and Finance, 32, pp.1170-1177.
Yapa Abeywardhana, D., (2017). Capital structure theory: An overview. Accounting and finance research, 6(1).

- EDUC1001 Language and Learning in Your Discipline Assignment
- CAP203 Care of The Person with an Acute Illness Case Study
- MBA622 Comprehensive Healthcare Strategies
- PROJ 6012 Information Technology Report
- MGT613 Leadership For Sustainable Futures
- CHCMHS006 Facilitate The Recovery Process with The Person, Family and Carers
- PUBH6002 Global and Environmental Health Issue Assignment
- Business Capstone Project Assignments
- DATA4300 Data Security and Ethics
- Wind Turbine Power Production Estimation for Better Financial Agreements
- MBIS4004 System Design Report
- PROG2008 Computational Thinking Assignment 3
- MKTG10001 Principles of Marketing Assignment
- BUS500 Business and Management Assignment
- SHI104 Sociology of Health and Illness Assignment
- BUS3002 Business School Industrial Experience Assignment
- SOC10012 Global Perspective On Modernity Assignment
- BSBPMG430 Undertake Projectwork Assignment
- TME6014 Technology Management and Entrepreneurship Assignment
- MBA5007 Managing Strategy and Innovation Report


.png)
~5.png)
.png)
~1.png)


.png)


