Reports
SBU716 Corporate Financial Management Report Sample
Assignment Details
As the financial manager for Company XYZ, you are tasked with conducting a comprehensive financial management assessment to support the company’s strategic decision to expand into a new industry. This case study aims to evaluate the financial structure, expected returns, and exposure to capital market volatility of the target industry. The assessment will encompass a thorough review of both equity and debt financing options while considering the prevailing economic conditions. This evaluation will serve as the foundation for
Assessment Two in this module. Although each assessment will be graded separately, they are interconnected and should be viewed as part of a cohesive analysis. You need to read the background for the company XYZ below
Task 1: Industry and Economic Landscape Analysis – 500 words
To begin with, you must select an industry that aligns with Company XYZ’s strategic goals and competencies. The choice of industry should be based on careful consideration of market opportunities and potential synergies with XYZs existing operations. Once the industry is selected, conduct a detailed analysis of the industry’s position within the current economic landscape. This analysis should identify and evaluate the primary economic factors and indicators most relevant to the industry.
Task 2: Company Analysis and Financing Options Assessment – 1000 words
Select a representative publicly traded company within the chosen industry to serve as a benchmark for your analysis. Next, conduct a critical assessment of the financing options available to the selected company for a new project within the industry. This evaluation should consider both equity and debt financing options and their implications for Company XYZ’s financial health. Analyse, expected returns and the most pertinent financial metrics for the industry including the Weighted Average Cost of Capital (WACC), market beta, and other relevant capital-structure financial ratios. The impact of current economic conditions on these financing options should also be thoroughly examined.
Context for Company XYZ
Background
Company XYZ, established in 2005, has grown to become a major player in the consumer electronics industry. Known for its innovation and quality, XYZ has consistently delivered cutting-edge products ranging from smartphones to smart home devices. The company has a global presence, with significant market shares in North America, Europe, and Asia. Over the past decade, XYZ has seen steady revenue growth and profitability, driven by its strong brand reputation and continuous investment in research and development.
Current Market Position
In recent years, Company XYZ has maintained its competitive edge through a combination of strategic marketing, customer-centric product development, and operational efficiency. The company’s financial health is robust, with a strong balance sheet, healthy cash reserves, and low debt levels. However, the consumer electronics market is becoming increasingly saturated and competitive, prompting XYZ to seek new growth opportunities outside its traditional domain.
Strategic Vision
Recognizing the need for diversification, Company XYZ’s executive team has identified the exploration of new industries as a key strategic priority. This move is intended to open up new revenue streams and mitigate the risks associated with over-reliance on the consumer electronics market. The choice of industry for expansion will be determined based on thorough research and analysis conducted by the company’s financial management team.
Expansion Initiative
As part of this initiative, you, the financial manager, are tasked with conducting a comprehensive financial management assessment for the chosen industry. This assessment will serve as the foundation for Company XYZ's strategic decision-making process. Your analysis will focus on evaluating the financial structure, expected returns, and exposure to capital market volatility within the selected industry. The evaluation will encompass a thorough review of both equity and debt financing options while considering the prevailing economic conditions.
The goal is to provide detailed insights and recommendations that will guide Company XYZ in determining the viability and potential benefits of expanding into the new industry. Your findings will be crucial in shaping the company’s investment decisions and financing strategies, ensuring a successful entry and sustainable growth in the chosen market.
Solution
1. Task 1: Industry and Economic Landscape
1.1 Present Condition
Currys plc, a consumer electronics retailer based in the UK, is facing significant challenges in a dynamically changing economy. Inflation and other costs of living have slowed spending and hurt the growth of top-line sales. The company has been effecting cost control measures and has shifted emphasis on the electronic business models (Curry, 2023). However, the companies have been able to achieve these even though profit margins continue to be squeezed. Currys maintains its dominant brand personality and repeat customer base but has its fair share of threats from e-tailers. Since being founded in 1981, strategic adaptation is important to maintain the region's position in the market and financial performance.
1.2 New Industry
Currys plc intends to tap into the eager smart home solutions market, as the company is determined to meet the unprecedented consumers' want for connected devices. The new strategic scope is to supply such product categories as smart security systems, energy saving appliances, and home automation systems. Currys aims to implement a full range of services, ranging from the installation of the products it sells to offering customers support through the already well-set-up retail business it has within the consumer electronics industry. This particular decision makes much business sense fits the rapidly changing market environment and ushers the company as a futuristic provider of smart lifestyle solutions.
1.3 Opportunities
Economic conditions explain the fact that the growth of Currys plc into the smart home solutions market is pressing owing to several opportunities. Growing levels of disposable income and government incentives to increase the usage of energy efficient products drive smart appliance sales. Also, the gradual rise in urbanisation rates as well as new decentralisation policies promote home automation (Mortimer Lee, 2023). The growth prospect of the industry fully supports Currys' technological flexibility and reductions in device costs, again relevant to the company's focus on consumer electronics—a successful avenue to diversify revenue streams and bolster market tolerance.
1.4 Synergy
The smart home solutions market is highly saturated and compatible with Curry's existing business focusing on consumer electronics. The insurance products market entry efficiency is increased by the retail outlets, supply chain relations, and focus on tech orientated products of Walmart. Others are the growth in consumer expenditure on home technology, government incentives for energy efficiency in homes, and the reduced price of materials. These indicators relate well with Curry's strengths and can help create additional cross-selling opportunities and build value-added sales by bundling for the assignment help smart home offerings with existing product ranges to retain customers.
1.5 Position Of The Industry In Current Economic Landscape
Smart home solutions have been categorised as an emerging industry in today's economy, eligible for high growth. Increased consumer demand for energy-efficient smart homes is compatible with local and global environmental trends while being supported by governments. Smart devices reach more consumers due to developments in ways of incorporating smart technology in device manufacturing and the subsequent decrease in cost (Shubbar, ET. AL., 2021). Nevertheless, inflation and uncertainty in the economy can slow down impulse consumer purchasing. Still, the long-term outlook remains bright owing to higher population density, a dynamic work-from-home culture, and the need for quick and easy access in contemporary dwellings.
2. Task 2: Company Analysis and Financing Options Assessment
2.1 Chosen Company
Centrica is a British multinational energy services company based in Windsor, Berkshire, United Kingdom. Centrica was established in 1997 and serves through its energy supply division, home services division, and smart home solutions division. It directly owns the Hive brand, which provides smart home goods such as thermostats, lighting, and security (Centrica, 2023). It supplies energy to millions of customers in the UK, Ireland, and North America, with its main objective to deliver new value in energy and to improve customer satisfaction by leveraging digital technologies. Centrica has a clear focus on sustainability and a low-carbon future, accompanied by a clear position in the energy market.
2.2 Financing Option
Regarding sources of financing, it is worth noticing that Centrica plc has several choices for its further expansion and implementation of the strategy.
- Equity financing is the process of selling more shares to investors, and that allows Centrica to finance expansion, acquisitions, or technological projects without raising debt.
- Internal financing utilises corporate funds through retained earnings and operating cash flow to undertake projects to reduce borrowing and achieve a sound financial structure.
- Debt financing is the kind of financing in which the company goes to the financial market to borrow money through bonds or loans for expansion, new infrastructure, or green energy investment. This option can finance business requirements instantly while coming with a reasonable interest repayment period (Fridson and Alvarez, 2022).
- Joint Venture allows Centrica to cooperate with other firms, especially in emerging markets or introduce new products such as smart home technologies or energy sources, including alternatively powered solutions.
- Venture capital could be utilised to make direct investments into exciting next-generation startups or technologies that might dovetail with key Centrica competitive/mgmt priorities such as energy efficiency or smart home systems to ensure cutting-edge future growth/innovation.
2.3 Expected Return
Following this information, the expected return from the investment can be decided using the Net Present Value (NPV) formula. NPV, hence, is a financial tool that is used in the evaluation of a project's profitability with more emphasis on the value of money. In the present case, the NPV is GBP 2,733.15 million, the difference between the projected present value of cash inflows of GBP 7,233.15 million and the cost of investment of GBP 4,500 million.
An NPV is likely to be positive when it means that the investment is expected to create more value than the cost of the investment; hence it may form part of the profit-making plan (Dai et. al., 2022). The cash flows of Centrica plc's investment present a higher expected return than the cost of the investment; thus, the investment is financially feasible since it provides a return rate that is higher than the 10 per cent discount rate used in the analysis. From this, it can therefore be deduced that finances for the project will be healthy over the projected 5-year period.
.png)
Fig 1: NPV
(Source: Appendix)
2.4 WACC
.png)
Fig 2: WACC
(Source: Appendix)
Weighted Average Cost of Capital, is a financial ratio that serves to determine the cost of financing a company through the use of borrowed capital and otherwise through the issuance of equity. Therefore, for Centrica plc, WACC comes to 5.33%. This figure uses the cost of equity, Re, at 9.38%, and the cost of debt, Rd, at 2.16%, and the company's capital structure as a weight. Centrica's equity value stands at GBP 3,877 million (E), and Centrica's debt stands at GBP 4,103 million (D); total capital, E + D, totals GBP 7,980 million. The company uses a tax rate t of 30%, which in turn lessens the effective cost of debt. WACC, on the other hand, is the cost of capital that the company needs to obtain from the investment to satisfy both debt and equity holders of the company. Lower WACC shows better financing costs, which improves the degree of profitability.
2.5 Beta and Capital Asset Pricing Model
.png)
Fig 3: CAPM
(Source: Appendix)
In CAPM, the Beta (B) therefore quantifies the relative variability of a particular stock to the entire market; this means risk. The beta for Centrica plc is at 1.07, which indicates that the business is slightly higher than the market level in that it moves 1.07 times the market. The risk-free rate (Rf) is obtained as 4.24%, which depicts the return on a risk-free asset, and the equity market risk premium (Emrp) is calculated as 4.80%, which depicts the amount of extra return expected by an investor by investing in risky stock rather than a risk-free asset (CAPM, 2023). Thus, the cost of equity of Centrica can be measured with the help of CAPM, with the figures showing a 9.38% expected return of the company about the assessed risk factors.
2.6 Impact of Current Economic Conditions
The prevailing economic environment affects Centrica plc indeed concerning energy prices, effects of inflation, and regulatory developments. Increasing costs for energy that stem from supply chain interferences and geopolitical factors impact directly the company's energy supply service. There is the possibility of a relative increase in sales revenue in the short run since higher prices always lead to a proportional rise in operating costs, most especially in the areas of procurement and distribution. Also, wages and materials can be affected by inflation, which also affects the level of profitability of an organization. Whenever amendments in environmental laws and policies, limitations on the emission of carbon and other materials and imposition of carbon prices lead to higher costs of investments in renewable resources and modification of its infrastructures, capital intensity might increase. However, Centrica's investment in the methods of smart home solutions and energy efficiency could be a source of growth, as the consumers are also concerned about the sustainability of their energy consumption as well as the charges they have to pay for the energy sources they use.
3. Reference
.png)
Coursework
FE7052 International Corporate Finance Coursework Sample
Assignment Instruction
This coursework constitutes 100% of the assessment for this module. Students are required to write a report (3000 words) by completing the coursework questions. Students are encouraged to access company information (e.g., annual report) to conduct independent research and collect data to answer the questions.
Students are required to complete all the questions listed below in their individual report.
Students are required to construct an analysis of a multinational corporation (MNC) covering a period of a minimum of 3 years and a maximum of 10 years. The analysis should address the following questions:
- Provide a historical overview of the selected company;
- Discuss the contemporary monetary environment of the company’s home country (such as monetary history, exchange rate regime, the role of the central bank in the foreign exchange market, and any relevant exchange rate crises), and its effects on the company’s international trade flows with other economies;
- Examine the capital structure of the chosen company and analyse on its cost of capital within the selected timeframe and discuss the implications for the value of the company;
- Track and report on the chosen company’s share/bond price changes (choose one only). Illustrate the risks and returns of the company in the market within the selected timeframe and provide commentary on the future prospects of the company (Tables/Figures/Graphs are expected to be included)
- Evaluate the company’s net working capital and debate whether the company has managed its working capital efficiently, and whether it has positively affected on the company’s value;
- Debate the factors that need to be considered in the process of multinational capital budgeting and investment decisions. Analyse their impact on the multinational corporation’s value
- Provide any additional economic or political insights that could affect the chosen company’s value and its future.
Structure
- Title Page
- Executive Summary
- Table of Contents
- Introduction
- Methodology
- Analysis & Discussion
- Conclusion
- Limitations & Recommendations
- References
Solution
Introduction
This report offers a complete analysis of Apple Inc., including its historical background, financial structure and response to the global economic and political challenges. The analysis starts from the Apple's inception in 1976 and explores turning points in the company’s growth, its dependence on the U.S. monetary environment, and management of capital structure. In this scope, Apple’s share price movement, net working capital management and multinational capital budgeting are explored using data from 2020 to 2024. The report seeks to help explain factors that influence Apple’s financial decisions and strategies, and how Apple retains its market leadership in the face of a changing global environment.
Historical background
Apple Inc. is a company that commenced business in 1976 founded by Steve Jobs, Steve Wozniak, and Ronald Wayne in a garage in Cupertino, California with the aim of creating personal computers (Ahmed, 2023). Apple I was Apple’s first product, it was a simple but revolutionary machine that led to the Apple II in 1977, Apple’s first major product and which established Apple as a leader in the emerging computer industry the assignment helpline Apple went public in 1980 and generated a lot of capital and used that capital for rapid growth and innovation.
In the 1980s Apple released some very notable products, Macintosh being one of them in 1984 (Little and Greene, 2020). This product solidified Apple as a company known for the innovative design first used in the Macintosh which is one of the first mass market personal computers with a graphical user interface (GUI). However, in 1985 it was an internal power struggle that saw Jobs depart from the company. There were then issues with leadership, wildly inconsistent product launches and declining market share for Apple over the following years. During this period, Apple also released a product, like the Newton PDA, which was a failure for the company, but showed a willingness to try new things in technology, in an effort to catch up with competitors like Microsoft.
Apple’s turning point was 1997 when Jobs returned as CEO and reimagined Apple’s product strategy around a much leaner approach. In his tenure, Apple introduced a string of iconic products in the 2000s: iMac, iPod, iPhone and iPad. When Apple introduced the iPhone in 2007, the tech industry began to revolve around the iPhone and was ushered into the era of Apple consumer electronics. This helps the company build a strong global brand and financial success based on ecosystem integration, high quality design, and user-friendly interfaces.
Currently, Apple remains the industry leader in technology and has expanded to services and wearables, with consistent dedication to innovation, quality and prioritisation of user experience. It is still one of the world’s most valuable companies, a symbol of cutting-edge technology and design excellence.
Contemporary Monetary Environment of the Home Country
Apple has a very strong dependence on the US monetary environment especially the Federal Reserve policies as a major determinant of both the cost and operation of Apple’s business across the world. Interest rate as a policy instrument under the Federal Reserve impacts on the capital structure of Apple since the firm balance sheet has tended towards a greater debt-equity ratio in the recent past. Apple has created an environment where all the companies in the Apple environment are able to generate revenues and be profitable. So, when Apple creates wealth, they do not only spend more on research and development to produce even better products that consumers enjoy but also take better care of their employees and suppliers for this every firm wants to be associated with Apple supply chain (Yifu and Wang, 2022). But the rising rates of interests have raised the cost of borrowing hence affecting the ability of Apple to use debt as it has been used in the past. Sustaining the balance on the capital structure will therefore be essential for Apple to continue on its innovation investments and therefore, debt management strategy will be imperative.
The stability of the U.S dollar as well as the moderate movement of currency by the Federal reserve is also propitious to Apple since most of its sales are in foreign countries. Since Apple generates the majority of its revenues in dollars, every time the dollar rises, as it is the case currently, global sales in other currencies are worth less and this puts pressure on the company’s gross margins. In 1994, Apple had a net profit of US $390 million from overseas markets and US $310 million from its local market (Rao, 2021). The Federal Reserve intervenes occasionally in foreign exchange markets for this purpose and aids Apple in part by diminishing some of the fluctuation caused by currency exchange rates; nevertheless, currency exchange rates remain a risk that Apple continuously seeks to hedge.
Inflation is another problem in the present monetary environment prevalent in the United States that is directly and indirectly impacting Apple. The latest inflation fright has raised expenses for inventory, transportation, and manufacturing throughout Apple’s value chain. Despite the fact that in the past Apple has been able to fully or partially transfer some costs to consumers given its popularity and brand awareness, the constantly high inflation rate in the U.S and other countries may constrain this capability without a negative impact on consumer sales. Furthermore, since Inflation should recognise that several founders and some Supreme Court judges regarded the concept of unbacked paper currency unfavourably (Yahya, 2022). To deal with this, Apple regularly reviews its supplier relationships and procurement mixes while at other times may even switch to lower-price countries to counter cost increases.
Monetary policy being tight in a bid to tame inflation has more ramifications to consumer’s buying capacity especially where inflation is high like in US. Monetary policy has not only resulted in increased wealth and greater wealth disparity but has also led to elevated consumer price inflation through the wealth effect on consumption demand (Ferguson and Storm, 2023). However, it is worth remembering that Apple has always been a company that produces high quality goods and has numerous loyal customers, which is why it has survived similar situations before.
Capital Structure in the Cost of Capital
Apple’s approach to capital structure indicates that it maintains a nice blend of debt and equity over the recent period. From the data obtained from 2021 to 2024, there is an evident show that the company has a higher leveraged position, specifically, a higher debt to equity ratio that Apple prefers to use debt to finance the company. The debt equity ratio, which was at its highest at 195.3 percent in 2022, slightly declining at 153.3 percent in 2024. This capital structure may be due to Apple preferred reducing shareholders’ dilution via low-interest debts for the funding of operations, acquisitions and share repurchases as Trade-off Theory dictates. In this theory, the company aims at maximising the advantage of interest tax deductibility while minimising the cost of financial distress that exists in Apple as a result of its efficient cash flows as well as high profitability (Wang, 2023).
.png)
The percentage of Debt and Equity again unfolds the financial model of Apple Inc. Debt was the most given attention between 2020 and 2023, with an average of 60 – 66% of capital structure, while equity which was equally important was 33.9% – 39.9% (Apple Inc., 2024). It also in indication to approach of Apple in terms of its use of debt to enhance the Shareholder Value and the firm’s Weighted Average Cost of Capital (WACC). Thus, seeing that Apple’s weighted average cost of capital is at 5.8% and where the after-tax cost of debt stands at 2.98% Apple has optimised on the cost of capital but at the same time creating room for significant investment in its innovation and market development. The fact that the cost of debt is lower than cost of equity confirm that Apple reaps a lot of benefits from debt leveraging. Here
The cost of equity financing is estimated at 10.17%.
The case of Apple shows that the changes in capital structure have also coincided with the changes in this cost over the period (Gugler, Szücs & Wohak, 2023). Thus, as long as debt has remained a large part of the capital structure, Apple’s WACC remains relatively low, indicating sound working of the value of the agency model. This focus on a low WACC is consistent with the Pecking Order Theory which postulates that firms have a strategic preference to reliance on internal funds and debt, and external sources of equity only if internal sources are inadequate. The idea of capital cost with the focus placed on Apple’s financial strategy-based shows that the corporate goal is to reduce capital costs while creating a locked-in insolvency condition. Such wise use of debts, coupled with the strong earnings and cash flow of Apple inflicts the evidence of an appropriate capital structure that envisages continuing growth effectively supporting shareholder value. By carefully managing its capital structure, Apple has ensured its cost of capital for funding its strategic plan in an economic liberal scneario (Rhee, 2023).
Share Price Movement for Apple and its Market Analysis
Seasonal fluctuations evident from the above graph of Apple Company share price in the last five fiscal years reveal that shares are sensitive to both company performance as well as the overall market status. From the analyses made for the period between 2020 and 2024, Apple’s average recoveries are between 63% and 76.9% in the years that formed the basis of the revenue calculation. This phenomenal growth is consistent with the general market rebound after the first period of COVID-19 pandemic, when many technology stocks, particularly those related to tech-enabled products and work from home solutions, boomed. Using our wide range of products, and growing ecosystem, Apple was targeting large market share, and creating shareholder returns; better than the S&P 100’s 32 percent for that year.
.png)
Figure 1Annual performance
Source: Self-Created
In 2021 Apple rose up nearly 30% to trump the S&P 100 average return of 21% Y/Y 2021. This performance clearly pointed to the fact of the company’s strength and its innovation-based growth model which was evident in the consumer demand of the company’s products and or services such as introducing new products into the market or new software versions among others. The market conditions currently are quite good: low interest rates enable buying stocks with the help of borrowed funds, preferences for investments in tech shares. Indeed, the ability to sustain high returns in this environment made investors endorse Apple while confirming its market superiority in the new technologies sector (Uwihirwe and Bazimya, 2022).
But as we move into these years, 2022 could have been Apple’s year of loss since its annual return was at -8.8% and far from its previous results. This decline was aggravated by specific market conditions such as developments like; increasing interest rates, inflation fears, or disruptions of some major supply lines which bogged down the technology industry. While the S&P 100 posted a 29% gain that year, Apple business limitations, elevated manufacturing costs and rather weak consumer electronics sales were in evidence. Nonetheless, from an Apple perspective, the fundamentals of the business remained sound and would simply need to wait for the right environment to turn things around, or right the ship, again (Simic and Jovicic, 2023).
Apple successfully returned 24.5% for the fiscal year ended 2023 and outperforms S&P 100 that had a negative rate of return of 21% mainly because of persistent economic instability and fluctuation in the stock market. This is evident by Apple’s strong financial performance during this period with effective cost control, appropriate product positioning and diversified source of revenue as a way of managing risks that afflicted other businesses and portraying investor confidence. This resilience goes well with Apple’s other characteristics of being a stable investment with low beta of 1.24 than the market.
Evaluation of the Net Working Capital Management for Apple
An analysis of the working capital cycle of Apple Company for the past four years shows a working capital management that is proactive to reduce the holding of non–current assets and at the same time enhancing liquidity. From 2021 to 2024, the current assets have increased from $ 134,836 million to $ 152,987 million in total due to the on-going investment in inventory and receivables (Apple Inc., 2024). However, current liabilities recorded a steeper growth, which stood at $125,481m in 2021 and projected to be $176,392m in 2024; with the growth rate of 22.7% in 2022 and 21.4% in 2024. The increase in liabilities beyond a corresponding increase in assets had a negative effect on the current ratio and volatile net working capital.
.png)
Figure 2 Working capital
Source: Self-created
This liquidity trend is reflected in Apple’s current ratio where figures have scaled down from 1.07 in 2021 to a projected; 0.87 in 2024. Last year the ratio reduced to 0.88, which implies that current liabilities were more than the current assets implying that Acme may have a constraint in its short term-liquidity. While it multiplied a little in the year 2023 for some reason, the ratio is back down in the year 2024. This current ratio variability shows that Apple implemented a risky working capital management level, which corresponds with the working capital principle of not locking capital in assets to finance even more profitable or high return activities (Kiymaz Haque and Choudhury, 2024).
In line with this interpretation, the net working capital figure more overshadows this by declining from $9,355 million in 2021 to negative territory by 2024 at -$23,405 million. This shift showed that Apple commonly use current liabilities to fund short-term activities to avoid to taint its cash flow toward longer-term investments with more attractive returns, for instance, on research and developmental costs or expenses on plant and machinery.
Apple strategy is in accord with the concept known as the Aggressive Working Capital Management Theory where companies work towards optimising return by minimising working capital needs while holding lower liquidity buffers. This approach however is relatively risky, hence complements Apple’s strong cash flow profile and high profitability, which affords the company sufficient flotation to mitigate for liquidity risks (JOY, 2021).
Key Contemplations in Multinational Capital Budgeting
In multinational capital budgeting, several factors of core importance to sustaining and growing corporate value confront Apple. The first area is exchanging rate risk, which poses a major threat to its international business because changes in the rates can hugely impact the earnings. To reverse this, Apple has over the years engage in hedging to counter this risk as it seeks to balance its cash flows across its operations in different countries while also seeking to shield its earnings from volatility from the foreign exchange market.
Apple's main strength resides in the manufacture of remarkable goods that appeal to consumers (Cai and Chen, 2024). The capital allocation decisions in Apple are affected by the various tax systems since some countries impose better tax treatments. For example, the tax differential has been used by the Apple to maximise after-tax returns, increasing the general returns on global investment. Corporate tax planning is still paramount for Apple to decrease on its tax liability around the globe as it complies with the dynamic changes in taxation laws especially in the regions that are changing their tax laws concerning international income.
Other sources of risk for Apple include market fluctuations and uncertain regulatory environment which are always considered when preparing budget. In order to invest initially, Monetary independence is impacted by a myriad of factors, including monetary policy, inflation rates, and financial laws (Ali et al., 2023). Challenges including restrictions to data privacy, technology exports, and environmental measures in places like the EU not only add a cost hurdle to Apple’s operations but also restrict its operations flexibility.
Additional Economic or Political Insights
Apple currently exists in a broad external environment with strong economic and political forces that play a crucial role in determining the strategic directions and organisational outcomes of the firm. Of course, one of the most pressing concerns is the trade conflict that is still happening between the USA and China today. Since apple relied heavily on manufacturers in China, tariffs and restrictions make production expensive and thereby may cause a rise in the company’s selling price to customers. In the context of the new great power rivalry, the US-China trade war, the COVID-19 pandemic, labor and transport costs, and sustainability pressure, the restoration of manufacturing capabilities has begun to receive more public attention, with the news media focusing more attention on stories of American companies bringing production back in-house.
Home (Zeng and Zhang, 2024). It also has competition between the U.S and China in the geopolitical front as a challenge. For instance, the U.S has gradually restricted the sale of high-tech components like semiconductor chips to China. Thus, these restrictions may limit its production or force it put into other suppliers, eventually, lead to the fact that it will become more expensive for Apple to produce something with high-technology components such as iPhones and MacBooks to mention but a few.
Legal forces in the operation of Apple business in the European Union include data privacy regulation, antitrust, and environmentalism. GDPR for example imposes strict data protection laws on Apple, hence the need to spend a lot of money in data protection and making sure all its services align with what is offered in Europe. Legal requirements that are environmental also force Apple to embrace sustainable management of its supply chain and products.
Conclusion
The analysis demonstrates Apple Inc’s strategic resiliency to innovative, while securing financial stability amidst the ever-varying market and geopolitical conditions. The key findings reveal how Apple has used debt leverage, responded to monetary policies and hedged against currency risks to continue its growth and market position. Despite the pressures of inflation, interest rate increases and regulatory constraints, Apple's capital structure and market driven strategies allow Apple to continue to create shareholder value and maintain competitive advantage. Finally, overall Apple’s ability to adapt to new markets, its continuing focus on high quality, and high-quality oriented products reaffirm Apple as the industry leader in a fast-changing global environment.
Limitations and recommendations
Limitations of this report include reliance on secondary sources of data, which may not adequately capture real time shifts or specific Apple strategies, and fixed period analysis which may not adequately capture long term trends. In addition, finer segment based financial data could further enhance the accuracy of profitability assessment of Apple’s product lines. Based on Apple’s ongoing AI and environmental sustainability expansion work, future research should also consider how this will shape Apple’s financial and operational strategies. Continuous investment in sustainable practices as well as improving the global supply chain resilience and close monitoring of regulatory changes in the U.S., the EU and China are recommended actions.
References
.png)
.png)
Research
MCR006 Financial Management Research Report 2 Sample
This assessment consists of one part a research-based topic.
Part A 40 marks weight 20%
Students will be required to research the topic relating to the concept of the definition and application of the CAPM (Capital Asset Pricing Model) model. Explain the concept of the Capital Asset pricing Model (CAPM) and how it is utilised to determine the required return on a share. Explain why Beta is important and how it is calculated.
Required
a) The paper should include information about how CAPM is calculated and how it is applied and interpreted. One to one and a half(11⁄2) pages. Students should research and provide a minimum of 3 referneces.20 marks
b) A final requirement is to calculate the three-year Beta for a publicly listed company from those companies listed on the ASX. 20 marks
c) Students can use an excel spreadsheet to calculate an provide detail in the report using a snapshot into the word document and provide a brief explanation of the company and a brief interpretation of your calculation. (Half page for calculation and half page for brief description of company and interpretation).
Solution
1. Introduction
CAPM or Capital Asset Pricing Model represents the type of financial model that is used by corporate finance for describing the relationship of security risks and the market. “Investment bankers” use it for analyzing individual stocks and portfolios. In this study, the application and concept of CAPM is being calculated. For Assignment Help, The three-year Beta of IBM Technology Corporation for 2021, 2022 and 2023 is being calculated. The required return on share is being calculated and the interpretation and calculation of CAPM is evaluated.
2. Application and Concept of CAPM
CAPM helps in calculating the expected rate of return from investments that is used for determining the prices of individual securities like stocks. As an important part of “corporate finance” and “investment banking”, CAPM looks at the relationships between the riskiness of the investment and the inherent risk of the market at large. The “Capital Asset Pricing Model” is considered a “theoretical pillar” in “modern finance” (Andrei et al., 2021).
.png)
Figure 1: Capital Asset Pricing Model
(Source: Wallstreetprep, 2023)
CAPM models help in describing the relationship between the risk of investing and the expected return on security. It helps in showing that the “expected Return on security” is considered equal to the “risk-free return” plus a premium that is based on a “beta of the security”. CAPM helps in creating an idealized portrayal of the financial markets regarding price securities and determining the “expected return on capital investments”. It provides a methodology for translating quantifying the risk to estimates of expected return on Equity. Capital Asset Pricing Model is one of the most used asset pricing models in modern securities theory (Latunde et al., 2020).CAPM helps in evaluating the fair value of the stock when the risk changes and other factors in the market make the investment riskier. CAPM provides a way for estimating the “required return” required. Modern CAPM models are considered the first equilibrium models for the “pricing of financial assets” and the “first asset pricing models” for maximizing investors' utility under various conditions (Chen et al., 2021). Investors tend to implement their “investment decisions” for building “efficient portfolios” in the case of a "mean-variance framework” (Ayub et al., 2020).
3. Three-year Beta of IBM
.png)
Figure 2: Three-year Beta Chart of IBM
(Source: Self-created)
Beta is considered the measure of a volatile and systematic “risk portfolio” in comparison to the market as a whole which is used for evaluating “capital assets”. The “Beta Capital Asset pricing model” helps describe the relationship of the “expected return” and “systematic risk”. It is used as a method for pricing “risky securities” and for “generating estimates” of the “expected return of assets” by considering both the “risk of the assets” and the “cost of capital”. The “three-year Beta” of IBM for the years 2021, 2022 and 2020 came at -.42. As the Beta turned out to be negative, it implies that the stock price of IBM moved in the market opposite direction. It indicates an inverse relation to the market.
4. Evaluating Required Return on Share
For calculating the required rate of return it is important to subtract the “risk-free rate of return” from the “market rate of return”. The CAPM model helps in providing useful outcomes for the required stock returns. For calculating the expected return on an Asset it is required to utilize the CAPM formula: “Expected Return=Risk free rate+ volatility/beta*(market return-risk free rate”. For calculating the “cost of Equity” using the CAPM formula the rate of return a company will pay to its equity investors. For the companies that pay dividends, the dividend capitalization model can be used for calculating the “cost of Equity”. CAPM metric helps in calculating other financial metrics. It is being used for calculating the expected return in comparison total cost of capital and the risk of assets. CAPM requires the “rate of return” on the general markets, the “beta value” on the stock known as the “market risk premium”. Ways to predict the “expected return on share” is to compute the “mean of share prices” (Liew, 2020). The “beta of the share” helps in describing the relation of the returns with that of the financial market and the volatility provided as a measure which will help in providing an idea of how far the stock will fall.
5. CAPM calculation and interpretation
CAPM formula is: “Expected Return on Investments”=”the risk-free rate the beta (or risk) of the investment”*the “expected return on the market” –“risk-free rate”. For calculating the CAPM Beta, it is required to subtract the “expected market return” from the “expected investment return” which is the dividend as the result of “market return minus the risk returns”. In the case of CAPM interpretation, the returns that are related to the security with a Beta of 1.0 will help in exhibiting returns in line with the broader market. A higher Beta implies Greater potential returns and risks. The company with the highest potential returns process the highest Beta.
The “overvaluation” and “undervaluation” of CAPM is a critical concept. If the rate of return is considered, more than the “expected return” then it will be considered as an “overvalued security”. If the “rate of return” is considered less than the “expected return”, it will be regarded as an “undervalued security”. CAPM formula will help in evaluating the share value when the risk and time value of the money are being evaluated in comparison to the expected return. An important aspect of CAPM denotes the concept of “undervalued and overvalued securities” as the “rate of return” is considered greater than the “expected return” which will be considered as an “overvalued security”.
6. Conclusion
CAPM plays an important role in evaluating whether the stock is valued or not when the “time value” and “risk” of the money are being compared. With the “expected return”, it is possible to evaluate whether the “current price” of the stock is found to be accordant with the “likely return”. CAPM helps in estimating the return on capital investments. The “three-year Beta” of IBM came at the negatives while implying the price movements are against the market trend.
7. Reference List
.png)
Reports
FNCE623 Capital Budgeting Assignment Report 1 Sample
The case is open ending. The way you collect data may affect the results. You must collect or estimate the related data if you can’t find them in the question.
THE ASSIGNMENT MUST BE DONE INDIVIDUALLY. ANY ACADEMIC INTEGRITY
ISSUES WILL BE REPORTED TO ACADEMIC OFFICE.
Vita Smart Ltd is a leading high-tech company which is incorporated in Surrey, BC. The company wants to add a lab equipment in Dec 2023. They hired you, a UCW graduate, to prepare a capital budgeting plan for the project. Do you recommend the company to accept the project or not?
Below is the information that your manager provided:
1. The approximate cost of the machine would be $210,000, with another $10,500 in shipping and handling charges. It would also cost an additional $2,0500 to install the equipment and $500 tuning fee.
2. The equipment would be set up in an unused space at the company’s main plant. The plant space could be leased out to another lab for $11,000 per year.
3. The machinery has an economic life of 5 years, but the manager didn’t know the CCA classification and CCA rate. He estimated that the machinery is expected to have a salvage value of $18,000 after 4 years of use.
4. The new product line would generate incremental sales of 1,350 units per year for 4 years and they are expected to grow 5% per year.
5. The variable cost per unit is estimated in $50 per unit in the first year. Each unit can be sold for $210 in the first year.
6. The sales price and cost are both expected to increase due to inflation. The fixed costs are estimated to be $90,000 per year and would increase with inflation. The manager ask you to do the research about the inflation rate in recent years.
7. The company hired 3 workers to operate the new equipment and provided them 100 hours paid training according to BC minimum wage. They will work on the production line 35 hours per week under a four year contract with a 15 working days paid leave. The manager estimated the inventory level will increase 5% of the total sales every year due to expansion. The accounting teams said the new project won’t affect A/R and A/P accounts in the future 4 years.
8. The company received $25,000 Research fund from BC government and decided to use 20% of them to do a market research on the new project.
9. The manager has concerns about the potential effects on other products when introducing the
new equipment. Currently, he estimated a 2.5% decrease in sales revenue.
10. The firm is a small business which taxable revenue under $300,000. The project is considered by the financial department to be as risky as the company. The financial department has estimate that the total WACC is 12% including $8,000 interest paid every year.
Requirements
Part I: Project analysis. Total 85 marks. Q1: 8 marks, Q2-Q12, 7 marks.
Write 4 or more complete sentences for each question in a Word file. Do not write in an essay format.
References are not necessary unless the questions require. No word limitation in this part.
1. State the steps and process of Capital Budgeting.
2. What are the principles in determining incremental cash flows?
3. What’s the definition of sunk cost? Which cash flow(s) is the sunk cost in the case and why?
4. What’s the definition of opportunity cost? Which cash flow(s) is the opportunity cost in the case and why?
5. What’s the definition of externality? Which cash flow(s) is the externality in the case? Are they positive or negative?
6. What’s definition of NOWC? Which cash flow(s) reflect the change of NOWC in the case?
7. What’s CCA in Canadian accounting practice. Estimate the CCA class of the asset in the case and explain.
8. What are CCA claim methods according to CRA guidance?
9. Why is the interest included in the cash flow estimation? What’s the current interest rate of business loan in BC now? Include reference website(s) where you obtain the data.
10. Is wage a direct cost or an indirect cost? How mush is the minimum wage in BC currently?
Include reference website(s) where you obtain the data.
11. Why is tax shield important in a business operation? How much is business tax rate in BC and Federal? Include reference website(s) where you obtain the data.
12. Will inflation be included in cash flow estimation? What’s most recent inflation rate in Canada?
Include reference website(s) where you obtain the data.
Part II: Project Evaluation. (Total 15 marks)
Using an Excel spreadsheet:
• Find the NPV of the project by using the pro forma financial statement method to determine cash flows.
• Set up the necessary equations by referencing to the input variable cells. The spreadsheet must be formula driven; do not put any numbers in equations, must use cell references.
• Use Excel’s built-in functions wherever possible
Present this assignment in a professional way. It is your responsibility to communicate clearly to the marker.
Solution
Part 1:
1. Steps of capital budgeting
The steps of capital budgeting will include a thorough analysis of the business and how it is going to conduct the business operations over the period. For Assignment Help, Here, for the capital budgeting purpose, the chronological steps should be taken into consideration in the ascending order:
1. Idea generation
2. Proportional for the project where the formal understanding of the potential risk will be identified.
3. Estimation of cash flow: in the cash flow estimation, the overall project analysis will be done. This is because, the effectiveness and the efficiency of the cash flow assumptions will help the organization to improve the company's financial performance.
4. Project evaluation: In this segment, the application of the capital budgeting tools, such as the net present value analysis, internal rate of return, payback period and others, will be calculated, The analysis will provide a detailed understanding of the profitability and another solvency related aspect of the investment.
5. Project selection and ranking: based on the outcomes of the project evaluation process, if the company is considering multiple opportunities, then it will rank the project depending on the profitability and another aspect, which will help the company to select the best and most preferred option.
2. The principles of determining the incremental cash flow:
Determining the incremental cash flows provides a critical step in the capital budgeting process. It involves the identification of the cash flows, which are directly related to any particular investment project because of the additional inclusion in operations. The implementation of the revenue will help the organization to understand how efficiently the project can do and add profit to the shareholder's value.
The principles of determining the incremental cash flows for the business are discussed
1. Relevance: the first preference for determining the incremental cash flow will include the relevance, which will consider that only the relevant income and expenses should be included for the evaluation purpose. Hence, the sunk cost should be eliminated.
2. Time horizon: One of the basic aspects for determining the incremental cash flow will include the time horizon determination, which is the defined period at which the company can generate the incremental cash flow out of the business.
3. Differential principle: The differential principle will include the incremental cash flows directly related to a particular project and not being generated in response to any other project.
4. Opportunity cost: For the incremental cash flow generation, if the company sacrifices their existing revenue or substitutes the use of any particular asset that is used for a different purpose then it will be considered as an opportunity cost, and it should be considered as an expense.
5. Externalities: the externalities will record the side effects of the project, which will impact the performance of the already existing businesses or product sales. Certain externalities will have a positive or negative impact depending on the positioning of the business.
6. Taxes: the taxes are the incremental aspect of revenue, and they should be accounted for by determining the value of incremental cash flow.
7. Working capital movement: The movement in the working capital requirement for the business will be considered an essential aspect of the incremental cash flow.
8. Terminal value: The terminal value will be considered as the amount of cash flow generated or spent on the closure of the proposed investment.
3. Definition of sunk cost and which cash flows should be considered as sunk cost for Vita Smart Ltd.
Definition
The sunk cost can be considered as the expense that is already incurred, and it will not be recovered.
cash flow, which should be considered as sunk cost
Here, the market research cost is taken from the grant for $5000. It is considered as the sunk cost because it has no relation with the acceptance or rejection of the project.
4. Definition of opportunity cost: cash flow that should be considered the opportunity cost for Vita Smart Ltd.
Opportunity cost
The opportunity cost can be considered as the expense for forgiving any opportunity to generate any alternative income because of the selection of any particular project. For the instrumental cash flow calculation, the opportunity cost should be considered as an expense for the business as the company is forgiving the chances of generating an alternative revenue because of the new investment.
Opportunity cost for the project:
In the given case scenario, the leasing of the land will be considered as the opportunity cost. This is because, the company was the opportunity to lease the place for $11000 per year.
5. Definition of externality, which cash flows should be considered externality and the given case scenario and the assessment of their positive and negative aspects.
Definition of externality
For the incremental cash, the determination of any project's externalities suggests a particular project's impact on other project revenue. There will be positive or negative externalities because of the particular project. Suppose any particular project is increasing the revenue of the alternative products available for the business. In that case, it will be considered a positive externality. On the contrary, if the project minimizes the sales revenue of other projects, then it will be considered as an negative externality.
Externalities for the proposed plan
Based on the calculation and the information provided by the company, the decrease in the revenue by 2.5% will be considered as the externalities for the business, and it will be considered as the negative externality. Here, the case study is silent about the sales revenue for the alternative project. Therefore, the current forecast of its sales is considered as the basis of the decrease in revenue for the other projects.
6. Definition of NOWC, cash flow indicating the NOWC:
Definition:
NOWS stands for the net operating working capital for the business. It is an expense, which will be employed in the accounts that are receivable and inventory and the accounts that are payables will partially finance it. In most of the cases, it is assumed that the entire working capital invested into the business will be recovered at the terminal period.
NOWC for the company
In the given case scenario, because of the increase in revenue, the working capital requirement for the business is increased by 5% every financial year as compared to the previous financial year's working capital requirement.
7. CCA in Canadian accounting practice, and the estimation of the class of assets in accordance with CCA:
The term CCA, in accordance with Canadian accounting practices, will be considered as the capital cost allowance, which is available for deduction in taxation purposes. It is an expense of the business for the capital expenses made by the organization. Here, CCA has been classified into different kinds of classes of assets.
Class of asset as defined with a specific rate of capital and available for the financial year:
Determination of the class of asset:
Based on the information available for the asset, it will be a class 8 asset, which includes specific property that is not included in another class of asset, like furniture and appliances and costing more than $500. The applicable cca for the "class 8" assets is 20%.
8. the CCA claim methods in accordance with the CRA guidance:
In accordance with the CRA guidelines, the organization can use the capital cost allowance in the following method
- Straight line method: Under the straight line method, the company will be getting the same amount of capital cost allowance, which can be calculated by deducting the salvage value from the cost of acquisition and it will be divided by the period or the life of the asset.
- Diminishing balance method: Under the diminishing balance method, the company will use the undepreciated capital cost multiplied by the diminishing balance rate.
- Double declining balance method: Under the double declining balance method, the company will use the double depreciation of the straight-line method as the initial percentage for getting the maximum depreciation in the initial years.
In order to claim the capital cost allowance in accordance with the Canadian income tax rules, the depreciation can be claimed by using the form t2125, which is the statement of the business and professional activities. At first, the company will require to identify the class of asset and the depreciation rate for the same as it to claim the capital cost allowance (www.canada.ca, 2023).
9. The interest included in the cash flow estimation and the current interest rate of the business loan in BC:
The interest expenses should be included in the cash flow estimation because it is an integral part of the cash outflow, which is relevant for a particular project itself. For instance, if the organization has included debt financing for the capital resourcing of the particular project, then it will be required to pay for the interest expenses, which will be specific to this project itself, and it will make a significant cash outflow out of the business. Hence the interest expense should be included in the cash flow consideration.
However, if the management applies the wacc as the discounting rate, then, the company is considering the cost of debt financing account as the way to average the cost of capital, including the weight of debt capital. Hence, the company is automatically considering the cost of interest for the project discounting purpose. However, if the company is not using the average cost of capital, then in such a case, the company will be required to include the interest expenses as an expense in the cash flow estimation.
The interest rate in British Columbia
The average interest for British Columbia is almost 5.25% for small-scale organizations. However, the interest will depend upon the liquidity position and other aspects of the business (tradingeconomics.com, 2023).
10. Assessment of the wage's expenses, determination of the minimum wages in BC
Assessment of the wage expenses
The wages can be direct and indirect depending on the nature of expenses. In the given case scenario, each employee worked a hundred 1835 hours over the period, which includes 35 hours of weekly working along with 15 days of week off, which is the total payment for 2345 hours. The wage expenses in the case study are a direct expense because these wages are paid for operating production equipment.
The correct minimum wage rate in British Columbia is $16.75 (news.gov.bc.ca, 2023).
At the same time, here and in many cases, the wages can consider as indirect costs if the wages costs are not associated with the production.
11. Importance of tax shield for the business operation and determination of the business tax rate in BC:
The tax shield can be considered as the items for which the company can get the deduction for taxation purposes. Because of those expenses, the company's tax liability will be reduced. However, for sure, it is like depreciation. The tax shield will minimize the tax expenses for the business, and there will be no cash flow for the same.
In accordance with the small business organization, the applicable business tax rate in British Columbia is 9% only (www.canada.ca, 2023).
12. Inclusion of the inflation in the cash flow estimation and the most recent inflation rate in Canada
Inflation is an integral part of the cash flow estimation because it will impact the cash generation process because of the general increase in the prices for the product. Therefore, the inflation should be adjusted with all expenses like the increase in revenue order product prices, direct material expenses, overhead expenses and others.
Considering the recent year inflation trend, it is identified that in recent financial years, inflation has increased by a significant portion because of global volatility. However, it will not exist in the future. Hence, for a better understanding of the situation, the 5-year average inflation, which is 3.27%, is considered (ycharts.com, 2023).
Part 2: project evaluation
Finding the net present value (NPV):
For the investment analysis purpose, the net present value will be used where the project cash flows will be discounted by the cost of capital, which is 12%. Suppose the present value of the future cash inflow is more than the cash outflow at the present value. In that case, the project can be considered for investment purposes because then it will serve the minimum required rate of return to the investor (pienaar, 2021). Based on the calculation, it is identified that the project identified by Vita Smart Limited cannot be selected because it is generating a negative net present value of $229120.04.
Reference
.png)
Reports
FINM4100 Analytics in Accounting, Finance and Economics Report 2 Sample
Your Task
• Create a report on Blockchain in the context of Fintech and RegTech.
• This task is to be done as an individual.
.png)
Assessment Description
Learning Outcomes: LO2, LO4 and LO5
Background: Blockchain is an emerging technology of great importance in Finance, Economics and Accounting. It impacts the way we deal with and monitor financial transactions, trade, identify ourselves, and is having an impact on auditing and regulation.
Imagine that you are a compliance manager in a financial institution. Your company wants to use blockchain for three purposes
1. As a mechanism for secure digital transactions and smart contracts
2. As a way of managing digital identities
3. To offer clients the chance to invest in cryptocurrencies however, the executives are not sure of all of the benefits of these applications or possible ethical, legal and privacy issues.
You are to explain what blockchain is, explain these uses (applications) and how it will benefit yourself and the company auditors in a report, as outlined below.
Assessment Instructions
Do your initial research from the workshops then find relevant articles on the internet to support your statements. You are to write a report as follows:
A. Introduce the idea of blockchain and its applications in general.
B. Briefly explain the applications that we are focussing on here (1,2 & 3 above, i.e. secure
digital transactions and smart contracts, digital IDs and investment in cryptocurrencies).
C. There have been dramatic fluctuations in cryptocurrency prices with current values a fraction of what they were 12 months ago. What are your views on the future of cryptocurrencies?
What are their pros and cons?
D. Describe the benefit blockchain can offer auditors and compliance officers and subsequent
positive impact on the organisation.
E. Assess possible ethical and privacy implications of the applications at the financial institution at which you are imagining that you work. The impact could be on staff and/or customers.
F. Use at least ten relevant references and the Harvard referencing style. References must be
relevant to what you are discussing in each paragraph.
G. Taking care with your report structure and novel written presentation.
Solution
A. Blockchain: A Brief Introduction
In recent years, Blockchain technology has become a massive interest among business organizations, government enterprises, and academics. Blockchain has the capability to provide transparent, secured, and tamper-proof solutions to stakeholders. Blockchain is considered the digital ledger of a particular transaction that is copied and distributed across the various network in a computer system. After every transaction, each of the blocks holds various information that gets updated in the participants' ledger. An entry, once made using blockchain technology, cannot be changed. Everyone who participates in the chain of transactions plays a vital role in the network.
In specific terms, blockchain is a distributed database that can be accessed by everyone. This means every individual can get a copy of a new record that is entered into a database, but no individual can make any changes to the data once it has been recorded in the system.
Application of Blockchain in General
Some applications of blockchain are:
• Cryptocurrency- cryptocurrency is a digital currency that is designed to be a medium of exchange wherein every coin ownership is recorded in the decentralized ledger. As cryptocurrencies make use of 'decentralized control', they are not controlled by any individual person or the government. Blockchain technology is popularly used in cryptocurrency, where all the transaction information is stored, which is not possible to hack or change. Every person can buy, sell or deal in cryptocurrency and be a part of this network.
• Cars- Blockchain technology provides a secure and digital certificate for every car. Odometer fraud is very popular, where a dealer can tamper with the odometer and make a car appear to be a newer and less worn-out car. Thus, the customer ends up paying a huge amount of money than the actual worth of the car. Using blockchain technology, the regular odometer can be replaced with modern ones that are directly connected to the internet and can write the mileage of the car to the blockchain.
• Legal Documents- to keep a good track of data over a longer period, blockchain technology is preferably suitable. Using this technology, legal documents like intellectual property, patents, and even notaries can be secured.
• Digital Voting- Currently, voting is conducted through EVM (electronic voting machine), which are special computers that run based on proprietary software. "EVM hack" can be a major problem that can disrupt the election. Therefore, blockchain technology can be used to cast votes as it is not possible to tamper with data that are recorded in blockchain technology.
B. Application of Blockchain in Specific Tasks
Secure digital transactions and smart contracts
Smart contracts are programs that are stored on a blockchain that starts running when the predetermined conditions are met. Smart contracts are mainly used to automate the execution of a particular agreement so that every participant can come up with a certain outcome without any involvement of an intermediary that can cause time loss. When a particular transaction is completed, the blockchain has updated the parties who have granted permission can check on the results (Javaid, 2022).
Blockchain as a way of managing digital identity
Blockchain is a highly trusted mechanism that can even manage digital identities. Using blockchain technology, users get the power to have better control over their own digital identity. Blockchain puts control over individuals' personal data rather than making the data public or sharing the information with industry giants. As a result, it ensures all digital data are secured and easily traceable (Ku-Mahamud et al., 2019).
Chance to invest in cryptocurrency
Cryptocurrencies are the major part of blockchain technology that was mainly designed to transfer value. Most investors use this technology to store values as the technology is highly protective, and data cannot be tampered with easily. The data are end-to-encrypted, and investors hold them for growth.
C. Fluctuation in the price of cryptocurrency
There are different kinds of cryptocurrencies that are available in the market. Some of the popular ones include Bitcoin BTC, Ethereum ETH, Tether USDT, and USD Coin USDC. Currently, the price of Bitcoin BTC is 17,392.88, whereas the price 12 months back was $48,187.22.
The fluctuations in the overall cryptocurrency are due to the poor macroeconomic conditions and the recent bankruptcies in the world of cryptocurrency. Bitcoins, one of the largest cryptocurrencies in the world, started in 2022 with a positive notion, but within a year, the price of BTC is constantly falling from $50000 levels to $15000 levels (Aziz, 2019).
Not only Bitcoins but the whole crypto world is incurring a great fluctuation due to many downfalls. This includes the Russia-Ukraine war and inflationary rise, which led to an increase in the cost of living. Interest rates in U.S. and U.K. are rising, which is another cause of uncertainty in the crypto prices. Fluctuations are noticeable in the crypto prices as China considers cryptocurrency transactions to be illegal. Fluctuations are also due to the new tax regime in India. Furthermore, the collapse of the largest cryptocurrency exchange, FTX, has caused great damage to the prices of cryptocurrency.
The fear of global recession had a great impact on equities and currencies. As a result, cryptocurrency will likely notice some revival in 2023. Most investors are losing confidence to invest in cryptocurrencies as crypto firms have insufficient liquidity and are father leading to bankruptcies. According to some research, inflation can be a key factor in Bitcoin prices in 2023 (Haar and Money, 2021).
Cryptocurrency is the fastest and cheapest mode to transfer money through a decentralized system that does not collapse at any point in time. Cryptocurrency uses blockchain technology, an infrastructure that inherently secures all transactions. It is not possible for any hacker to hack the entire transaction in a single chance, so cryptocurrency is much more secure (Al Mashhour and Abd Aziz, 2019).
Whereas investing in cryptocurrency is quite a difficult task as one must acquire knowledge of cryptocurrency, which takes time and effort an individual. Cryptocurrency fully works upon digital natives, an individual who might not understand the concept of cryptocurrency.
D. BENEFITS OF BLOCKCHAIN
Benefits to Auditors
Blockchain is the buzzword of the decade. Every individual, irrespective of their age, is curious about what this meta byproduct is and how they can utilize the same in their lives and in their businesses to reap its benefits and minimize manual work. This has led to a sharp uprise in the use of blockchain technology and has resultantly increased the work of auditors and regulators. But it is not without benefits to them, some of which are stated below:
1. Blockchain technology is available to only those users and entities that have been granted specific access to the network. This ensures that no one meddles with the data stored in the blockchain (Smith and Castongua, 2020).
2. Analytics deployed in the blockchain is robust and foolproof. The data that the blockchain system consists of is stored systematically and consistently in a structured manner. This enables the complex procedures and analysis to be performed can be done reliably across the network, and dashboards are updated as soon as possible.
3. Blockchain-enabled solutions solve a crucial auditing limitation relating to testing checking or sampling (Bonyuet, 2020). Auditors, because of the shared ledger technology of blockchains, can now check 100% of the items in a population and not resort to sampling. The shared ledger technology, which includes several counterparties, can be audited in real-time, and any fraudulent activities can be inquired into simultaneously as they are taking place. For instance, the internal audit department of big audit firms has the option to maintain a read-only node on the blockchain environment. As per Deloitte US, auditors do so that "they can monitor and flag transactions in real-time and they can potentially use analytics to automate auditing of routine transactions."
Benefits to Compliance officers
Besides being of immense benefit to the auditor, blockchain technology also makes the work of compliance officers easy because it supports smart contracts, which makes the contract risk compliance more automated, allowing compliance officers to shift from manually testing CRC to more automated testing of its functions and performance, which is a higher value role (Okazaki, 2018).
E. Ethical and Privacy Implications
Privacy Implications
Data is the biggest asset that this generation is going to use. Since all companies across the globe, big or small, are heavily reliant on data and store massive amounts of it on various networks, the question of safety of the same is bound to arise. Data privacy, also called information privacy, provides a suitable protocol for collecting, processing and storing data to ensure that it is properly managed.
With blockchain, the growing implication of privacy of personal information is increasing by the day. A lot of personal data tends to be protected with the General Data Protection Regulation, and for the rest, it is forbidden unless one has the basis, legally, to move ahead with its usage (Salmon and Myers, 2019). Some growing trends that hamper the confidentiality motives in data privacy have been noticed like -
a. Growing misinformation- Most people resort to the internet to get any information about anything they want, and this provides a fertile ground for the users to fall into fraudulent traps and lose their money even- if they are irresponsible.
b. Monitoring employee performance- Since the culture of bringing your own device (BYOD) is on the rise, employers find it increasingly difficult to monitor the activities of employees and the expenses that are being incurred on them. This saw a rise also during the pandemic wherein employees worked from home, and the world ended up on zoom calls instead of physical meets.
Ethical Implications
Blockchain technology has turned out to be a disruptive technology that has the potential to bring about major positive implications to the lives of people on the internet (Sharif and Ghodoosi, 2022). However, as is the case with any upcoming techno-giant, the ethical considerations are to be considered and discussed so that we humans still manage to have some degree of control over the negative side effects (Tang et al., 2019). Some ethical considerations are-
a. Environmental Impacts - Public blockchain networks such as bitcoin engage with unverified networks, and unreliable participants and so have to use networks like proof of work which involves mining. Mining, in turn, requires massive amounts of hardware that requires massive amounts of electricity. This, of course, is harmful to the environment and poses ethical threats. Going forward, an alternative needs to be developed to make this system sustainable.
b. Problem of anonymity- Ransomware can be enabled by public networks like bitcoin. A software system can be easily attacked, data stolen, and the hacker can demand payment in bitcoin, which one will have to make without any knowledge of the attacker or the loss suffered. Also, since such blockchain networks are not regulated centrally or legally, no actions can be taken.
References
.png)
Case Study
FIN600 Financial Management Case Study 2 Sample
Context
The purpose of the assignment is to provide you with the opportunity to apply the knowledge and skills acquired in FIN600 Financial Management, to a practical task, involving the use of ‘real world’ accounting information. This is intended to consolidate your accounting knowledge and skills.
Instructions
The basic requirement is to undertake a general financial analysis, comparing financial position and performance over the two most recent financial years, of an ASX listed company. Your Learning Facilitator will provide the details of the ASX listed company. The annual report for the chosen company should be available on the company website and/or will be provided by your Learning Facilitator.
Note: Assessment 2 submissions based on the incorrect company or a company not chosen by the Facilitator will be regarded as a Non-Submission and no grade will be allocated.
Non-Submissions of Assessment 2 will prohibit a Supplementary assessment for the student.
The analysis should consider each of the following financial ratios:
- Profitability and market performance
- Efficiency
- Liquidity
- Capital structure
Note: Please use the ‘consolidated’ data in conducting your analysis. You are only required to look at the most recent financial report. For those ratios which involve averages, you will calculate an average for the most recent year only, the prior year ratio calculation will NOT consider average calculations.
Points to consider
i. You are encouraged to seek and use additional public information about the company from sources, other than the annual report (for example, the internet, journal articles, newspapers, and business magazines).
ii. However, it is NOT envisaged that you will be engaged in extensive research of this nature and it is expected that the annual report will be the primary resource relied upon, in completing the assignment.
iii. You are asked NOT to try and make direct personal contact with the company or its officers (for example by telephone, fax, letter or email), in an attempt to gather further information.
iv. It is important to note that you must NOT reproduce company promotional material from the annual report or company website and represent it as critical analysis.
v. You will be provided relevant share price data for the company by your facilitator so that investment ratios (such as a price earnings ratio) can be calculated.
vi. You may find it useful to consult accounting references, in addition to the prescribed text, which deals with the analysis and interpretation of company financial reports.
vii. As this is a Masters-level subject, students are expected to engage with high quality credible resources (eg. academic journal articles) to support and
develop arguments and position statements, using the Torrens University Library: http://library.laureate.net.au. References to ‘Wikipedia’ or similar unsubstantiated sources will not be accepted.
viii. It is essential that you use the appropriate APA 6th referencing style, for citing and referencing research. The assignment is to include in-text citations and a reference list following the appropriate APA 6th referencing style. Please see more information on referencing here: https://library.torrens.edu.au/academicskills/apa/tool
Solutions
1 Introduction
1.1 Background and Business
Orica Limited is a multinational company that is engaged in the business of providing commercial explosives and blasting equipment to the mining, oil and gas, construction companies. The company is based in Australia and is listed on the Australian stock exchange. For Assignment Help, The company has a workforce of more than 15,000 employees and is providing services to customers in more than 100 countries (Orica Limited, 2020).
The market and industries in which the company deals are:
1. Oil and gas
2. Quarrying
3. Underground mining
4. Surface coal and metal
The company deals in supply of various kinds of products and provide different types of services as well and have multiple business segments which help the company to earn desired revenue to run their business. Some of these business segments are specified below:
1. Blasting: The company is one of the largest companies that provide blasting equipment to different mining and explosive companies. This includes supplying products like boosters, data analytics and reporting, explosives that are packaged, etc.
2. The company also supplies sodium cyanide for the extraction of gold. The product and services include providing training, involvement of analyzers etc.
2 Company Analysis
2.1 Current Financial performance, Key financial highlights,Economic outlook
*Summary of financial performance for the reporting year
The financial performance of the company is being average in the current financial year as compare to previous financial year. company has lower profitability ratio as compare to past years. It also disclosed that company has compete the industry benchmark but still require the efforts o put so that better performance can be achieved.
Financial highlights/events of YYYY
• The financial year 2020 has been a rather challenging year for the company and it is because of the pandemic, and supply chain management of the company to supply products and services to customers in different countries.
• However, the balance sheet of the company is strong and discloses strong earnings. The total dividend discharged by the company in 2020 is 33 cents which are lower than the dividend discharged in earlier years (Ojala,2021, p.34, para3).
• Amid the pandemic, the company has reported its liquidity of $2.4 billion which is decent and showcases that company has sufficient assets to carry its daily operations. This is because of the strong supply chain of the company which has enabled the company to keep providing products and services to their customers (BHP, Annual report, 2020).
Economic Outlook
• The company has reported that EBIT for 2021 cannot be predicted and depends on the recovery of a pandemic. However, the company is focused on making its strategies strong, which will move the organization towards a growth structure.
• However, there are various customers and suppliers which are returning to their original level and it can be predicted that if the same continues the company will be able to earn effective EBIDTA.
• The company has estimated that capital expenditure for FY 2021 will be around $380 million to $400 million and the focus of the company will be to grow capital and increase the reliability of the plant (Orica Group, Annual report, 2020).
• Hence, it can be seen from the above analysis that Orica Limited has been able to showcase resilient performance amid pandemic as well.
3. Ratio Analysis
3.1 Profitability and Market ratios
.png)
Source ; Figure 1: Table 1.1. (Annual report,2020)
Profitability and market ratios are calculated to analyze the efficiency of the company towards generating profit and cash flows for the shareholders of the company. The higher the profitability ratios are, the better the performance of the company and the more favourable will be the results. However, the analysis becomes more impactful when the comparison is drawn between two or more years. In this case, different profitability and market ratios have been analyzed, and are very important from a shareholders and investors point of view. This is because shareholders are more inclined towards companies that are generating high cash flows because it helps them to earn a higher dividend. On the other hand, market ratios help the investor to decide whether investing in a company will be beneficial or not(Cashwell, et al, 2019, p43, para4).
In the following case, on an analysis of profitability and market ratios, it can be seen that the performance of the company has declined. All the profitability and market ratios of the company have seen a decline in FY 2020 in comparison to the previous year FY 2019. This decline reflects that the company has not earned enough profits in comparison to the previous year.
For instance, the expense ratio of the company has increased in 2020. This reflects that the operating expenses of the company other than tax have increased. This is also because of the additional cost and because the sales have not increased much in comparison to expense. Also, the gross profit ratio of the company has increased, while there is a decline in the net profit ratio. This is because of the increase in expenses, which has declined the profitability of the company.
When the discussion is done about market ratios, they also see a decline. For instance, the dividend per share distributed by the company has declined and is 33 cents per share in FY 2020 in comparison to 55 cents in FY 2019. This is because of a decline in the availability of profit with the company due to pandemic and due to a decline in the financial performance of the company(Han, et al, 2020, p.65, para2).
Due to this, the share price reported by the company is also low, which is impacting the price-earnings ratio. In this case, the PE ratio of the company has increased which means the investors will be required to pay a higher amount for each share purchased by them.
Hence, it can be said, that these ratios are reflecting a negative view and are unfavourable in nature. This is because a low-profit ratio means that the company is not utilizing the resources and their expenses are exceeding the income capacity of the company. Hence, this lays a negative impact on the performance of the company. However, low ratios do not always mean that company might not perform well in the future as well.
3.3 Efficiency ratios
.png)
Figure 2: Table:1.2 (Annual report, 2020)
Efficiency ratios are calculated by the companies to evaluate the efficiency of the company to generate cash flows or profit for the company using the current assets of the companies. There are various efficiency ratios that are calculated to analyze whether the company is efficient in using the funds of the shareholders to generate profit for the company. Some of the most used efficiency ratios are accounts receivable turnover ratio, inventory turnover ratio, assets turnover ratio. These ratios help in analyzing the time taken by the company to receive cash from receivables, or whether the holding period of inventory is too long(Bunker, et al, 2019, p.54, para7).
In this case, the efficiency ratios of the company have decreased. This reflects that the capacity of the company to generate cash or profit from current assets like receivables, the stock has decreased. This decrease in efficiency ratios reflects that company is not effectively using its resources to generate cash and the policies and management of the company are poor.
The ratio which needs attention is the receivable and inventory turnover ratio. Both the ratios have declined, due to which time taken by the company to realize cash from these assets have increased. for instance, earlier the company used to sell its inventory in 47 days and now it takes the company 57 days to sell its inventory. This is also increasing the current assets of the company, which will reflect that the liquidity of the company is strong. While the cash flows from operating activities will decline(Utomo, et al, 2019, p.32, para8).
It can be seen that the ratios do not show stability because there has been a decline in the efficiency of the company. And this is major because of the pandemic in 2020 which has disrupted the supply chain of the company and the company had to hold its inventory for a longer period of time. Also, the increase in receivables reflects that the credit policy of the company is poor and the company is allowing more time to the customers to make their payments.
Hence, the above situation has a negative impact on the performance of the company and the ratios are moving in an unfavourable direction. This is because a decline in these ratios clearly reflects that the company is not performing its duties effectively which is also declining the cash flows of the company while the current assets in the balance sheet are looking strong, but, it is holding the cash of the company.
So, this unfavourable change in ratios put a negative impact on the performance of the company, and measures should be taken by the company to improve their efficiency ratios. This can be done, by investing more assets in strategies that will generate more cash in the long term. Also, measures should be taken by the company to reduce their time. This will ensure that accounts receivable and inventory of the company decreases, which will eventually increase the efficiency ratios of the company (Fuhrer, et al, 2017, p.65, para.23).
3.3 Liquidity Ratios
.png)
Figure 3: Table 1.3(Annual report,2020)
From the above calculation, it can be seen that the current ratio of the company is more than 1 which reflects that for every 1x of liability, the company has current assets of 1.23x. Also, the current ratio of the company has increased in FY 2020 in comparison to FY 2019. This reflects that the liquidity of the company has increased in comparison to the previous year. However, when the quick ratio of the company is seen it is low than the current ratio because it does not consider inventory as a quick asset. Also, the cash flow ratio of the company has decreased which reflects that profit has decreased or current assets have increased.
This change has come because the investment of the company in current assets has increased, likewise, the amount of the current liabilities of the company has also increased because the company has taken interest-bearing securities. However, the cash flow ratio has declined, because as current assets will increase, the cash flow from operating activities will decrease. This is because the cash of the company is stuck in accounts receivable, stock etc.(Annisa, 2019, p89, para43).
Hence, it can be said that when the comparison is done for two years the ratios do not show stability because the ratios have increased and decreased. While the current ratio and quick ratio have become better, the cash flow ratio has decreased, and it attracts special attention. This is because it reflects that the company does not have sufficient cash to run the business in terms of operating profit earned by the company.
So, the current ratio and quick ratio can be said to be favourable in comparison to the cash flow ratio. But, the company should take steps to reduce its reliance on outside debt, and also analyze the efficiency of the company to generate profit from the assets held by the company. Liquidity ratios are considered as one of the most important ratios because they determine the capacity of the company to discharge its short-term obligation. Also, the quick ratio is more efficient because it does not consider the stock as a current asset which is very logical(Zhao,2017, p12, para32).
Hence, the low cash flow ratio and increase in current and quick ratio determines, that while the current ratio of the company is improving the cash-generating power of the company is decreasing. This is because the company can have a positive net income while having low operating cash flows. The decline in ratio is also because of an increase in current assets. For instance, as inventory will increase, current assets will increase but, operating cash flow will decrease because as inventory increases, the cash flow generation will decrease. Likewise, as the current liability of the company will increase, it will reflect that company gets more time to discharge its liabilities and cash flow will increase. So, it is important to analyze that the assets are not unnecessarily increasing, and this can also be due to the poor collection policy of the company in terms of receivable or inventory management (Shin, et al, 2018, p87, para12).
3.4 Capital structure ratios:
Capital structure ratio help to understand the fund utilization for the business. If the debt capital is higher than equity capital then it will indicate the higher capital risk for the company. following are the various capital structure ratio has been provided in the file.
.png)
Figure 4: Table 1.4 (Annual report,2020)
Gearing ratios are the ratios that are used to compare the capital structure of the company i.e. comparison of the form of debt with some form of equity. The ratios are calculated to analyze the financial leverage of the company which reflects how the activities of the company are financed i.e. the capital structure of the company and whether they are funded by equity or debt. Gearing ratios are important for the company because when companies have high financial leverage the returns are also high, but, if the market is not performing well, then the chances of the company losing returns are also high, hence, the risk involved is high(Naseem, et al, 2017, p54, para90).
In the following case, the gearing ratios of the company have increased in FY 2020. This reflects that the reliance of the company on an outside debt has increased. Likewise, the interest coverage ratio of the company has decreased, and it reflects that the EBIT of the company is not sufficient to cover the interest expense of the company.
There are various gearing ratios that have been calculated here, is the debt coverage ratio. The debt coverage ratio of a company reflects that the company is capable of debt, hence, if the debt coverage ratio is high, it is a reflection that the company has the capacity to take high debt. In this case, the debt coverage ratio of the company has increased drastically and it reflects that company has the capacity to take high debt. This generally reflects that the operating income of the company is more than the debt liability of the company. However, in this case, the operating cash flows of the company has decreased drastically(Mathur, et al, 2021, p90, para12).
This change has majorly happened because of the debt that the company has taken. Due to the pandemic the operations of the company has suffered and to manage the liquidity levels, the company was required to take fresh debt which is increased the financial leverage of the company. However, the equity and total assets of the company have also increased, which has laid a positive impact and the company had been able to manage its liquidity levels which have ensured that the company has the capacity to discharge its outside obligation.
However, the liabilities and debt ratio of the company have increased, the gearing ratios of the company will be said to be unfavourable. This is because the operating income of the company is declining, and the interest coverage ratio of the company is also very low. This reflects that the operating income of the company is not sufficient to cover the increased interest expense of the company.
This situation reflects that though the liquidity of the company is strong, measures must be taken by the company to ensure that they decrease their reliance on outside debt because it is increasing the risk of the company. If the company lacks sufficient resources or funds to cover its interest and principal then it will bring a bad name to the affairs of the company. Hence, measures should be taken by the company to reduce its reliance on debt, and increase some of its reliance on equity(Pontoh, 2017, p20, para21).
4 Recommendations and Overall Assessment
Has the reporting year been better than the prior reporting year for the company?
The decline in ratios does not show stability in performance, because the ratios have not remained the same but, has declined. From the above analysis, it can be said that the financial performance of the company has declined in FY 2020 in comparison to the previous year FY 2019. This conclusion has been drawn on the basis of the ratios calculated above.
Will the company succeed in the future?
Yes, the company will succeed in the future, This can be said on the basis of the strong balance sheet and liquidity of the company. Also, the company did not suffer a heavy impact due to the pandemic.
Hence, based on the data available it can be said that the company will succeed in future.
The likelihood of a merger or acquisitionof the company?
Right now, the performance of the company is declining a little bit. However, the PE ratio of the company is high, which reflects that the share is overpriced. However, the company can look for acquiring another company because it will boost the ratio analysis of the company.
This merger with another small company will give the company what they are lacking and will improve their performance as well.
Suggest what should the company be doing help it succeed
In this case, the company should work to improve the net profit ratio. This can be done by the company by cutting down their expenses. As the company works in multi-product they can conduct analysis of products that are not adding to the profit.
Also, the company should work on gearing ratios. Right now, the financial leverage of the company is quite high, and measures should be taken to reduce the leverage by repaying the debt.
External impacts that need to be taken into consideration
The impact of government on the business
External impacts that need attention is the impact of a pandemic on the company, and the government restrictions on trade and commerce. Also, the company should work to improve their sustainability because customers are becoming more aware of a sustainable process.
Hence, in this case, measures should be taken to give more rights and analyze the impact of change in policies on the affairs of the company.
Would you invest in this company?
From, the above analysis it can be said that investing in the company will be beneficial because the prospects of the company are strong and the company will bounce back once, the effect of a pandemic will start lowering.
5 References/Bibliography
Reference:
.png)
Case Study
FIN201 Business Finance Case Study Sample
Assessment Task
The assessment is hinged on evaluating the student’s ability to calculate risk and return metrics of two listed companies from the Appendix, compare financial and stock market performance, determine their capital structures and weighted average cost of capital (WACC). It also allows a comparative discussion of the use of Net Present Value (NPV) and Payback Period as capital budgeting techniques in OECD countries using journal articles published in the last 10 years.
Please refer to the Instructions for details on how to complete this task.
You are expected to apply yourself fully on this assessment in order to produce a draft that should be handed in for marking at the end of Week 9. It is viewed necessary to have this assessment in order to encourage students to commence early on Assessment 4 since the requirements of these two assessments are the same. The students will receive feedback from the Facilitator and should incorporate this in Assessment 4 if it applies.
Instructions
You are assigned a pair of companies: one listed on the Australian Securities Exchange (ASX) and another on the New Zealand Stock Exchange (NZX) in order to address parts (a) to (f) below. The table of companies is in the Appendix.
(a) Using the companies’ annual reports in the last two years, compute the following measures: Changes in Revenue, Return on Assets, Return on Equity, Earnings Per Share and Dividends Per Share.
(b) Using daily stock market prices and S&P/ASX50 (the stock market index for the top 50 companies on the ASX), and S&P/NZX50 (the stock market index for the top 50 companies on the NZX), determine the daily stock returns, daily market index returns, arithmetic mean and geometric mean of the daily stock returns and index returns using data for the period 1 August 2022 to 31 July 2023.
(c) Using the Constant Growth Dividend Valuation model, determine the cost of equity of the two companies allocated to you. (10 marks)
(d) Using the latest Balance Sheets of the two companies, determine the capital structures of the companies and make a well-reasoned argument for similarities or differences in the capital structures of the two companies. In your discussion you are expected to refer to the industries that they belong to and also to other factors that influence capital structures.
(e) Having determined the capital structure of the two companies and using other relevant information, calculate the weighted average cost of capital (WACC) of the two companies and explain why the two companies have different WACCs.
(f) Based on the calculations in Part (a) and Part (b), provide reasons why there could have been differences in financial and stock market performance between the two companies. You are expected to refer to company and industry factors.
(g) Using two articles from peer reviewed journals, published in the last 10 years, perform a comparative analysis of the use of NPV and Payback period as capital budgeting techniques in any two of the following countries: Poland. Portugal, South Korea, Netherlands, Turkiye, Hungary, Finland, Ireland, Norway, Spain, Mexico and New Zealand. Highlight similarities and differences in use between the two countries.
Consider the following as you work on this assignment:
• Data sources are annual reports, yahoo finance (au.finance.yahoo.com) especially for companies listed on the ASX, www.investing.com for companies listed on the NZX, and any other relevant sources
• You are expected to do calculations on an EXCEL Spreadsheet but the Assessment will be presented in a report format in a Word document. (See instructions below of how to embed an EXCEL file into a WORD document). Should you fail to embed the EXCEL document into the WORD document, you can upload the EXCEL document separately.
• Remember to cite, inside the text, the sources of information used. Also put the list of references at the bottom of the report.
• You will be assessed on how well you address the key questions in the assessments and how well you write the report.
• Ensure you strictly follow the Report Format and ensure you include an Executive Summary, Introduction and Conclusion that are properly written.
Solutions
Introduction
Business finance involves the credit and funds involved in the business as finance is considered the foundation of business. For Assignment Help, Interpretation of formalising the models of financial management of combinatorial effect areas helps to determine the need for actualising the process of assessing the proportionality of financial resources(Zaytsev et al., 2021).In this study, the financial evaluation of Origin Limited Company on the Australian Stock Exchange and Oceania Healthcare on the New Zealand Stock Exchange are being evaluated. Evaluating the stock market price of the two companies is conducted. For comparative evaluation, NPV and payback period as capital budgeting techniques are also analysed.
Task A: Financial Performance Analysis
.png)
Fig 1: Annual Report of Origin Limited Company
(Source:Originenergy, 2023)
Origin Limited is a listed company which is considered a major integrated electricity generator and natural gas retailer. It provides electricity and natural gas plans, commercial solar systems and LPG for business needs. The financial performance of Origin in the financial year 2022 has reflected the strength of the integrated performance with stronger commodity prices and generating higher earnings (Annualreports, 2023). The revenue for the years 2022 and 2021 was 8231 million USD and 7136 million USD. For the years 2021 and 2022, the return on equity came at .11 and,26. The return on Assets came at .047 and .011. The earnings per share came at 11.96 and 7.61. The dividend per share came at 1.49 and 1.84. Return on Assets helps in measuring the ability of the cabinet to generate income based on ratios to show how capable the company is of using existing assets(Saputra, 2022).
.png)
Fig 2: Annual Report of Oceania Healthcare
(Source: Oceaniahealthcare, 2023)
The total revenue of Oceania Healthcare for 2022 and 2021 was 231140 and 175417(Oceania Healthcare, 2023). The revenue of Oceania Healthcare for the years 2022 and 2021 came at 231140 and 175417(Oceania Healthcare, 2023). Oceania healthcare limited is considered a limited liability company which is incorporated in New Zealand. For the years 2021 and 2022, the return on equity came at .20 and .12. The return on Assets came at .089 and .05. The earnings per share came at .27 and .16. The dividend per share came at .14 and .11.The mean of the daily stock return for Origin Limited and Oceania Healthcare for 1st August 2022 and 31 July 2023 are evaluated (Refer to Appendix 1 and 2).
Task B: Stock market Price evaluation
Dividend Valuation Model
The dividend growth valuation model is considered an effective way of valuing the stock of the company without considering any effect of the market conditions. It leaves out certain values like company reputation or brand value and focuses on dividend payments which shareholders will receive.Dividend growth valuation model has helped in determining a reasonable fair value for the stock of Oceania Healthcare and Origin Limited. Dividend valuation is considered a simple way of measuring the stock value. It is considered the most widely used for valuing equity. It will allow investors to compare the value of both Origin Limited and Oceania in different industries. Conducting Valuation with the Dividend Discount model involves using several assumptions which reflect the shared values and the number of dividend payments in the future as the fair value of shares represents the number of dividend payments with a particular rate of return(Sutjipto, Setiawan, Ghozali, 2020). Stock performance refers to the percentage increase in the value of the common stock of the company and an Index peer company for measurement boards. The mean of origin limited came at 5 to 5.5 and while the mean of Oceania healthcare ranged from 1 to 1.5.
Task C: Determining Capital Structure
Capital structures refer to the particular combination of quality and which are used by a company for financing its growth and overall operations. Weighted Average cost of capital is considered as the average rate which a business pays for financing its assets. It will help in calculating the value of Oceania Healthcare and Origin Limited. It will help to evaluate opportunities which will help in representing the firm's opportunity cost of capital.It will provide investors with a detailed overview of investment opportunities for providing opportunities for the firms. It will help Origin Limited and Ocean Healthcare perform economic value-added calculations. The Weighted average capital of Origin Limited and Oceania Healthcare came at 6.48 and .42. After conducting an analysis of the balance sheets of Origin Limited and Oceania Healthcare it is found that Origin Limited has an equity capital cost structure and Oceania Healthcare has a debt capital cost structure. Weighted Average cost of capital is considered the single most important input parameter and it is considered the nominal weighted average cost of capital per annum(Vartiainen et al., 2020). Origin Limited and Oceania Healthcare have different WACC as their risk and investments are considered to be different and lower WACC implies safer companies.
Task D: Industry Factors Which Affect Stock Prices
Inflation and interest rates
The market price of the value of stock rates is proportional to the inflation rate as the inflation rate rises stock performance tends to get better. As interest rates rise, share prices tend to fall. In Dec 2023 the stock value of Origin Limited experienced a .67 % decline. Since May 2022 interest rates in Australia have risen by 4.25 percentage points (Janda, 2023).In December Oceania Healthcare also experienced a decrease in stock prices by .03 NZD. The Reserve Bank of New Zealand has maintained the official cash rate at 5.5%( Reuters, 2023).Emergence of COVID 19 has led to the social and economic crisis which have affected the stock markets similar to what happened in the 2008 global financial crisis(Anh and Gan, 2021). The current stock price of Origin energy is7.84 AUD(Finance, 2023).The current stock price of Oceania Healthcare is .66AUD(Investing, 2023).The stock prices of both Origin Limited and Oceania Healthcare have experienced significant decline over the year due to rise in interest rates in Australia and New Zealand.
Economic Indicators
A stronger GDP growth rate tends to indicate that the economy is on solid footing so the stock market is likely to perform in a good manner while the real GDP growth rate will indicate the economy is slowing down and the stock market will be at risk of a downturn. The GDP growth of the Australian economy has been less than what was expected a year ago. The GDP growth rate of New Zealand is expected to ease at a rate of 1% in 2023 as private consumption is supposed to be weakening due to rising mortgage servicing costs and power employment growth(Oecd, 2023).As the GDP forecast for Australia and New Zealand are lower investors are wary of investing their money in companies from these countries as a result the stock prices are declining.
Task E: Capital Budgeting techniques
NPV
NPV is used for calculating the current values and future stream of payments from a project and company.NPV is used for conducting capital budgeting as an investment planning for analysing the profitability of the project as it considers both the risk and time variables.NPV is involved in conducting discounted cash flow analysis which tends to make the NPV more processed rather than any capital budgeting methods which are considered as risk and time variables. While conducting capital budgeting NPV considers decision-making for making judicious decisions which help to understand the cash flow in future and will have less value than cash flow in the present. It will help in comparing similar projects and making informed decisions. Net present Value approximates the challenge of decision-making in project appraisal by creating project portfolios which offer the maximum net present value(Chrysafis, & Papadopoulos et al., 2021).
Payback Period
The payback period is considered as the length of time which is required to recover the cost of investment as an investor will need to reach a breaking point. It implies the length of time required for any investment to recover its initial outlays in terms of savings and profits. The payback period in capital budgeting helps in evaluating the number of years for recovering the cost of investment.A simple payback period is assessed prior to adoption(Kessler, 2017).
Capital Budgeting in Poland and South Korea
Similarities
In Poland and South Korea NPV analysis is conducted by identifying the relevant cash flow , calculating the corporation tax liability and forecasting the future Exchange rates.In Poland and South Korea Capital budgeting is calculated By dividing the initial diving the cash outlay of the project by the amount of net cash inflow that the project will generate each year.
Differences
In Poland, NPV is calculated by measuring the profitability from the financial analysis and calculation of older analysis. In South Korea, NPV is calculated by analysing the features of the production capacity of the company which helps in differentiating the benefits and costs over the entire lifespan of the project which are estimated from the beginning of the project.
In Poland Payback is calculated by conducting research on profitability, and economic analysis of payback period in Poland after analyzing the cost and financial issues to assess the profitability of investments. In South Korea Payback period models are being deployed to assess how worthy the investment will be and if it is viable or not and the payback period is faster if the investment cost is more than 20 years.
Conclusion
Financial analysis has helped in evaluating the financial condition of Origin Limited and Oceanic Healthcare for determining its creditworthiness, ability to generate wealth and profitability. It helps companies determine the risk. Payback in capital budgeting helps in providing the number of years that will be required to recover the investment cost. The analysis of Origin Limited and Oceania Healthcare to determine the return on assets, return on equity, earnings per share and dividend per share for the financial year 2021 and 2022. The weighted average cost of Capital of Origin Limited and Oceanic Healthcare are also evaluated.
References
.png)
.png)
Reports
ACCT6007 Financial Accounting Theory and Practice Report Sample
Context:
This assignment develops research and critical thinking abilities. It is a critical analysis/review of an academic article. Changes in technology are impacting accounting and how accountants perform their jobs. This activity will provide students information on new trends in accounting field.
Instructions:
.png)
Answer the following questions in your critical review:
1. Research and briefly explain Institutional Theory and Legitimacy Theory of Accounting?
2. Evaluate and assess adoption of Information Technology in Accounting through Institutional Theory and Legitimacy Theory perspective of Accounting. Use examples to illustrate how accounting systems are institutionalized within organizations and provide external legitimacy.
3. Critically evaluate the propositions made by the authors. Do you agree or disagree with the 4 propositions in the article? Explain your point of view and provide evidence from other academic resources.
4. Comment on any strengths and weaknesses of the article.
To answer all the above questions: Review the article provided and search for related academic journal articles. Use minimum 10 academic references.
Solutions
Introduction
Transformation into the technologies is influencing the procedure of accounting and the role played by the accountants performing their jobs. This is further presented in an essay form enabling the development of research and critical thinking capabilities in reviewing an article. The incorporation of information technologies acts in improvising the functions of the accounting influencing the organisations. For Assignment Help However, it is often argued that the systems of accounting are institutionalised among organisations providing external legitimacy. Reviewing the overall article with a critical perspective one can able to adhere a detailed perspective of the study.
Institutional Theory and Legitimacy Theory of Accounting
As mentioned by Hope and Vyas (2017), institutional theory enables upon elaborating on the organizational processes and form's homogeneity. The perspective of institutionalisation is referred to as the process enabling the expectations of the society to generate the ideas about the organizational behaviours and forms which mainly evolve out from the actions and thought. On the other hand, De Luca and Prather-Kinsey (2018) stated that institutionalization is the underlying process for which the formal structure attains wide acceptance as an essential element in providing legitimation. Theory of institutions deliberately adopts the assumptions of considering management and structural practices which the other firms grant those for being legitimate. Hope and Vyas (2017) argued that one way of understanding the institutional theory is of accepting the idea of isomorphism. Institutional theory is recognized to be elaborating the choice of organisations about accounting within their operations. According to De Luca and Prather-Kinsey (2018), accounting systems play an important role in allowing a linkage between the defined beliefs in the institutions to that of technical activities.
Theory of Legitimacy stresses how the structure of the organisation gains recognition over an immense sphere. According to Hope and Vyas (2017), the crucial role of accounting is a vital organisation resides upon providing support for the process of legitimation of the organisation. Habib and Hasan (2019) argued that the organizational failure is considered to be legitimated and further influenced the economic, legal, or sanctions socially into the society. Therefore, there pertains to be the ardent need for organisations upon adopting the structures which portray it as to be legitimate within its environment. The symbol of legitimacy in the organisation is from the perspective of accounting. Habib and Hasan (2019) stated the accounting processes include recording, preparing financial systems, internal controls that determine the performance within the organisations and considers itself as a legitimate tool, signaling the environment that the organisations shoeing operations legitimately.
Incorporation of Information Technology within Accounting with the help of Institutional Theory and Legitimacy Theory of Accounting
According to Pendley (2018), technology is considered to be the basic sense within the mechanisms through which the organisations can produce out the services and products. Under this sphere of advancement in technology and rapid growth, the accounting field is supposed to be not isolated with the usage of technology. The effectiveness of decision-making can further be deciphered with the proper incorporation of information technology. Wu and Jia (2018) viewed that the usage of information and technologies of communication have immensely modified the nature of both the accounting as well as the business. With the recognition of the information technology, proper identification as well as opportunities can quickly be identified and further taken for resolution. Information technology is implemented mainly to bring out effectiveness and efficiency over to all of the tasks. The aspect of the quality and the speed both are enhanced for this basis. With the application of the technology, there leads to an increase in the sources for information and thereby, reduces the inclusion of the human actors.
Examples: Systems of Accounting getting institutionalised and external legitimacy
Several of the accounts can further be recognized as institutional accounting like that of the insurance company, pension fund, or that of a registered investment company. On the other hand, Su, Zhai & Karlsson (2017) viewed that some of the regulators often known to be that of MSRB make it possible to further apply the term upon generalizing to involve the inclusion of the banks as well as the individuals. It is been represented in such a way that they can further be retaining the capability of investing with a large sum of money. On the contrary, Yusuf and Srithongrung (2017), the practice of institutional accounting further relies on the term of external legitimation, and thereby in such a case the outsiders are further not provided upon interfering with the domestic governance.
Propositions
The article demonstrates four crucial propositions which evaluations would be as follows. According to Agyekum and Singh (2018), it considers the first proposition as the modification into the practices of accounting are evolved with the new technologies’ adoption raises the accounting role as a mechanism for the organisational institutionalisation. On the contrary, Pendley (2018) argued with the newer implementation of technologies over the accounting process makes the calculation error-free and allows more efficient results enhancing the progress of the organsisation.
The second proposition of the article highlights that the modifications practice due to adopting new technological applications raises organisational legitimacy. On the contrary, Mele Domenec, Rosanas and Fontrodona (2017) argued for an organisation to be implemented as legitimate requires to fulfill the inclusion of socially desirable norms, values and standards.
The third proposition concerns that the modification within the practices of accounting for the technology incorporation raises the overall performance of the firm. Pendley (2018) stated that the overall performance will show an extreme raise and thereby holds efficient results. The productivity of the firm would result in an effective increment and specifically in a short duration. As the underlying processes of accounting require implementation of more time, therefore, the newer application of technologies proposes a reduction in time.
Modifications within the practices of accounting due to adopting the newer technologies are heavily institutionalised requiring the transformation in the counting field. Smith and Urquhart (2018) argued that not only the changes are necessary within the accounting field it is similarly important to practice the changes in the accounting field. The employees as well as the subsequent members require the implementation of immense knowledge and skills such that they can carry out the processes accurately over the newer technologies. According to Su, Zhai & Karlsson (2017), the incorporation of the new method requires the time which should have to be allowed to the members for gaining an effective otherwise as, without adjustment with the working of the new technologies, the work can get dismantled.
Strengths
Advancement within the information technologies is narrowing the accounting process of traditional background and thereby, acts well in drawing improvisations over efficiencies. For this, we can further negotiate that the financial managers are expanding their focus in allowing to take strategic decision making. According to the paper, Agyekum and Singh (2018)., systems of accounting initiated by the organisations range from budgeting, recording, taxation, and internal controls on an immense pedestal among the societal eyes as an accurate organizational structure. Another vivid evaluation can be gathered from the perspective of the paper that the accountant role within the organisation has transformed from mere spectators into active players within the process of management. On the other hand, the paper remains successful in presenting that accounting poses a significant role in enabling legitimacy for organisations. The transformation taking place into the accounting process and that of the systems is due to the advancement in the information technologies which can be well deciphered from the study.
Weaknesses
The paper fails upon indicating what amount of transformation poses the requirement for newer information technologies to influence the institutional transformation into the process of accounting. On the other hand, the time specification is not predicted to be clear in the case of the change of one accounting system to another one. Agyekum and Singh (2018) stated that discussion again failed to evaluate the organisational size as the size of the firms plays an important role when new technology is adopted impacting accounting system. Measurement of the level of change is extremely difficult and therefore the thinking about study implemented vagueness. The effects and the motivation of acceptance of a technology-driven change are required to be industry-specific. The goal of the overall study resides upon introducing the immense concepts and thereby, for which the future researches can achieve the capability of examining the other issues. Moreover, the technology level is found to be varied for varied levels of organisations. This paper again proposes the limitation of not involving the degree of technological requirement advancement for different organisations.
Conclusion
Systems of accounting are important for the organisations since they are important in allowing organisational institutionalisation in providing legitimacy. The systems of accounting within the organisations incur great effectiveness with the new incorporation of the technologies. It thus poses a requirement of enabling the institutionalisation at first within organisations. New installations of the technologies further allow legitimating with that of the external stakeholders. The reputed and used technologies influence some of the accounting functions resulted from several technologies intitutionalised into the field of accounting. Modifications into the accounting system concerning the growth in technology enhance the accounting role in predicting the organizational legitimacy.
Reference List
.png)
Assignment
Financial Decision Making Behaviour Assignment Sample
Description
Advisors must be aware of the range of behavioural biases, including ones that they exhibit themselves, so as facilitate a better client-advisor relationship. Accordingly, this research assignment gives students an opportunity to engage with the behavioural finance perspective of investor behaviour, and to deeply reflect on what biases and why the student themselves exhibit in relation to decision-making. The writing style of this assignment includes both formal (passive) research writing, as well as reflective writing which may include pronouns (I, my, etc).
Assessments questions:
You should include in your assignment:
- An synopsis of the differences between traditional finance and behavioural finance perspectives on financial decision-making behaviour
- An overview of the various cognitive and emotional biases, with references to seminal academic papers and/or theories
- An analysis of biases that may influence your own financial decision-making
- Provide insight as to why you may have these biases
- Describe what can be done to mitigate the negative impact of these biases when making financial decisions.
SOLUTION
INTRODUTION
Decision making is measured as one of the most dynamic activity for selection an alternative option from the conditions that reflect good profitability to investors. The primary objective of the investor is to maximize return at minimum risk. For Assignment Help Considering this aspect, present study mainly explains about the behavioural finance perspective of behaviour of investor, and deeply reflects about biases and the manner in which it impacts financial decision.
DISTINGUISH BETWEEN TRADITIONAL FINANCE AND BEHAVIOURAL FINANCE IN THE CONTEXT OF FINANCIAL DECISION – MAKING BEHAVIOUR
It has been noted that, distinct theories has been advanced and have widely categorized the financial market into two aspects such as traditional finance and behavioural finance, which gives contrasting views in financial decision-making behaviour (Kapoor, &Prosad, 2017).
Traditional finance theory is founded on the notion that investors act in the rational manner, whose objective is to maximize their return and they are normally risk averse, which is based on classical decision theory and risk aversion theory. Notably, traditional finance emphasis on the theory of Efficient Market Hypothesis, which proposes that competitiveness between investors between desiring abnormal return influence prices to their reliable values (Valaskova, Bartosova, &Kubala, 2019). On the other side, it has been assumed under behavioural finance that financial market in some conditions informationally inefficient. Moreover, it can be said that, behavioural finance focuses on sociological and psychological elements of the investor’s decision making behaviour. The cited theory stresses on the market anomalies and inefficiencies. Some of the main differences between the traditional finance and behavioural finance are explained as follows –
• Behavioural finance is more of identifying the usual trend of the financial decision implemented by the investors, while traditional finance is considered as more rational that emphasis on mathematical computation, economic models, as well as identification of the market behaviour. Traditional finance is also applied Modern Portfolio Theory, which shows the manner in which risk averse investors could create portfolio for maximization of return on provided level of risk.
• Behavioural finance is the identical technique applied by forecaster of climate, forecaster of economic situation that handles the comprehensive conditions for the financial decisions, while traditional finance is founded on several theories, models, as well as assumptions for taking decision (Chandra, &Thenmozhi, 2017).
• Behavioural finance creates the distinct assumptions with respect to the behaviour of investors and market by making observation, while traditional finance is more of taking into account that markets are efficient with the all provided information that supports investors for taking financial decisions.
• As per the traditional finance, investors obtain infinite knowledge, information, and data, which is perfect. Such information is carefully processed by the investors, so there is rationality in the complete manner. Whereas, in the behavioural finance, investors have bounded rationality, by which entire information is not processed by all information (Taffler, Spence, &Eshraghi, 2017).
• It has been stated under traditional finance that there is efficient market and is a demonstration of the true value of financial market. This argument is founded on the fact that, it has been believed in traditional finance that investors possess self-control, while it has been believed by behavioural finance that market is volatile and therefore there is existence of market anomalies. So, self-control is not possessed by investors in perfect manner, and there is existence of limitation.
Overall, it has been concluded that, behavioural science is primarily concerned with examining the psychology and sociology element of investors. It reduces the assumption of rationality as stated under traditional finance theory and explains the psychological biases that create impact on investor’s decision making in real life (Schoenmaker, &Schramade, 2019).
OVERVIEW OF SEVERAL COGNITIVE AND EMOTIONAL BIASES
Cognitive biases normally consist of decision making on the basis of determined principles that may be accurate or not. Precisely, cognitive bias is a mistake that taken place in reasoning by individual at the time of taking decision, which is blemished through personal faith. Some of the cognitive biases are explained as follows.
Confirmation bias: In this aspect, normally individual give more burden on the opinion of those who asset with them. Investors also do such things as well. In can be noted that, confirmation bias is founded on the notion that individual seek out information and data that assures their pre-existing ideas, and therefore the contrary information is overlooked by them (Yuan, Tian, Huang, Fan & Wei, 2019).
Risk-Averse bias: The bull market is active and even a number of investor has not attained the rally due to the fear that it would reverse course. Such type of bias usually assists investors to emphasis more on bad news relative to good news. This type of investor usually like to invest in safe environment, conservative investment and seeks to such investment in more active manner while markets are strong (Zahera, &Bansal, 2018). Potentially, risk-averse bias could cause the impact of risk to hold more weight as compared to the probability of reward.
Bandwagon effect: It has been noted that, Warren Buffett is one of the most successful investor in the whole world through resisting the bandwagon effect. Their famous suggestion is that, investors should be greedy when others are fearful and they should be fearful when others are greedy. By considering the confirmation bias, investors would feel better at the time when they make investment along with crowd, but Buffett has proven the contrary mentality and prove profitable.
Further, emotional biases usually arise spontaneously on the basis of the personal feeling of the investors at the time of decision making. It is also rooted in-depth manner in personal experience that also creates impact on decision-making. Emotional biases are generally taken place in the psychology of investors and could usually be typical to overcome as compared to the cognitive biases. Some of the sorts of emotional biases are explained as follows –
Loss-aversion bias: In this bias, investors are usually tended to avoiding losses in comparison to the obtaining gains. It has been identified in number of studies that, psychologically losses are more powerful relative to gains.
Endowment bias: In this emotional bias, investors value assets more when rights are hold by them as compared to when they do not. The securities that has been already own by investors, hold by them in irrationally, which is specifically quite reliable with respect to their inherited investment. The outcome of the cited bias is that investors fail to sell off some assets and replace other assets (Dowling et al. 2020).
Overconfidence bias: In this, individuals reflect unwarranted believe in their own judgements. Such overconfidence may assists towards overestimation of knowledge level, access of data, and capabilities.
Familiarity bias: This enforces making investment which is accustomed rather than choosing best available alternative. In simple words familiarity bias means providing preference to remain confined to what is familiar.
ASSESSMENT OF BIASES WHICH MIGHT INFLUENCE MY FINANCIAL DECISION-MAKING
The biases which might influence my financial decision making in context with cognitive biases are Bandwagon effect and Confirmation. As being an investor; it feels reassured in case trading or investing decision is taken same as many others (Leiblein,Reuer& Zenger, 2018). I do not prefer accepting higher risk; thus before making any decisions an underlying reason should necessary exist for making same. The bandwagon affect could be an underlying reason which can be used as an investor. Thus, prior making any investment decision I would do market analysis for comparing my decision with others and would not move on if it is not the one accepted by majority of investors. Confirmation bias is considered as psychological principle with do affect financial decision making capabilities. The reason behind same is that it enforces decision maker to negate information which contradicts with pre-existing biases and believes of information which does validate their position. In simple words, decision is not taken on the basis of all available information but limited information considered to be relied. Being an investor, I make effort to confirm evidence rather than taking decision on the basis of only evaluating information. The main issue which I have to deal while complying same is that the decision is taken on the basis of information which is confirmed by preconceived ideas relating to investment and it eventually leads to biased financial decisions (Ady, 2018).
Being reserved in nature and not attaining access to available opportunities as they are attached with high risk; loss aversion is one of emotional bias would influence my financial decision to significant extent. The fact cannot be denied that pain of losing is psychologically twice the pleasure of profits or gain (Shrestha et al, 2019). As while making investment decision I do not opt for alternatives which are risky even though the reward potential is high. Even though this bias prevents from making riskier decision; it also prevents from acceptance of innovative and partially riskier solutions due to which best available option is not chosen. Further, familiarity bias is another emotional bias which would affect financial decision making (Leiblein, Reuer & Zenger, 2018). The reason behind same is that I prefer opting investment relating to which I am well aware; rather than exploring new options as it could be more risky; thus I prefer making decision in safe zone rather than taking higher risk. Familiarity bias can be in context with home country, company with which one work and companies which are preferred over other. In my case I could say it is both companies which I like and biased with home country.
PROVIDE INSIGHT AS TO WHY YOU MAY HAVE THESE BIASES
Decision making is a crucial activity for process of selecting alternative option from a situation which represents good results to individual and investors (Ady, 2018). One of the main insights of dealing with cognitive biases such as bandwagon effect is fear of being let out of the stock; as rise is being assessed in a stock. Thus, rather than analysing fundamentals of company; investment is made in ‘hot stock’ as it is popular. For instance IPO’s cannot be specified as bandwagon effect in practice. As the announcement relating to of offerings are made with huge publicity; thus investor is overenthusiastic for trading as it is suspected that price of stock are rise (Shan et al, 2019). Further, being motivated by wishful thinking, before making investment decision I do confirm the details or prejudices in order to ensure that it is true. However, due to same sometime I ignore information which causes doubt on same as I do trust the source from which information has been gathered. Another main reason of confirmation and loss averse bias is experience of heavy loss in stock exchange market by my parents as they do make frequent investment in security. I have witnessed them dealing with loss in case they do not having faith in contradictions available against our belief on the basis of which decision is made. Thus, I think being bought in specified experience I do have cited biases.
Cognitive bias can be referred as our brains natural way to provide assistance in decision making (Oehler et al, 2018). The cited bias is dependent on our nature and emotions applied to make any investment decision. Thus, as I do not prefer high risk investment alternative due to which I have to deal with Bandwagon effect bias. I believe that it is not wrong to be part of winning side and for same one has to assess the opinion of group or society to ensure what is right or acceptable. Due to same I do prefer or apply group opinion rather than individual thoughts in order to reduce probability of loss. However, it sometimes leads to Bandwagon effect bias and I have to suffer loss being part of group (Valaskova, Bartosova&Kubala, 2019).
ANALYSIS OF MITIGATION OF NEGATIVE IMPACT OF THESE BIASES AT THE TIME OF MAKING FINANCIAL DECISION
Cognitive and emotional biases are common issues for investment success.it is essential for the investors to manage and put efforts towards reduction of such biases as it would help in making rational judgement and avoid costly tools. In order to mitigate the negative impact of confirmation bias, investors are required to maintain information channel open and seek for manner that challenge their ideas. They should identify the pros and cons for a balanced perspective and alternative information from distinct sources. In addition to this, they should also consider evaluate the proposition from several perspectives to restrict from failing into the snare of confirmation bias (Ahmad, Ibrahim, &Tuyon, 2017). Further, loss aversion assists investor to avoid taking minor risk that could support diversification of portfolio for wealth building and probable profits in the long term period. In order to overcome such type of bias, investor should not leave it on the emotions and fear of losses over looking for profitability. It is advisable for the investors to build a robust investment plan as per their suitability and accept some risk within tolerance through taking into account assets that is performed in well manner (Oehler et al, 2018).
The best way to combat with bandwagon effect of cognitive biases is to make investment deliberately against the decision taken by majority. It does require independent thought and confidence but it does assist in attaining desirable results (Sedliacikova et al, 2021). As cited effect does raise barriers for making objective analysis and enforce investor to be influenced by the judgement of others; thus before being dependent on others action, it is necessary to make research regarding the fundamental of option being chosen for investment. Confirmation Bias which is part of cognitive bias could be mitigated to significant extent through acknowledging that it does exists in order to overcome its effects. It can be done through viewing alternating provided by independent third party and analyse information objectively (Ademola, Musa & Innocent, 2019). Even assistance of artificial intelligence can be taken for developing unbiased views and evaluating decision on overall basis. Further, for attaining appropriate results one can ask questions which support bias so that the negative impact of bias could be mitigated or reduced to certain extent.
Emotional bias is connected with behaviour and preferences made by investor while making any decision (Aprayuda, Misra & Kartika, 2021). Familiarity bias is part of same and it can be in form of bias to country, bias to company which we like or any other preferred parameters. It is possible to mitigate its negative impact through checking investing approaches in continue manner along with taking advice of financial advisor so that investment plan or portfolio could be analysed in better manner. With same one could succeed in attaining desired long term result from investments. Even efforts could be made to explore wider opportunities i.e. being aware of all available alternatives and analyse risk along with performance (Aprayuda, Misra & Kartika, 2021).
CONCLUSION
It can be concluded from above analysis that cognitive and emotional biases do affect financial decision of investor. However, it is possible to mitigate negative impact of cited biases through assessing the nature and impact of specific biases in detail. One of the methods which could be useful for emotional as well as cognitive bias is making decision with assistance of financial advisor so that investment plan or portfolio could be analysed in better manner. . Lastly, investors should make effort to assess risk and rewards in detail so that they could take logical and rational decision rather than decision base of cognitive and behavioural biases.
REFERENCES
.png)
.png)
Assignment
Finance Broking in Practice Assignment Sample
Question 1
Are your clients eligible for the First Home Owner’s Grant or stamp duty exemptions given they plan to buy in the same suburb as you? So Sweet organizational requirements requires you in addressing such questions to access the most recent figures from the website, including the link and the most recent data in your response.
Question 2
What documents would you request from your clients given their application for a mortgage loan? In what way do these documents meet organizational requirements?
Question 3
When serving this young couple, how would you fulfil your responsibilities as a mortgage broker under the anti-money laundering legislation?
Question 4
Given the fact that your clients have poor to adequate English language skills, what would you do to avoid committing unconscionable, misleading or deceptive conduct?
Question 5
Using the internet to find the most current products, decide which sort of a loan you would recommend to your clients and explain why.
Question 6
Would you recommend a portability feature within the loan for your clients?
Question 7
Calculate the loan-to-value ratio and discuss whether a lender would be prepared to lend your clients their desired amount on the basis of the information they have provided.
Question 8
What would be the monthly payments of an interest only loan be if the interest rate was 7% per annum?
Question 9
What would be the initial monthly repayments if you recommended a variable loan (principle and interest) if the interest rate was 7% and the loan term was 25 years?
Please review the illustrated example in chapter 5 for this calculation.
Question 10
How would you charge your clients? Please detail your remuneration arrangement in full in an email to your clients ensuring to sign off with your name.
Solution
Question 1
In general, the first home owner or buyer grant refers to a specific type of grant that is mainly for those who are buying their first home and just like other grants the first-time house owner or buyer does not hold a commitment to repay the grant. As being the financial broker in Australia, my clients named Peng and Mia both are definitely eligible for buying their first home in Australia. According to the reports for assignment help of Drukker (2021), to be eligible for the first home buyer grant any customer must need to buy a house or unit of townhouse which is under the value of $750,000. As in this case my clients want to buy a condominium or unit in a townhouse that values $ 410,000. The first home buyer grant is also applicable when the consumer earns income that is below $160,000 and as per their statement the couple has saved $ 95,000.
In order to take advantage of the grant Mia and Peng also lived in the nation over two years and in these years, they have been saved a fund of almost $ 1,00,000 and the rest of the money wants to acquire by a home loan. The first home buyer’s loans also include great benefits rather than other nominal bank loans.
Question 2
As per the rules of the Australian home loan system the documents are similar just as for the other loan grants. The documents needed to be carried in by my clients in order to meet the organizational requirements are birth certificate, certificate of citizenship, Medicare card, centre link pension card, utilities bill less than three months, notice of rates lesser than the three month and tax assessment notice less than 12 months. As per the statement of Nicholson et al. (2019), the documentation process of mortgage loans in Australia are divided mainly into four parts; proof of identification, ownership details or the documents related to property, documents related to customers income and expenses. The documents under the proof of identity are such as passport, birth certificate and driver license. Ownership details of properties, cars, and savings are coming under the documentation of properties and the income and expenses documentation process includes documents such as PAYG statement, recent payslips and monthly expenses from childcare to any other maintenance.
The related documents including the information of income and expenses are verified by the mortgage lenders through direct request from the consumers as these documents resolve the main four factors that are required for the verification such as gross annual income, assets and liabilities, credit history and down payment. For my clients I have been asked for the same including income for the last two years.
Question 3
The Anti Money Laundering and Counter- Terrorism Financing Act 2006 (Cth) refers to the primary piece of legastisation in order to respect the prevention and detection of terrorism financing and money laundering, (Singh and Best, 2019). As being a mortgage broker the primary and basic responsibility would be to serve my recent clients the best fitted terms based on borrower’s financial situation. As my clients are both young and currently planning to take residence inside an Australian township’s unit, my focus is to gather the right data and make a proper documentation system. The basic difference between a lender and mortgage broker, we are more responsible to give accurate advice towards the customers or clients so from that suggestion clients can make further and prominent decisions for buying a home. One of the important and other responsibilities of being a mortgage loaner is to also to provide the best options among other average options.
Underlying the act of Anti Money Laundering the active and superior responsibilities would be to assess and identify the money laundering risk, fraud and other potential suspicious activity for both client and mortgage broker, (Bailes, 2017). Monitoring and re-confirmation from the data provided by my clients and provided by me towards the clients is very much important in order to prevent any type of mortgage risk, fraud or scams.
Question 4
Under the Australian Consumer Law, it is described that any business or any type of business must not be conducted with unconscionable engagement. According to the report of Syuib (2020), it is stated that understanding and determining or identifying the unconscionable conduct is much important to reduce the risk from any misconduct. In this situation both my clients are from Taiwan and as they are poor in English in this situation it will be better to provide written documentation rather than verbal conversation. In this case, there is also a need of understanding the systems and laws regarding the mortgage loan in Taiwan, so this will benefit me in order to understand their understanding based on the laws. Also, in order to avoid being a victim of unconscionable conduct I will be using such legal process or procedures such as ensuring all agreements are in a written form, double ensuring for fully understanding all terms of transactions, explaining the terms and conditions by using easy language, seeks for the best deal and negotiate in order to achieve the best outcomes for me as well as for my clients.
For the agreement process that will be done by using plain and easy English, making sure the contract is not lengthy and not included harsh words or unfair terms.
Question 5
Based on the client recommendation after researching other relevant current products on the internet for my current clients the FHA or Federal Housing Administration Role would be the bests options among the other loan offers or products. It is highly beneficial for those borrowers who have low to moderate income and also the loan system demands for lower minimum down payment and lower credit scores rather than other conventional loans, (Troy, 2017). The loan includes so many advantages and it is very popular among first time home buyers. FHA loans are commonly issued by FHA approved banks and FHA institutions in order to properly evaluate the qualifications for the loan grant. The loan is also required to purchase mortgage insurance and premium payments are made to FHA. According to the Spitzer and Lambie-Hanson (2020), Compared to other home loans the FHA home loans include the lowest down payments of just 3.5 %.
In this loan procedure or system my client would need to get a qualifiable credit score of 580 but if they still don’t get success, they still can apply for FHA loans by making a down payment of 3.5% only if they scored between 500 to 579.
Question 6
The FHA loans already include many profitable features for the first-time house buyer but in this case, there are no other profitability features available for my clients. Portability or home loan portability refers to a feature that allows consumers to keep the same home loan product but change the supporting security of a property. The feature is also able to save the time and costs of refinancing. The home loan portability feature usually recommended to our clients when moving houses while client owe less than 80% on their mortgage. Loan portability also provides support to the clients to keep their existing loan such as current balance, interest rate and several other attached features and also change the security attached to a particular loan. In Australia, the first-time buyer only gets a discount of $10,000 when the clients are buying a new house worth $ 600,000 or building a new home valued up to $ 750, 00, (Bian et al. 2018). As per the section 245(a) loan, this program mainly for those borrowers who are expecting their income will be increased as or by these recent clients they are also expecting that in future they will earn an extra profit from their bakery business. In addition, there are small perks of profit included in the FHA loan process such as if my clients started to earn a good profit from their bakery business then can easily apply for the FHA’s limited 203(k) programs. Apart from FHA loan, there are several home or building loans in Australia that provides different interest amount and also emerge new and different type of portability. Variable interest rate loan is also known as basic and standard home loan for new residents in Australia. In this loan program, the rate of interest needed to pay by my clients would be set by the Reserve Bank of Australia and essentially the rate will either move high or low according to Australia’s Reserve Bank.
These programs help the clients to wrap up the $35,000 for additional renovation expenses into their mortgage loan and the service also includes other serviceable programs such as house repair, house improvement or any up gradation needed in house. As per the report of Whait et al. (2019), this particular loan system can also be applied by a single woman, just for example if Mia wants to buy a further property in future by all alone, she can easily apply for this loan and there is no extra documentation or verification needed.
Question 7
.png)
Based on the financial data or information provided by my customers, a lender would definitely provide many options regarding house buying. The couple are both intermediate in English so it is determined that if the lenders can communicate through by speaking English that will be beneficial for both in order to understand each other’s wants and needs. Based on the other information my both clients have stated that they want a big size house as per the view of their future perspectives but as they both do not have a proper stable income beside the profit, they earn from their bakery business it may be quite discomforting for the lenders. The couple has both stayed in Australia moreover two years and the resident they are looking for they want to spend over six months, as based on this relative information the lender can gain a trust ability in against the couple. Like mortgage brokers, lenders also want to see the proper documentation of the buyers in order to avoid any fraud or scam so by enabling the process of proper documentation the lender can actively sell their property without any further hesitation.
Question 8
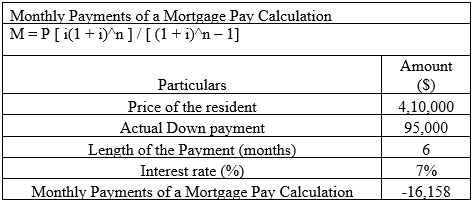
Based on the financial information provided by my client, only if the interest changes into 7% Annum the Mortgage payment would be $ (16,158) monthly.
Question 9
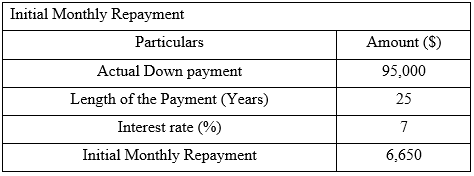
Based on the financial data and by following the calculation method from chapter five the calculation process is mentioned above. As in this calculation we have presumed that the actual payment or the value of P is $95,000 and the interest rate is 7% and the length of the payment is 25 years. The calculation of initial monthly repayment is the interest rate divided by the length of the payment and multiplied by the down payment and through this the calculation of initial monthly repayment is evaluated, (Ampofo, 2020). Based on the future situation for my client, if they increase the rate of the payment, they can sustain a long-term process and as well as it will be very beneficial for them. The situation of increasing the interest would be only done if the clients increase their future earnings or the profit from their bakery shop.
Question 10
For this new client Mia and Cheng by the determination it is acknowledged that the FHA loan would be the best and most appropriate loan system for them. As per the report of Young et al. (2021), it is found that the FHA loan is known as one of the most popular house loans for first house buyers. Just as many other mortgage brokers based on the total loan amount from 1 to 3% will be charged from the client. The remuneration would be done by both in written or paper documentation and as well as a soft copy will be sent to the email address provided by my client. The process would also be done through writing in easy English and the verbal communication will be done through based on both sides' understanding. The documents regarding the remuneration will be defined through specific contents and not using too lengthy words as my clients are not experts in english. In the both documentation there will mention the 0.5 percent commission charged from the total price of the house, based on the data the fees will be applicable for these clients. 0.5 % of $ 410000 means $2,050.
Reference List
.png)
Assignment
HI6028 Finance Assignment Sample
Question 1
An owner of a Cinema Hall, on ascertaining that a portion of the ceiling of the hall was in need of repairs, decided to replace the whole of the ceiling with different but better materials. The new ceiling, in addition to enhancing the appearance of the hall, improved the acoustics. The total cost of the material and of erecting the new ceiling was $320,000. It was estimated that the cost of repairing the ceiling would have been $220,000.
With reference to Income Tax Assessment Act 1997 and relevant case law, discuss the amount, if any, allowable as a deduction for income tax purposes.
Kindly use the four sections of:
1. Facts of the scenario
2. Relevant laws and cases
3. Application of laws and cases
4. Conclusion
QUESTION 2
A new client, Mary, is your first client. She needs to lodge his income tax for 2021/22. Further, she wants to know about some tax-related provisions and practices. She asks some questions - what are the differences between taxable income, ordinary income, and statutory income? What types of ordinary and statutory income do not constitute assessable income? (Maximum 700 words)
Furthermore- She gave her annual income and deduction below. Calculate her Total Assessable Income, Taxable Income, Tax Liability, Medicare Levy and Medicare Levy Surcharge, if applicable, for the taxpayer (Mary) with the information below:
- Mary is a resident single mom with one dependent child (4 years old) taxpayer of Australia for the tax year 2021-2022
- Her Taxable Salary earned is $110,000 (Including tax withheld) having no private health insurance.
- She had a $12,000 deduction.
- Mary has a student loan outstanding for his previous studies at Queensland University of $32,000.
- Mary’s employer pays superannuation guarantee charge of 9.5% on top of her salary to her nominated fund.
- Mary earned a passive income of $5,000 from the investments in shares in the same tax year.
Hint: The following website can be used to cross-check your answers but you need to provide detailed calculations, rates and explanations of rates from ATO website.
QUESTION 2: Income Tax Calculation and explanation Weighting
- Answer tax related questions 5%
- Total Assessable Income 1 %
- Total Taxable Income 1 %
- HELP repayment amount 1 %
- Medicare Levy 1 %
- Medicare Levy Surcharge 1 %
- Total Tax Liability 3%
Solution
Answer 1
1. Facts of The Scenario
The facts of the scenario are concerned with eligibility of deduction of expenses from the income by considering the Income Tax Assessment Act 1997. In the cited scenario, assesse has spent amount for repairing and maintenance expenses, whether or not such amount for assignment help can be deduced while computing taxable income, is required to be discussed.
2. Relevant Laws and Cases
Division 8 of the ITAA 1997 explains that, taxpayer could decrease their profit from particular expenses, which is divided into two following categories –
General deduction (section 8.1): According to the cited section, if taxpayer has expenses or losses from production of assessable income from directly or indirectly, then they could deduct it under section 8.1. It has been provided that, assesse could reduce their assessable profit or expenses or losses to the extent they are incurred in earnings of assessable profit or mandatorily occurred in running on a business for the objective of achieving or generating assessable profits (Australian Taxation Office, 2021).
Section 8-1(2) of ITAA 1997: According to the cited section, following are the amount is not allowed as deduction from the assessable income under section 8-1 –
- If expenses or losses are in capital nature.
- If they are occurred for the personal objective (Millane, &Stewart, 2019, p. 505(2)).
- If expenses assists towards production of non-assessable non-exempt profit.
- If they are not eligible for deduction under any particular provision of ITAA 1997.
Specific deduction (Section 8.5): Along with general deductions, things could be added to decrease income of assesse if it is allowed under any particular section.
Section 25-10 of ITAA 1997: The taxpayer is eligible to avail deduction for repair of premises or depreciating assets that has been held for profit generating objective. Repair is referred as fixing something that is defective, which does not means renovation of the property, and creating the increment in value by application of distinct material (Burton, 2018, p. 34(1)). It should be noted that, there is difference between repair and improvement, and assesse is eligible to claim only expenses of repair and maintenance (Jones, 2018, p. 32(2)). In the case of FCT v Western Suburbs, assesse replaced the cinema ceiling by using distinct type of material, and the new material was better material. In this, it was stated by court that, it is considered as capital expenses because there was an improvement on the property (Woodcock, 1997). Further, in the case of Lindsay, court denied the deduction in which old ship ramp was demolished and replaced.
Moreover, as per the decision given in the case of W Thomas, repair expenses leads towards restoration of efficiency in functions instead the precise repetition of forms and material. It is because; anything would definitely get improved by repairing (Hümbelin, & Farys, 2017, p. 1(2)). Therefore, a limited improvement in the efficiency of function is not any concern for deduction of amount as improvement of the condition of items is possible by all repairs as compared to its earlier condition (Curran, & Yapa, 2021, p. 18(2)). On the other side, improvement is considered as adding benefits consisting of permanent features. In the case of Morcom v Campbell-Johnsom, a replacement with a modern comparable is considered as repair.
There is not any clear distinction between what is considered as repair and what an improvement expense is. Generally, if the expenses lead towards significant efficiency of functions rather than minor, then it is considered as improvement expenses in nature and therefore it will not allow for deduction from assessable income as per section 25 of the ITAA 1997 (Hrblock, 2020).
3. Application of Laws and Cases
The scenario states that, owner of cinema hall requires repairing of ceiling and he decided to make replacement of whole ceiling with distinct but better material. The facts of given case scenario is quite similar with the case of FCT v Western Suburbs. Since, expenses incurred replacement of whole ceiling with distinct but better material is considered as improvement rather than repair and maintenance. The reason behind the same is that, such expenses lead towards betterment of condition or increased value of ceiling beyond its original condition at the time of buy. Moreover, it is not considered as minor improvement in the functional efficiency of item as it is adding additional benefit, which has long lasting nature. Due to such aspect, such expenses are considered as improvement expenses instead of repair and maintenance.
By application of relevant provisions of ITAA 1997, it can be concluded that, expenses incurred by owner of cinema hall is not considered as repair and maintenance expenses of assets held for income generating purpose. Instead of this, expenses are considered as improvement, and therefore it is capital nature expenses and will not be allowed as deduction from assessable income.
Answer 2
In the prevailing case scenario, Mary requires to file income tax return for the year 2021-2022. However, prior to filing such income tax return, she wants to understand some provisions and practices of ITAA 1997. In this aspect, some of the requirements stated by her is explained as follows -
Dissimilarities between taxable income, ordinary income, and statutory income
Section 6-1 of the ITAA 1997 states that, assessable income of person consists of ordinary income and statutory income. Further, section 6-5(1) of the cited Act says that, assessable income includes income as per the ordinary concept. In the legal case Scott v FCT, it was stated by judges that, what receipts should be considered as income should be ascertained as per the ordinary concept and the application of mankind provided it is explained in statue otherwise. Therefore, it can be said that, ordinary income is the income generated as per the ordinary concept.
Further, it should be noted that, taxable income is the amount on which tax is levied by government. Since, ITAA 1997, section 8(1) and 8(5) explained about deduction of expenses from the assessable income, and tax is charged on the remaining amount. As per Section 4-15 of ITAA 1997, taxable income is computed from assessable profit and deduction.
Further, section 6-10 of the ITAA 1997 defined statuary income, which is the income of assesse that does not falls as ordinary income but it is required to include in the assessable profit due to particular rules in the ITAA 1997. For instance, capital gain is considered as statuary income of assesse.
Types of ordinary and statutory cinema do not consider assessable profit of assesse
The amount that is not included in the assessable income is divided into following categories such as –
Exempt Income: As per section 6-1 of the ITAA 1997, assessable income does not include exempt income, which is the tax-free income for assesse. Examples of exempt income includes but not restricted to following –
• Business grants and some scholarship.
• Some overseas allowance and payment for members of ADF (Australia defense force).
Non-assessable, non-exempt income: It is the receipts that are not assessed and payment of tax is not required to be done by taxpayer. Examples of non-assessable, non-exempt income includes but not restricted to following –
- Payments made by states as per Disaster Recovery Funding Arrangement 2018 in relation to 2019-20.
- Super co-contribution
Other receipts which is not included in assessable income: Usually, some of the following amount is required to declare by assesse –
- Winning money in ordinary lotteries.
- Gifts on special occasion.
- Prize receives on game show.
- Child help and spouse maintenance payment received by taxpayer.
Computation of income tax for Mary
By application of above concept of assessable income, calculation of assessable income for Mary is as follows –
Assessable income = Ordinary income + Statuary income
Taxable income = Assessable income – deduction
Tax = Taxable income*rate
Table 1 Calculation of tax for Mary for year 2021-2022
.png)
Notes:
a. Income tax
.png)
On the basis of this, Income tax = 23942
b. Medicare levy surcharge
It would be charged in addition to the Medicare levy. As per the provisions of ITAA 1997, Medicare levy surcharge would be charged to taxpayer if they do not have any private health insurance cover, and assessable income is more than basic threshold limit. The following rates is considered for Medicare levy surcharge –
.png)
Since, in this case, income of Mary is more than $90000, and not any private insurance cover is taken by her, therefore Medicare levy surcharge would be applicable. Rate of Medicare levy surcharge would be 1% by considering above threshold limits.
Medicare levy surcharge = 1030
c. Repayment of student loan
If the profit of borrower is more than $46620, then they have to pay particular percentage of loan amount. In this case, 7% is required to be repay by Mary as her income is exceeding $46620.
References
.png)
Assignment
HI6028 Taxation Theory, Practice and Law Assignment Sample
Question 1
A. John recently purchased a Theatre Hall which was in poor condition. Before starting the hall, it needed to repair a portion of the ceiling, but he decided to replace the whole of the ceiling with different but better materials. The new ceiling, in addition to enhancing the appearance of the hall, improved the acoustics. The total cost of the material and of erecting the new ceiling was $210,000. It was estimated that the cost ofrepairing the ceiling would have been $150,000.
With reference to Income Tax Assessment Act 1997 and relevant case law, discuss the amount, if any, allowable as a deduction for income tax purposes. Kindly use the following instructions:
1. Facts of the scenario
2. Relevant laws and cases
3. Application of laws and cases
4. Conclusion
B. Sanjeev is employed as a marketing manager of the Theatre Hall. He requires to travel extensively during the year for work-related purposes using his car. Discuss the ways Sanjeev might be able to claim deductions for his car expenses. HI6028 Taxation Theory, Practice and Law Individual Assignment T1.2022
QUESTION 2
After completion of your course, you start working at an accounting and tax office. Julia is your first client. She requires to lodge his income tax for 2021/22. She gave her annual income and deduction below. Calculate her Total Assessable Income, Taxable Income, Tax Liability, Medicare Levy and Medicare Levy Surcharge, if applicable, for the taxpayer (Julia) with the information below:
• Julia is a resident single mom with two dependent children (7 and 4 years old) taxpayer of Australia for the tax year 2021-2022
• Her Taxable Salary earned is $109,000 (Including tax withheld), having no private health insurance.
• She had a $11,000 deduction.
• Julia has a student loan outstanding for his previous studies at Sydney University of $35,000.
• Julia’s employer pays superannuation guarantee charge of 10% on top of her salary to her nominated fund.
• Julia earned a passive income of $7,000 from the investments in shares in the same tax year.
Solution
Question: 1
a. Deduction for repairs and maintenance:
Facts of the scenario:
In this case, John has recently purchased a theatre hall which was in poor condition and wanted to repair that portion of the ceiling which would have cost $150,000. But, instead of carrying out the repairs on that portion of the ceiling, John has decided to replace the entire ceiling with different and better materials. This new ceiling will also enhance the acoustics of the building and the total cost will be $150,000. Hence, the issue here is John wants to know whether he will be able to claim a deduction for the replacement of the ceiling that he is doing under the income tax assessment act 1997.
Relevant laws and cases:
The income tax assessment act 1937 deals with the scenarios for assignment help under which deduction will be allowed to the taxpayer under section 25-10 or section 8(1) i.e. the general deduction or the specific deductions. From the facts of the case, it is the case of allowing deduction under repairs and maintenance head and to increase the understanding income tax assessment act 1997 has come up with a 97/23 ruling where previous laws have been referred to and an understanding has been created by the regulations.
As per the clarification, repairs mean making good the defects, or damages to the property or building. The object is returned to its original form in case of repairs and does not lose its originality. Hence, in this case, the only deduction will be allowed under sections 25-10 but if major changes are made to the building or property and the property loses its form, then the deduction under this section will not be allowed. It means that only revenue expenditures are allowed as a deduction, and if any capital expenditure is done to the property, it will not be allowed as a deduction and it will be added to the cost of building, on which the taxpayer can charge depreciation(Barkoczy, 2021 p9(6)).
Hence, the word repairs do not include the word replacement or reconstruction and if replacement is done in its entirety then the same will be treated as a capital expenditure which is not deductible. The same was decided in W Thomas & Co Pty Ltd v FC of T (1965) that the taxpayer will not be allowed to claim a deduction of the expenditure that was incurred on extensive renovations. The High court also stated that expenditure done on the building will not be claimed if, without the certain renovation, the building will not be able to continue as an income-generating unit.
So, it is very important to differentiate between the word repairs, replacement, renovations, and whether a particular expenditure is in the nature of capital or revenue. For instance, if a repair is termed as an improvement, it will not be counted as repair. Also, if the repair changes the character of the building and improves the efficiency of its economic nature, then the same will not be treated as repairs and will not be considered in the revenue nature. It is also said, if the nature of the material used is improved, the changes will be counted as improvement and it will not be considered repairs (Christians, et al., 2018 p5(6)).
Applications of laws and cases:
The ruling and the case law discussed above are applicable in this case as well. John was thinking to repair the part of the ceiling which was damaged, but later he decided to replace the whole part too with better and improved material, which will also improve the acoustics of the place, and as it is a cinema hall it will attract more customers. The ruling has stated that if a farmer is thinking to replace the damaged portion of the fence, it will be considered a revenue expenditure which is allowed as a deduction and the farmer will get the benefit of the deduction. But if the entire fencing is replaced it will be considered a capital expenditure which is not allowed as a deduction. Hence, here, the replacement of the ceiling will not be included in the definition of repairs (Ingram, 2021 p9(1)).
Conclusion:
From the above discussion, it can be concluded that John will not be allowed to take a deduction of the repairs that he had done on the ceiling because first it will be considered as a replacement, and it was not done to make good the damage, but, the entire ceiling was repaired, which will be considered as an improvement, and improvements are not allowed as revenue deduction and will be charged to depreciation. Also, this change has increased the cost of repairs and will increase the efficiency which will increase the economic flow. Hence, this expenditure will not be allowed as a deduction to John as per the Income-tax assessment act 1997, and it will instead be added to the cost of building.
b. Deduction for Work-related car expenses:
Section 8.1 of the income tax assessment act 1997 states that there are certain circumstances where deduction will be allowed for work-related expenses to the taxpayer as a general deduction. The expense will be allowed to be deducted from assessable income when it is incurred to earn the assessable income or to continue with the business or profession it is crucial to incur the expense. But, the expense will not be allowed as a deduction if it is in the nature of capital expenditure or it is incurred to earn exempt income or a particular provision in the act restricts the person from claiming the deduction.
In this case, it states that Sanjeev is employed with the company and his work ask him to travel extensively for work-related purpose using his car. Here, Sanjeev wants to know whether he will be able to claim the deduction on car expenses which he has incurred for work purposes. Hence, after reading the law, it can be said that work-related expenses incurred by the taxpayer are allowed as expenses because they are incurred to earn the assessable income, and they are necessary to earn the income. In this case, the car has been used by Sanjeev for work purposes, and hence, he will be allowed to claim a deduction on the same, but, it is important to notice this expense is not in the form of reimbursement and the employee has paid for these expenses (Allen, 2020 p5(9)).
Also, if the car has been used by the taxpayer for both private purposes and for work-related purposes, then the deduction will be allowed only for work-related expenses and the taxpayer will not be allowed to take a deduction for private use. Also, if the expense is in the nature of capital then the same will not be allowed as a deduction. Travel related expenses will be considered work-related expenses till the time, they are used for business purposes or to earn income. If the work of Sanjeev is travel based, he will be allowed to claim the deduction because he is using his car for travelling for work purposes and not for this personal expense. However, in some cases the travel expense incurred on the way from home to work and vice-versa are not allowed because travelling from home to work is extremely essential and domestic (Legwaila, 2018 p5(2)).
Question: 2:
Calculation of assessable income and tax:
From the above, it can be said that the net tax liability that the taxpayer will be liable for discharge is $33,517. The taxpayer is an individual who has two dependents. The assessable income of the taxpayer will include the income from salary and the passive income earned by the taxpayer. The income tax is charged on the basis of rates that have been prescribed by the taxpayer and the same are as follows:
.png)
Here, the tax will be calculated as follows. For first 45,000 the tax will be 5,092 and for the remaining amount the tax will be (105000-45001) * 32.5% = 19,500. The Medicare levy will be charged as 2% of the taxable income i.e. the income calculated after reducing deductions from the assessable income.
Reference:
.png)
Research
FIN921 Impact of CSR on Corporate Performance Assignment Sample
Task requirements:
1. Must be completed as a group work (2 people) to produce one report.
2. You must build up your own argument from reading the relevant journal articles.
3. You should search for 8 key journal articles, which is relevant to the pre-assigned 4 journal articles provided above.
4. The maximum length of the report (including the title page, abstract, body text, in- text citation and reference list) is 2,000 words. Report outside the scope of word limit of +/- 5% will be penalised with 5% penalty.
5. An abstract of no more than 150 words is to preface thereport.
6. The report should follow the structure including Abstract, Introduction, Body text, Conclusion and the Reference List.
7. Referencing and in-text citation must follow an acceptable academic format using the Journal of Finance referencing style. Please follow the guidelines ("Referencing Guide - Journal of Finance") uploaded on the FIN 921 Moodle site. All sourced material, including direct quotations, must be appropriately acknowledged.
8. Use your own words. Reference wherever necessary. Do NOT plagiarise. 9. Each group makes ONE soft-copy TURNITIN submission only.
Solution
Introduction
Over the last decades, significant research has been conducted on the impacts and challenges of corporate social responsibility (CSR). A growing body of finance research shows that there are several social and economic benefits of conducting CSR activities such as gaining customer loyalty, increasing brand competitiveness and earning better social perception in front of their consumers. Although existing studies offer evidence to support these benefits, it fails to fully explain how these activities directly impact corporate performance in terms of financial stability. Thus, the underlying research question for this review is that is there a direct positive or negative impact of CSR on financial performance of a corporation.
Body
Economic benefits
Several studies find direct evidence of benefits of being engaged in corporate social responsibilities. One of them is that CSR inspires brand loyalty among customers. For example, in the study conducted by Moon et al. (2015), stated that earlier studies on consumers’ corporate association significantly influence the responses for consumer products. According to their findings, customers' perceptions of a company's corporate competence were favourably and substantially linked to their own personal self-concept. The following is their conceptual framework.
.png)
Figure 1: Conceptual framework of Moon et al. (2015)
According to the results of their survey for assignment help , there was a favourable and substantial correlation between consumer CSR affiliations and their social self-concept. In addition, research seems that customers' loyalty to a company's brand is favourably and strongly linked to their personal and social self-concepts. These findings are in accordance with earlier studies.
Similar research was conducted by Huang et al. (2017) which aimed to investigate how service quality and CSR has an impact on customer-company identification (CCI) and what consequences it has on customer loyalty. It is because, as per customer perception, the companies involved in CSR activities offer its customers a feeling of self-enhancement. This research studied how service quality and CSR affect CCI over time to assist managers enhance the efficacy of their efforts to improve CCI (figure 2). In this longitudinal research of restaurant consumers, the researchers used latent growth curve modelling and found that the predictions were supported by the data.
.png)
Figure 2: Conceptual framework developed by Huang et al. (2017)
An identical study by Ajina et al. (2019) identifies the gap in the literature of CSR. Ajina et al. (2019) mentioned that earlier studies on CSR were limited to the study of consumer behaviour; there are limited studies on the measure of consumers’ awareness level and perception on CSR. As stated by Ajina et al. (2019), previous studies majorly assumed that customers are well aware of CSR, however, the research discovered that the awareness among customers is quite low. According to their findings, even though CSR awareness and perception positively impacts CSR expectation, it does not impact loyalty positively. However, customer’s support is positively impacted by CSR expectations which in turn impacts loyalty positively (Figure 3).
.png)
Figure 3: Findings of Ajina et al. (2019)
On the other hand, the study conducted by Boulouta and Pitelis (2014), argues that companies are under growing pressure to adopt or enhance their socially responsible business practices (CSR). There is a moral as well as a strategic necessity to this pressure. According to the moral imperative, corporations have a responsibility to their shareholders, but also to various stakeholders, including the general public, and so they have a role to play in alleviating some of the "ills of globalisation." This idea has been extensively addressed in the literature. A claim that CSR may help companies be more competitive is at the heart of this strategic imperative. Their findings imply that national CSR performance may significantly contribute to increased national competitiveness, which is about equivalent to GDPC in the first instance. Even in nations with a modest level of innovation, it seems to have a greater influence on the economy and society. These nations may be able to make up for a lack of strong national innovation records by using CSR-based differentiating methods. Their findings seem to be in line with other studies in this field.
The research by Moon et al. (2015) used the primary data collection method, the researcher conducted a survey to collect data and to assess the relationship between consumer corporate association and corporate brand loyalty. However, the method was limited due to the fact the participants in the survey had to rely on their memory regarding products and the manufacturer of those products. Huang et al. (2017) research collected data from customers of reputed chain restaurants in Taiwan. Huang et al. (2017) justifies the selection of restaurants for the research by stating that customers can easily develop a personal identification with restaurants as they facilitate characteristics such as design, idiosyncrasy and atmosphere. Similarly, the findings of the investigation by Ajina et al. (2019) confirmed that customers’ awareness regarding CSR activities have a positive impact on the perception of CSR in the customers of Saudi Arabia.
Social benefits
Apart from economic benefits several authors have found evidence of social benefits to conduct CSR activities as well. According to Barnett et al. (2020), it is the obligation of businesses to contribute to the well-being of society as a whole, and this is what corporate social responsibility (CSR) is all about. Companies often take part in a wide range of CSR projects, many of which claim to have a positive impact on society as a whole. Companies, for example, help social change agents by providing them with technology and knowledge. He conducted a cluster analysis of studies conducted on CSR and firm performance and found out that major emphasis has been provided on topics of business ethics, challenges and government.
.png)
Figure 4: Cluster analysis conducted by Barnett et al. (2020)
On the other hand, Murshed et al. (2021) opines that academics and best practices place a high importance on CSR efforts. Its conceptual underpinning focuses on the processes and initial conditions that underlie how workers' knowledge and attitudes about a company's CSR activities impact their job satisfaction. The following are the tenets of their philosophy: (i) workers' opinions of a company's social responsibility activities and their job happiness, and (ii) procedural justice—how a person perceives the fairness of the methods by which choices are made or allocations are established. Procedural justice is a fairness-based approach that the authors believe will have a greater impact on the workers' views of CSR and CSR value to the employee. The study by Murshed et al. (2021) supports its assertions with a survey. The conceptual model was tested using a cross-sectional survey approach. One of their primary goals was to choose a broad group of employees from a variety of sectors, job titles and company sizes. This helps in justifying and substantiating their hypotheses.
In a separate context, it has been observed that gender representation has also impacted firms and it is considered as a significant CSR activity to promote diversity. In the study conducted by Cabeza?García et al. (2018), it was evidenced that only 23% of the board members of the top publicly listed firms are women, according to current statistics, and that number drops to 20% in Spain. There is still a long way to go, but since the European Commission first placed this problem on the political agenda in 2010, there has been a considerable gain of 11 percentage points.
Impact on firm performance
There is multiple evidence that show that there is a direct financial challenge for engaging with CSR activities. Consistent with the findings of the prior study, Rhou et al. (2016) argues that A growing number of businesses are concerned about corporate social responsibility (CSR) since they are judged not just on their financial success but also on their social impact. Consumers in the 20- to 35-year-old age bracket, known as "millennials," frequent restaurants in greater numbers than any other demographic. These diners base their choice of restaurant on more than just the quality of the food; rather, they base it on how they feel about the restaurant's social responsibility as well. The authors support their data with secondary sources such as restaurants’ annual reports and CSR statistics. According to their findings, CSR initiatives have a favourable financial impact on restaurants only if they are well publicised, according to the research. Positive CSR operations will not provide financial rewards if firms fail to interact with stakeholders. There are 0-10 levels of positive CSR, with a mean of 1.507, whereas there are 0-13 levels of negative CSR, with an average of 1.640. The number of articles that mention a company's CSR efforts positively has a mean value of 2.604, with a range of 0–41 (Figure 5).
.png)
Figure 5: Findings of Rhou et al. (2016)
In their study, Alikaj et al. (2017) state that CSR and financial success have not been conclusively linked. When it comes to financial success, for example, there is evidence that social responsibility might have an adverse effect. A study of the paper industry indicated that companies with pollution controls performed worse in terms of ROE and ROC than those who didn't apply pollution controls. Several studies have indicated a negative correlation between the two. The authors back up this argument by demonstrating that the additional costs associated with being socially responsible might place a company at a financial disadvantage when compared to companies that do not take such measures. KLD social responsibility metrics were shown in this study to be connected with greater ROE, ROA, and ROS for 469 of the Fortune 500 businesses analysed by the authors of this study.
In this aspect, it becomes essential to underline that providing profits to investors is imperative for any firm. Greenwood and Van Buren III (2010), argue that the moral treatment of stakeholders depends on the trustworthiness of the connection between the firm and its stakeholders. Once a stakeholder accepts a financial investment, the company has an obligation to do all in its power to maximise that shareholder's gains (or limit their losses). The phrase "investment" is used here to refer to everything that is useful to the company's operations, including personnel, financial resources, and a place to operate. Because the corporation has more power than the stakeholder, it can't be relied on to deliver the aforementioned advantage to that stakeholder consistently. The moral quality of trustworthiness has a direct correlation to the degree to which a company's actions may be relied upon. With the help of these findings, they develop a split trust continuum. According to the authors, there is a qualitative difference between the existence of mistrust and the lack of trust. In contrast to a single trust continuum, shown in Figure 6, a divided trust continuum is shown. This finding suggests that in order to calculate the "distrust-lack of distrust" scale, both the agent's behaviour predictability and the principal's degree of suspicion must be considered.
.png)
Figure 6: Split trust continuum developed by Greenwood and Van Buren III (2010)
Contrary to popular belief, the work of Pope and Lim (2017) suggest that the structure of CSR has a direct connection with firm performance. In their work, they suggest that the mobilising structures of international organisations impact the spread of knowledge and the subsequent perception of its performance. On the basis of empirical evidence, we concentrate on company engagement in international business organisations that promote corporate social responsibility (CSR). The authors speculate on how these global CSR organisations affect both corporate participation in CSR frameworks and public perceptions of the quality of CSR activities.
Su et al. (2020) has raised the question of whether CSR improves corporate financial performance (CFP) has significant effects on how a company decides to prioritise CSR. as stated by Su et al. (2020) academics and the business world are becoming more interested in CSR in growing economies like China. Su et al. (2020) mentioned that organisational behaviours differ across companies in developed markets and emerging nations. As a result, it may not be appropriate to mechanically extrapolate CSR findings from developed economies to emerging markets.
Conclusion
After conducting a thorough literature review and developing common themes such as social and economic benefits of CSR along with the impact of corporate performance, it can be concluded that there is no disagreement among the authors that CSR significantly influences the perception of not only consumers but also employees as they feel more motivated to work for a firm whose value and ethics are aligned with their personal ethical standpoint. However, there is still a significant gap in literature regarding the impact of CSR on firm performance and there is further scope of research in the area where financial ratio analysis can be done to identify the ROI and cost of CSR for an organisation.
References
.png)
Research
MBA403 Financial and Economic Interpretation and Communication Assignment Sample
Assessment Instructions
• Students will select an ASX listed company that has currently published financial statements which meet accepted standards of financial reporting.
• The report is limited to 2000 words (+/- 200 words), excluding the title page, bibliography and appendices.
• The report is to be formally written as per Resource A below.
• The report is to be submitted via Turnitin.
Resource A – Financial Management Report and Content
Executive Summary
• The executive summary provides an outline of: the company background, the stakeholder the report is aimed at and the purpose of the report. It also includes a brief statement of the recommendation(s).
• The executive summary should be approximately 10% of the total word count.
Key Performance Indicators
• Present and concisely discuss key financial results and trends.
• Calculate and present relevant financial ratios.
• Present and concisely discuss non-financial and sustainability indicators.
• Consider using an appendix for extensive data tables or calculations.
Interpretation and Insights
• Explain the causes of the changes in the company’s financial performance.
• Interpret your financial ratios.
• Analyse the non-financial indicators and the company’s sustainability and/or ethical performance.
• Consider the company’s strengths, weaknesses and opportunities. Alternatively, consider the company’s business strategy, competitors and outlook.
• Reach insights on which to base your recommendation(s).
Conclusion and Recommendation
• Present the significant outcomes from your analysis.
• Clearly state an actionable recommendation(s) for your stakeholder. For example, if the report is written for a potential shareholder, recommend a decision to invest or not invest in the company. Alternatively, if the report is written for an internal manager, make a specific recommendation in order to improve the financial performance of the company.
• Justify your recommendation(s).
• The Conclusion and Recommendation should be approximately 20% of total word count.
Bibliography and In-text Citations
• The Academic Integrity and Conduct Policy requires the appropriate use of in-text citations and a bibliography. You must correctly cite all references (information sources) and comply with the expectations for academic writing.
• The bibliography and citations are excluded from total word count.
Solution
Introduction:
The objective of this report for assignment help is to present a detailed understanding of BHP, which is one of the leading mining Companies listed on ASX. In this report, the key performance indicators of the company and changes in a recent financial year will be elaborated (bhp.com. 2022). At the same time, the financial performance of the organisation will be evaluated by applying an appropriate range of financial ratios, and the same would be compared with Rio Tinto for a better understanding of the financial position. The report will also analyse the non-financial and strategic factors which should be considered while making investment-related decision.
Key performance indicator
Financial results and trends:
In the recent financial year, the sales revenue of the company has significantly increased. The revenue of the company was 42931 in 2020, which increased to 60817 million in 2021. The EPS of the company has also improved from 157.3 to 223.5 US cents. However, there was a small increment in total assets and net assets. In the recent financial year, the company has significantly managed from 12044 in 2020 to 4121 million, which indicates the overall gearing position.
Calculation of the financial ratio
.png)
The summary table of calculation is provided above, the detailed calculation is provided in appendix.
Non-financial and sustainability indicator
Along with developing the existing businesses, the company is also investing heavily in the environmental and social programs, which is also increasing the performance of the company.
In addition to that, the company has identified their performance for the future, and the company has developed a business merger proposal to create a global top 10 independent Energy companies. At the same time, the company is willing to unify the corporate structure for flexibility to operate in the future.
Interpretation and Insight
Explanation of the causes of changes in the company's financial performance
Considering the business analysis for the company to identify BHP is one among the company that is willing to have an absolute market-leading strategy by investing in future businesses. Considering the energy and commodity needs of the business, the company has acquired various investments and areas of interest for their mining businesses. The company's performance for significantly impacted because of the covid-19 pandemic, with the Global economic work sustained because of the government restrictions and the Highly Effective covid-19 virus. However, in the next financial year, the company has identified significant growth in the recent financial year because of a substantial increase in the Global energy need. In addition to that, the company is investing heavily in the renewable energy business directly and indirectly. The company provides metal copper, Nickel and others, which is helping the renewable energy and electric vehicle business by supplying quality copper, Nickel and others.
Interpretation of financial Ratio
Profitability ratios:
Operating profit margin:
The operating profit margin of the company will speak about the operating profit-earning capacity in comparison with the revenue, which will indicate the earnings generated by the organisation from its business. The operating profit of BHP Billiton was 34% in 2020. However, with a significant increase in revenue by almost 42%, the operating profits of the company have increased to 43%. The increase in operating profit margin suggests that the overall profitability aspect of the organisation is providing a substantial value return against the revenue (Hushko, Temchenko and Kryshtopa, 2020).
.png)
Net profit margin:
When it comes to performance and profitability analysis for any organisation then, the net profitability of the business becomes the most influential factor. In the financial year 2020, the net profit margin of BHP Billiton was 20% which increased to 22%, suggesting an implement internet profitability by 9% compared to the previous financial year. Even though the operating profitability of the company has increased by almost 27% in the recent financial year, the increment in net profitability is comparatively low because of substantial payment of financial expenses and tax-related obligations.
Gearing:
Debt to Equity ratio:
The debt-to-equity ratio of the company will suggest a gearing position by comparing the total debt against the equity. As per the recent financial statement is identified that the long-term debt to equity ratio of the company was 0.12 in 2020, which is for the decrease to 0.07 in 2021 because of significant repayment of long-term borrowings.
.png)
Interest coverage:
The interest coverage ratio is and financial and solvency Indicator which will analyseanalyse the interest payment capacity of the organisation. To calculate the interest coverage ratio, the operating profits are compared with the financial expenses. In 2020 the interest coverage ratio of the 11.43 times which has increased to which has increased to 18.8 times Because of the substantial increase in operating profitability in comparison with the financial expenses (Kawani and Abdal, 2020).
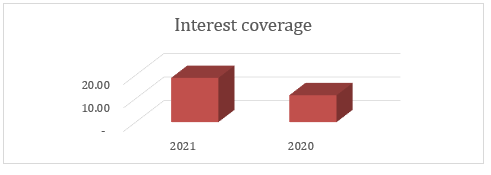
Liquidity:
Current ratio:
The current ratio is one of the important security measures for any Organisation in feature comparison between the current assets and current liabilities are recorded (Ikegawa, 2020). Under general preference, the current ratio of more than two is highly liquid in nature; however the current ratio to trend is expected to change based on the industry. In the financial year 2020 the current ratio of BHP Billiton was 1.45 :1. In 2021 because of the increase in current assets by 24% the overall current ratio of the company has increased to 1.63:1, resulting and improvement in the liquidity position.
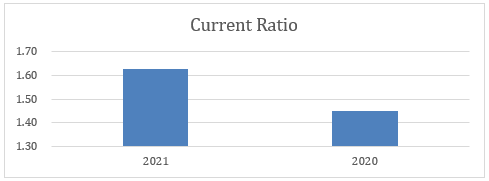
Quick ratio:
In the case of mining companies, a significant stop is remained in hand in the form of inventory there for the quick ratio is calculated to determine the real-time solvency status of the organisation by comparing the current assets after deducting the inventory with the current liabilities (Kusmayadi, Rahman and Abdullah, 2018). The quick ratio of the company was 1.37 :1 in 2020, Which has increased to 1.54:1 in the next financial year. The increase in the current ratio in the quick ratio indicates that the overall liquidity position of the company is a is preferable position.
.png)
Asset Management:
Trade receivable turnover:
The trade receivable turnover is a significant Asset Management ratio for the company which indicates the efficiency of the company in managing their credit sales and connecting the dues from the customers (Amanda, 2019). The trade receivable turnover for the company was 12.76 times in 2020 which has deteriorated to 10.04 times in 2021. The reason behind the decrease in interest receivable turnover for the company is because of the increase in account receivable outstanding balance which indicate that the company is extending their credit facility to their customers (Hertina and Saudi, 2019).
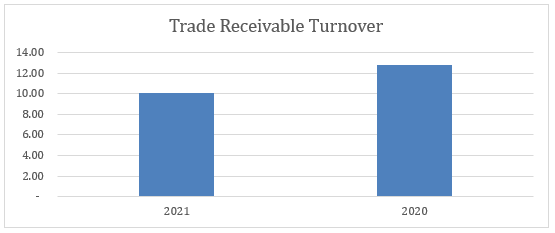
Return on assets
The return on Assets and other Asset Management ratio which indicates the efficiency of the organisation to generate revenue and profit against their total assets (Amanda, 2019). In the financial year 2020, the return on assets for the BHP Billiton was 8% only, which has increased to 12% because of the substantial increase in the net profitability by 54% against which the total assets have increased by 23%.
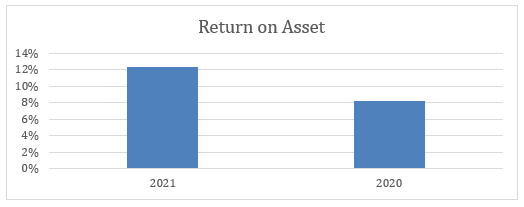
Analysis of the non-financial indicators for the company's sustainability
Beside The financial factors of the company then on financial factors which is impacting the sustainability of the company is also indicating greater efficiency and control of the business. For instance, the company has identified the material sustainability issues, namely the employee management, considering the environmental matters, the social and Human Rights obligations for the company, implementing anti-corruption and ant bribery matter and others. In all those expect the company has initiated significant policies and Standards which is enacting the code of conduct that the management should perform in all those matters. In the page 33 of recent annual report the company has also identify the principal risk related to the sustainability issues and it has indicated the non-financial key performance indicators for those risk which is improving the company’s understanding and managing the business affairs (Mulyadi and Sihabudin, 2020).
SWOT analysis for the BHP
In this section of the report the strength weakness opportunity and the critical risk factors will be discussed with the help of SWOT analysis Strength:
? The BHP Billiton is having access to the diversify portfolio of natural resources which is providing them stability in operating in this industry
? The constant from financial performance and increment in revenue is providing additional strength to the company and its shareholders
? The international presence of the company is another important factor which is working in favor of the organisation
? The minimum leverage position is providing the company a substantial growth opportunity without impacting its solvency status (Purnomo and Tjendrasa, 2020)
Weakness
? Even though the recent performances of the company are expanding rapidly but the previous performances and profitability of the company was more lucrative than it is earning today
? Most of the company's revenue is dependent on very few countries like China, therefore if there is volatility and a decrease in demand in those countries, the company's overall performance will be impacted.
Opportunity
? The company has initiated significant merger and acquisition strategies which is helping in expanding their operation.
? The company is also willing to invest in the innovation and Technology businesses to enhance their future performance
Threat
? The international political scenario specially between the west vs Russia and China is impacting the global economy.
? The fluctuation in foreign currency translation is impacting the company's profitability
Company's business strategy
The business strategy of BHP Billiton is that identification and Exploration of various area of interest and developing the areas from which the company can explore the mining or and reserve. In addition to its own Research and acquisition of the area of interest the company also acquire the small-scale companies who is having access to different mining assets at the same time the company is expanding their product portfolio to the items which can be used for the electric vehicle and renewable energy businesses.
Competitors and Industry Outlook
The current comparative performances of the companies engaged in the same sector is also having a substantial revenue growth for instance The Rio Tinto which is another recognise mining company in Australia and having operations across USA and the world, has recorded a revenue growth of 77% in 2021 and the company has generated 36% net profit against their revenue which indicates high profitability position (Riotinto.com. 2022). In addition to that after the covid-19 pandemic When the Economist are getting restore the demand for the energy and raw materials for the various Industries is keep on increasing which will be beneficial for the company (Hushko, Temchenko and Kryshtopa, 2020).
Insights on which the recommendations should be initiated
Even though the company's overall performance is substantial, and it is growth prosperous the company will have to work on the following aspects
? Net profitability
? Improvement in accounts receivable management
? Improving the product portfolio and diversification of the business.
Conclusion and Recommendation
After conducting the financial analysis for the BHP Billiton for the recent financial year and comparing it with the previous financial year it is identified the company's growth opportunity in terms of revenue and profitability is significant compared to the previous year. However, the competitor companies like the Rio Tinto are Providing more value returned to the investor in terms of higher net profitability and operating profitability. In addition to that, the accounts receivable turnover for the Rio Tinto has increased significantly in 2021 compared to the previous financial year which indicates that BHP Billiton is required to improve their accounts receivable management strategy. The non-financial indicators and the SWOT analysis for the company is indicating that the oval performance of the organisation is growth process however the concerns over the strategic objectives for the organisation is required to be initiated with efficiency otherwise it will have a significant consequence. As of now in the company will be recommended to improve their net profitability because the differences between the operating profit and net profit is substantial and which is because of the financial expenses and Taxes.
Reference:
Research
HI5002 Finance for Business Assignment Sample
Assignment Brief
Word limit 3,000 words ± 500
Due Date Final Submission of Group Assignment: Week 10
ASSIGNMENT SPECIFICATIONS
I. Assignment Tasks
This assignment task is written reports that include 3 parts:
Part 1: Reflective journal of one assigned topic among 9 first topics of the course.
Part 2: Fact finding of securities market in Australia.
Part 3: Capital Budgeting and Project Evaluation.
II. Contribution of group members
Each group needs to ensure that members are equally contribute in group work (10% each for a four-member group). Non-responding and non-contributing members need to be reported by groups to Unit Coordinator for removal from the groups before week 10.
Percentage of contribution and tasks (for example: Part 1. Question 1 and 2) done by each group member must be agreed by all group members and specified clearly in the table of Information for HI5002 Group Assignment
III. Assignment structure and questions
The assignment should cover the structure and contents described below.
Introduction
A brief introduction of your group’s work: the purpose of assignment, key findings and structure of the assignment (not more than 150 words)
Part 1. Reflective journal of a selected topic among 9 first topics of the course (13 marks)
Your group is required to write a reflective journal of what you had learnt in a tutorial session that covers one assigned topic among 9 first topics of HI5002 course. Once your groups are formed on Black Board, you need to contact HI5002 Unit Coordinator to get the topic assigned to your groups.
The following requirements must be met for this Reflective Journal to be marked:
1) Correct name of the assigned topic as per syllabus, lectures and tutorials must be provided
2) Correct time, date and name of the lecturer who delivered the tutorial session should be provided.
3) Evidence of your discussion with HI5002 Unit Coordinator on the assigned topic for Part 1. Reflective Journal: screen shots of email exchanges submitted in an appendix to your assignment.
To complete the reflective journal, answer the following reflective questions:
Reflective questions:
Question 1: What are the financial concepts you have learnt in the session? Briefly explain the concepts? (please note that only list the financial concepts discussed in the interactive tutorial session, not all the financial concepts discussed in the recorded lecture) (3 marks)
Question 2: What are the important issues your lecturer reminded you to note down and pay your special attention to regarding the financial concepts/formulas/calculations/skills/techniques you have learnt in that session? (5 marks)
Question 3: How many practice questions did you work on the class with your lecturer? Briefly summarize the content of that questions and what you have done with your lecturer in practicing with those questions. What are the problems did you encounter when you worked on that practice questions? (3 marks)
Question 4: How can you potentially apply what you have learnt in that class in your real life? (2 marks)
Part 2. Fact finding of securities market in Australia (10 marks)
You are required to go to Online Portals of ASX and ASIC, explore the data and information in the portals and perform the following tasks:
Task 1. Search for guidance of ASX on securities listing and answer the questions assigned to your groups. Students are required to attend the tutorial session in week 9 to get the guidance from lecturers about which questions they need to answer in this Part. This information will not be available in tutorial solutions (3 marks).
Task 2: Search for guidance of ASX on ASX participants and answer two questions assigned to your group. Students are required to attend the tutorial session in week 9 to know what are the questions you need to answer in this Task. This information will not be available in tutorial solutions. (3marks).
Task 3: Search for information in the ASIC Portal for Finance Professional and answer the questions assigned to your group. Students are required to attend tutorial session in week 9 to get the guidance from lecturers about the questions your group will need to answer in this Task. This information will not be available in tutorial solutions. (2 marks)
Task 4: Search for information in the ASIC Portal for Consumers and answer the questions assigned to your group. Students are required to attend tutorial session in week 9 to get the guidance from lecturers about the questions your group will need to answer in this Task. This information will not be available in tutorial solutions. (2 marks)
Guidelines – Adapted Harvard Referencing
1. Reference sources in assignments are limited to sources which provide full text access to the source’s content for lecturers and markers.
2. The Reference list should be located on a separate page at the end of the assignment and titled: References.
3. It should include the details of all the in-text citations, arranged alphabetically A-Z by author surname. In addition, it MUST include a hyperlink to the full text of the cited reference source.
Solution
Introduction
In this report, there will be a discussion on topic 7 of the course. While discussing that topic, many things will be considered, such as the lessons learnt, essential points discussed, and many more. Apart from that, questions are being answered that were asked about ASX and its operations for finance assignment help.
Part 1: Reflective journal
Question 1
The two main topics discussed in the Interactive Tutorial Session Week 9 – topic 7 are incremental cash flow, value drivers, and scenario analysis. Incremental cash flow is the additional cash flow that a firm can generate from a new project (CHENG, 2021, p251(1)). Therefore, incremental cash flow is the difference between the cash flow of the firm with the project and the cash flow of the firm without the project. In the incremental cash flow, a number of things need to be ignored and considered. Sunk cost, overhead cost, and interest payment are the three things that are required to be missed.
On the other hand, working capital investment should be considered because it will lead to an increase or decrease in the cash flow of the company. The opportunity cost should be considered as well because there could be a difference in cash flow due to the different opportunities that the company has possessed (INDAH and KARPRIANA, 2021, p3(5)). The sunk cost is required to be ignored since it has been incurred already and will not be recovered. The value drivers assist the managers in refining the forecasts as well as making corrections to the project. For instance, variable cost per unit could be a value driver that could increase or decrease the cash flow depending on whether it has increased or decreased. Scenario analysis can be reframed to be stated as situational analysis, where changes in the value drivers of a project change the forecasted cash flow of the company. There can be worst-case or best-case scenarios. In the case of a worst-case scenario, the value drivers, such as cost, will increase, which will ultimately decrease the cash flow. On the other hand, in the best-case scenario, the cost could decrease, or the sales might increase, which would increase the cash flow. The worst-case and best-case scenarios will also consider the base case.
Question 2
The lecturer put an emphasis on the things that are required to be ignored and considered during the calculation of incremental cash flow. She had given important examples of sunk cost, which is market research cost. One of the important things that she had asked to focus on was an example of sunk cost based on Toyota company. She stated that suppose Toyota is trying to launch a new product. However, before launching the product, the company had conducted market research that cost the firm 200000 dollars. Therefore, this market research cost is a sunk cost since it cannot be recovered. This example is an important one because it will help us understand what sunk cost is in relation to the business world. While discussing the things that are required to be considered during the incremental cash flow, one of the things that she explained and asked us to pay attention to was opportunity cost. She emphasized the concept by examples of how there could be a different amount of cash generation due to the different decisions being taken by the company.
The lecturer also discussed the scenario analysis, where she discussed the worst-case and best-case scenarios. While discussing that segment, she also mentioned that during the sensitivity analysis, there is no requirement to calculate the base scenario again, thus making the calculation simpler. The lecturer had given the emphasis on the analysis of the worst case and best scenario. She explained that if, in the worst-case scenario, the NPV is 0, then the management will consider the project. It must be kept in mind that even though the NPV is 0, it is 0 in the worst case; therefore, it will definitely be high when the scenario is the base case or best case (ILLÉS, 2020, p41(1)). She asked us to pay attention to the fact that in the case of very low NPV, the company will be considering taking alternative actions that would reduce the probability of the worst case.
Question 3
There are a number of short questions being discussed in class. The quiz consisted of 10 questions, out of which there were five questions that were filled in the blank format, and the other five were true or false questions. For instance, question 7 of the quiz asked whether or not inventory turnover is one of the value drivers of a company. Question 10 asked whether or not the fixed or indirect cost varies with the increase or decrease in sales revenue. Similarly, there were other questions being asked. Apart from these small questions, there was a numerical question based on scenario analysis. In the scenario analysis, it was asked that there is a company that is considering a project where products will be sold at an average price of 25 dollars per unit. The company has assumed to sell 200000 units annually for the upcoming five years. Also, there is an estimate of the investment that the company would require to start the project has been stated. The total cost amounts to 1.5 million dollars. Other information about the residual value and working capital has been given as well. The depreciation method, variable cost per unit, fixed cost, rate of discount, and rate of tax have been disclosed as well. There are two scenarios that have been taken into consideration which are best case and worst case. In the worst-case scenario, the annual sales and price per unit have decreased, and the fixed cost and variable cost per unit have increased. In the best-case scenario, the sales and selling price have increased, and the variable cost and fixed cost have decreased. During the discussion of this question, the lecturer asked us first to calculate the NPV of the project based on the base case. After the base case results were found, she emphasized how the best- and worst-case scenarios should be taken care of. Firstly, the unit sales decreased to 150000, and the price per unit decreased to 23 dollars. The cost increased as per the given information. Then NPV in the worst case was calculated. After that, the best-case scenario had to be considered where the unit sales were increased to 250000, and the unit selling price was increased to 28 dollars. The NPV was calculated, and it was found that the NPV in the worst case is really low compared with the best case. One thing that the lecturer wanted us to focus on was that the discount rate and tax rate would remain the same. One of the problems that I encountered during the solving of the question was whether or not the fixed cost increased by 50000 dollars in the first year, and then it remained the same for the other years. Apart from that, the lecturer made us understand the question really well. Hence, I did not face any problems.
Question 4
In real life, I want to work in the finance department of an organization; therefore, this kind of knowledge about incremental cash flow or scenario analysis will help me strategize. For instance, in the future, when I get the opportunity to make a decision on behalf of the firm on whether or not the company should make an investment in a potential project. At that time, I will be calculating the NPV of the project, and in addition to that, the best case and worst case will be calculated as well. Therefore, I will have comprehensive data on the change in the NPV of the project based on the changes in the value drivers. Also, I will be better at identifying how different value drivers affect the NPV of the company. In doing so, if there will be any value driver that is required to be focussed more often by the company, then I will be considering that and make changes accordingly.
Part 2: Fact findings of the securities market in Australia
Task 1
Seven-step listing process
The seven steps for listing in the ASX are discussed below:
Step 1: Appointing advisers
A team of advisers who are experienced in the listing of stocks must be considered. The team of professionals will have a manager, lawyer, and accountant. The time required for this step is one week.
Step 2: Preparing for the IPO
This step will include drafting the prospectus, listing the application, and documents that are necessary. In some cases, the company can also have to apply to the ASX for the in-principle advice to gauge the company's suitability for listing in the ASX. The time required for this step is nine weeks.
Step 3: Commencing institutional marketing
As per the corporation's act, there is a limitation in the advertisement of IPO before the company can lodge the prospectus with the ASIC. The time required for this step is three weeks.
Step 4: Lodging the prospectus with the ASIC
From the date of lodgement, a seven-day period known as the exposure period starts. During that period, the prospectus of the company is being prepared. The prospectus becomes available to the public, and the firm will not have the right to accept any application under that offer. The exposure period can be extended to 14 days by the ASIC. The time required for this step is two weeks (Australian Securities Exchange, 2022).
Step 5: ASX will process the listing application
The company will have to lodge the formal listing application with ASX within seven days of lodging the prospectus with the ASIC. The time required for this step is six weeks.
Step 6: Offer starts, and the company will commence marketing to the retail investors
After the exposure period, the offer to the retail investors will be made. It is open for five weeks. This process takes 3 to 5 weeks.
Step 7: Offer closes, and the process of listing on ASX commences
The offer of the company closes, there is the allocation of shares, and the company is listed on the ASX (Australian Securities Exchange, 2022). After this, the trading of the company on the ASX commences. The estimated time required for this process is two weeks.
Task 2
(1) Securities lending
Securities lending is a way of loaning shares, derivatives, commodities, and many more to other investors or companies. Securities lending will require the borrowers to put up collateral in the form of shares or cash, or a credit letter. When the shares are being loaned, then the title and ownership of the shares are transferred to the borrowers as well. A fee for the loan, which is also known as the borrowing fee, is being charged to the company as well by the brokerage to the client who is borrowing the shares in addition to the interest charged for the loan.
(2) Non-settlement days
As per the ASX settlement rules, a business day implies a day apart from Saturday, Sunday, Good Friday, and any other day that the ASX Settlement has notified (Www2.asx.com.au, 2022). Therefore, the non-settlement days are the days when ASX will not be conducting any business. If ASX has declared that on 1st of October is an ASX Settlement Non-business day, then that day will become an ASX non-settlement day when it will not operate for the market.
Task 3
General obligations of Australian financial services licensees
Any Australian Financial Services Licensee need to follow some general obligations under s912A (1) of the Corporations Act 2001 (Corporations Act). Following are the obligations that are needed to be followed:
• Do all the necessary things that will ensure the efficiency, honesty and impartiality of all the financial services covered by the licence are provided to the licensee s912A(1)(a));
• Having a proper and sufficient amount of management in order for any sudden rise of conflict of interest in relation to the actions or activities followed in the provision of financial services by the licensee or their representative. (s912A(1)(aa));
• Acting according to the conditions given on the licence of a licensee (s912A(1)(b));
• Acting according to the laws of the financial services (s912A(1)(c));
• Taking proper measures that will ensure the compliance of the representative (insurance providers) with the financial service laws. (s912A(1)(ca)) (Www5.austlii.edu.au, 2022);
• Keeping in hand enough financial, technological and human resources, those will provide the financial services covered by the licence of the licensee and take responsibility for the supervision (s912A(1)(d)).
The following obligations will not be applicable if a person is supervised by the Australian Prudential Regulation Authority (APRA) unless the person is the holder of an ARPA license and they have been provided with the authority to operate managed investment schemes.
Task 4
Reverse mortgage
A reverse mortgage is basically a financial agreement that lets the older people of Australia hand over equity in their home in exchange for regular payments that can be considered retirement income (Asic.gov.au, 2022). The repayment of such a loan is not expected sooner until the person receiving the mortgage leaves the house or dies. A reverse mortgage is 2% more expensive than a general home loan, and the interest upon the amount is calculated as compound interest because the chances of repayment are almost none. According to ASIC, the rate of demand for Reverse mortgages has increased since the global crisis earlier, which was $1.3 billion in 2008, that increased to $ 2.5 billion by 2017. The people who were borrowing money as a loan have very less knowledge about the risks and the interest amount, they would have to pay in their future, and that would make them financially weak to lead their future needs. A reverse mortgage works opposite to that of a loan, where the borrower pays money to the homeowner. The owner gets an approximate amount of monthly income to live his life and meet his needs. The choice of payment option is made by the owner, and they need to repay the interest percentage amount in the principal amount provided by the money lender. Over time as time passes, the debt amount of the owner keeps on increasing, and the equity of the house goes down gradually.
Part 3: Capital budgeting and project evaluation
3.1. Capital budgeting decision making
Considering the given case scenario, it is identified that the company should adopt the net present value analysis to select the equipment that it should purchase. Based on the case study, no income-related information is provided there for the project, which has the minimum net present value regarding the expenses that should be selected by the organization if the income is indifferent in both cases. The reason behind the net present value analysis is based on the following aspect.
Pros:
? The net present value analysis considered the investor's earnings requirement for making the investment.
? Secondly, under the net present value analysis, the critical aspect regarding inflation, change in product output, sales price, variable cost, and other expenses are included in the decision-making process, which enhances the result (KIM et al., 2021, p47(2)).
? The net present value analysis provides a pivotal decision-making process because if the net present value of the project is not positive, then it should not be invested; on the other hand, the other capital budgeting techniques and tools depend on comparisons.
Cons:
? To calculate the net present value, the discounting rate is required to be calculated; however, there is no defined parameter to calculate the discount rate. Most organizations consider the cost of capital as the discount rate; however, the change in capital structure and the market environment will change the discounting rate applied at the time of selecting the project (CHUNDI and SHILPA, 2022, pp68(1).
? Secondly, under the net present value analysis, the investment size is not considered, which is conducted in the internal rate of return and the payback period to determine the preferability of a particular project.
Based on the calculation and the net present value analysis, it is identified that the cost of Project A is comparatively lower than the present value of the total cash flow of Project B. Hence the company should select Project A.
See Appendix 1:
3.2. Risk analysis and project evaluation
Base case scenario
Under the base-case scenario, if it is assumed that the company's assumptions are correct, then the project will generate a net present value of $19225678. Therefore, at a discounted rate of 12%, the company can easily select the project because it is delivering more than the investor's requirement.
.png)
.png)
Worst Case scenario
Under the worst-case scenario, the company has encountered a decrease in production units by 10% along with a decrease in sale price by 10%, whereas the variable cost and the fixed cost of production increased by 10%, which is impacting the contribution and the net profitability. Even after those adjustments, the proposed project has a positive net present value of $13445960.39. Therefore, the company can select the project for investment because it is delivering more than the required profit in different adverse scenarios.
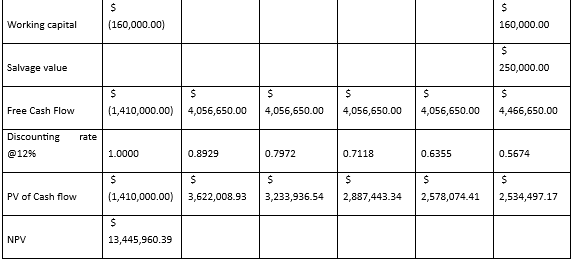
Best case scenario
In the best-case scenario, when all the preferred assumptions in terms of unit sales price, variable cost per unit, and the fixed cost per annum are in favor of the organization, the company's net profitability is expected to increase because even in the base case scenario the company has delivered a good amount of net present value. Dissimilar identification is made in the case of the best-case scenario where the company’s net present value has increased to $25835576.
.png)
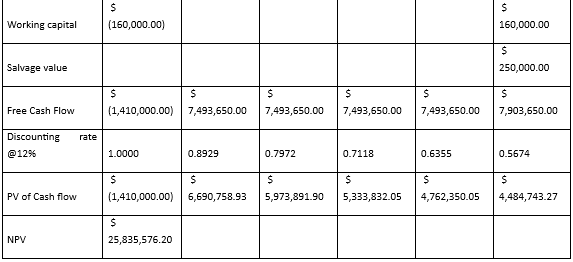
Based on the calculation and the discussion, it is identified that the potential project is sensitive to the business movement; however, even in adverse situations, it delivers a good amount of profit to the investors in comparison with its discounting requirement; therefore, the company can easily select this project for the investment purpose (FA, SHAO and LAN, 2021, pp 7(2)).
Conclusion
Based on the discussion above, it is evident that the things that were taught in topic 7 were extremely important in the practical life of a person. Learning about scenario analysis has made me realize that I can use this knowledge in my day-to-day life as well when I invest in anything. Apart from that, the discussion on the other questions is an indication that the steps taken to list a company in the ASX are simple if the team who is responsible behind is very efficient. Also, the discussion has helped me understand a number of concepts that can potentially help me in the future.
References
.png)
Research
FIN2SEV Investment Securities Assignment Sample
Assessment Brief
Guidelines:
You are to prepare a written research report on Cochlear Ltd (COH).
The report must:
• be no longer than 10 pages (not including the front over and contents page, if any). You may also include an appendix no longer than 10 pages. There is no minimum font size because that will depend on the font, but if the font size is too small you may lose marks
• be your team’s original work.
• be properly cited when applicable.
• include in the first page’s header the following information:
• Company name
• Ticker symbol, and exchange
• Sector/industry
• Current price (as of .......date)
• Recommendation (Buy/Hold/Sell)
• Target Price
Suggested structure for the report (you may also add additional headings if necessary):
• Investment Summary
• Business description
• Industry analysis and competitive positioning
• Financial analysis
• Valuation
• Investment risks
Investment summary
This section should include a brief description of the company, projected earnings estimates, valuation summary and the rationale for the recommended investment action.
There should be a clear and succinct explanation as to why the security should be bought, sold, or holds.
Business description - This section should detail the company’s products and markets. It should also provide a clear understanding of the company’s operations and its key drivers of revenues and expenses.
Industry analysis and competitive positioning - This section should include a competitive analysis of the industry. Key economic drivers, external factors and competitive forces should be addressed when relevant.
This section should also provide a group of peers operating in the same industry for the purpose of competitive analysis. Some insights regarding company’s competitive positioning should be included in this section.
Financial analysis - This section should include a thorough analysis of the company’s historical financial performance, and a forecast of future performance. The assumptions for forecasted figures should be clearly explained and strongly supported.
Valuation - This section should include a detailed valuation analysis using appropriate model and application. Absolute valuation (Discounted Dividend Model, Free Cash Flow Model or Residual Income Model) can be used in combination with Relative Valuation (P/E ratio, EV/EBITDA, etc.) as a way to check the validity of the final output.
Investment risks - This section should address potential adverse events that may affect industry’s and company’s performance. Risks can stem from operations or external factors such as regulation or environment.
Solution
Investment summary
Cochlear Limited delivers and manufactures cochlear implants to approximately more than twenty countries throughout Middle East, Africa, America, Asia Pacific, and Europe. The company provides three primary products that are Cochlear accessories that are wireless, implants of Baha bone conduction, and cochlear implants (Cochlear Ltd 2020).

Valuation date: 06/05/2022
Ticker: COH
Sector: Biotechnology
Stock exchange: ASX
Headquarters: Melbourne
Current price $190.22
Target price $222.27
Recommendation: BUY
Cochlear has established its products and surgeries after immense R&D and the current valuation of the share stands at $190.22 per share. However, with the optimized balance sheet and performance the recommended rating is $222.27. This is due to the fact that balance sheet is intact and total assets are sufficient to honour the liabilities. There is no shortage of cash and the company will not face any shortage of resources. The profit scenario of the company changed in 2020 followed by the aggregate investment of the company that increased at a positive rate from 2014-2020 signifying the company is vouching towards capturing of more market share. Thereby, a BUY recommendation has been allotted for Cochlear Ltd.
This recommendation is significantly driven for assignment help
Business description
Marketing situated at NSW (Macquarie University), the company every year expends around $180 million towards research and development initiatives. Apart from this, they are also indulged in around hundred collaborative segments. Further, the company is regarded as an international leader in ear implantations, and selling products in more than hundred nations and pursing offices throughout the globe with the usage of just 4000 employees (Cochlear Ltd 2020). The product is supplied to more than 100 countries. Over the past ten years growth has been significantly effective owing to enhanced awareness by people of older people who are basically the target audience, because they are likely to be encountering hearing loss. The company is trying hard to focus towards markets that are undeveloped.
Business summary
.png)
(Cochlear 2020)
This aforesaid chart highlights how cochlear firmly believe that they can continuously develop through penetration of increased nature of such underdeveloped markets especially children. Additionally, attempt to raise extra awareness in older markets of seniors, the company is focusing to look further into such markets providing sigfiying markets and develop as they only pursue a penetration of three percent. Grow share of markets towards children that have a present penetration of sixty percent and children emerging markets only pursue a penetration rate of ten percent.
With respect to Cochlear products, the company continues to bring newer products owing to its huge investments towards research and development every year. Moreover, this permits the company for going ahead of the curve whilst designing innovative items for consumers and attracting new consumers. Since, the company was first listed in the year 1996, around 1.9 billion has already been invested towards research and development and the same has been increased more than 10% from the financial year 2018-2020 (Cochlear 2020). The primary products of the company and around 88% of their revenues are the implants of cochlear and the remaining 12% of their revenues are from the acoustic implants.
Key drivers of Revenue
With respect to growth and revenues, the company has significantly increased its revenue up by seven percent sales every year with sales revenue of just 1.4 billion. Owing to their enhancing consumer base every year, the revenue from sales from servicing their items is enhancing. Moving up twenty percent betwixt financial year 2018 and financial year 2019, this is forecasted to keep enhancing due to their focus on additional penetration in the market. For the financial year 2020, the company provided a reported net profit of $290 million that is a nine to thirteen percent increment of underlying profits for financial year 2019 mainly due to growth and expansion of freshly released items at the end of financial year 2019. Moreover, capital expenditure is anticipated to enhance up to 180 million, including the regular establishment of the facility of China, bigger Denver office together with investments towards platforms in Information Technology to strengthen digital, connected health, and cyber security abilities (Cochlear 2020). Additionally, capital expenses are forecasted to decline by around million dollars in the financial year 2021. Targeting China appears as the primary goal of their relative population for other international powerhouse nations being targeted.
In relation to risk, the company presently attains supplies for its goods from third parties. Due to the influence of Covid-19 throughout the world, this has resulted in few suppliers closing and resulting in a significant influence of not being capable of pursuing crucial materials required for the goods. This is an issue as the company states that few materials that are only prevalent from particular sources and hence, are not substitutable in nature. Cochlear also comprises of five manufacturing abilities internationally and if any material disturbance to one of them, it would result deterioration of supply of goods to that particular locality as it is problematic to establish new plants. Further, there is a major risk in the segment of medical that a third party shall produce innovative item that can overpower coming to the overall market hence leading to the loss of market share (Yahoo finance 2021).
Marketing Strategy
When it comes to market analysis, the cochlear implant market is anticipated to enhance by 10.5% every year until 2026. The growth is linked with favourable scenarios of reimbursement, enhanced adoption of implants, and increasing awareness about hearing aids (Cohlear 2020). Recently, unilateral instruments have influenced the market but due to the enhanced knowledge and prevalence of markets for hearing, there is expected to be a transition towards devices of bilateral nature because there are most cost-effective when implanted in children and has the capability to enhance performance on a whole.
.png)
(Cochlear Ltd 2020)
Industry Analysis & Competitive positioning
In relation to competitive positioning and industry evaluation, the company is leading the market of health care and equipment. This can be proved by the fact that the international cochlear size of implant market reported at 1.5 billion USD in the year 2020 and is expected to rise at a CAGR of approximately 10.5% with due course of time. The top rivals of Cochlear Ltd include Pentax medical, Hearing Life, and Australian hearing. Revenue wise, the company has been outperforming its rivals with expected annual revenue of $1 billion in comparison to other players (Cochlear Ltd 2020). Further, entry restrictions in this industry are regarded maximum because there are various companies with same solutions and objectives like that of Cochlear (Yahoo finance 2021). However, as mentioned before, the company was founded in 1967 and have been significantly outperforming the rivals since then. Besides, the company is also listed on the Australian Stock Exchange that allows it to gain a strong base of consumers, which the other players like Hearing Life do not possess.
When it comes to external factors, these are such factors which influence the performance of business. Such factors comprise of government, technology, foreign, social, and demographic (Cazier et al 2015). However, not every external factor may influence the business and in various scenarios, few may impact the business more than the others. Technology is Cochlear’s largest external factor because as it is performing efficiently owing to its innovative new items, which have been introduced and developed since, the company was introduced in the year 1967. Nonetheless, the accessibility of the company’s items and traits are far more innovative than other companies (Cochlear Ltd 2020). Another external factor is the company’s demographic that is targeted towards any individual having a hearing issue. This implies that old people, children and other people with damaged hearing owing to an accident has been targeted in their demographic. Even though the company has been founded in Australia, it has been leading in other nations as well. In a recent survey, Europe was held accountable as the largest share of all other nations in the year 2018. The reason behind this was high number of implants, population, and instrumental medical techniques.
Social external factors comprise of what lifestyle variations may emerge in the upcoming years. In the present scenario companies are struggling to survive the market due to pandemic and people are not ready to obtain any implant. Such a scenario is a major hurdle to the company and this has led to the drop in sales and the price of stock. Moreover, pandemic has snatched people of their jobs which imply that people cannot afford to pay for this implant that is expensive and this allows them to switch to regular hearing aids temporarily. In addition to these, the company has another major issue in their books and that is how to depict to consumers the amount of sanitization and cleaning that is being done at many centres (Cochlear Ltd 2020). A change in lifestyle has been seen during the time of pandemic where people are cautious and resort to hygiene to curb the spread of pandemic.
In order to tackle such shift in lifestyle, the company has been accommodating for every consumer by putting more people in consumer services, thereby allowing them to be present to any consumer with questions, queries, or any other issues. This can even be related with the laws of government. New laws in terms of social distancing are introduced which has been introduced internationally and almost every nation is distinct with their rules and regulations (Cochlear Ltd 2020).
Bargaining power of suppliers
The company ensures reduced capacity through the process of enhanced operations. Moreover, the overall cost from the supplier enhanced. The substitutes are negligible that enhance the strong bargaining power of supplier. The operations of the company is highly influenced by the bargaining power of the supplier that is in link to materials, labour and energy cost.
Bargaining Power of Buyers
The buyer’s power of the company is moderate to low as the company is in a position to sustain any price increment due to the high demand and limited supply of the market natural resources. Moreover, the availability of lower substitutes leads to reduction of the buyer’s bargaining power
New entry of threat
The entry of new threat remains relatively low because of deficit of natural resources and limited capacity of resources when it comes to global market (Deegan 2016) Moreover, it contains higher infrastructure and latest technology thereby the threat from the new entrant is less. Since the availability of the substitutes are lower and Cochlear has a diversified portfolio, the substitute threat is encountered easily. The rivalry is high between the competing sellers and the natural resource companies are into cut throat competition for access to the natural resources
The operations of the company are even affected by the following:
Financial evaluation
Cochlear has reported a loss of -1.9 from 2015 to the year 2020 ($238.3m) and it has recorded an increasing profit that is ten time in the year 2020 when compared to 2016. This development depicts that the company will be profitable with due course of time and can be utilized in forecasting and other plans associated with its affairs. The second measure utilized is average equity that is computed by adding ownership of two scenarios and dividing the value by two.
The aggregate investment of the company has been increasing at a positive rate from 2014-2020 (Baristow 2020). Such increase can be a direct result of the company providing more equity shares to finance its affairs. Further, an additional enhancement in aggregate equity shares depict that the company has been attaining profits, thereby attracting the investors to invest more (Pucheta-Martiinez & Garcia-Meca 2019). This surge in aggregate equity depicts the investors’ forecasting of maximum income in future and higher dividends as a direct outcome. Another technique utilized is the return on equity, and return on investment that also witnessed a positive movement from 2016 to 2018. This is a signal that the company is attaining profits and will do more in the future.
Average assets of the company also witnessed an increment from 2014-2020 and such depiction shows that the company made a profit, and investors were keen on investing in more shares. The other technique utilized is the return on assets wherein the company reported an increasing return on assets from 2016-2020, which indicates that the company was utilizing its assets to generate additional income.
.png)
(Cochlear 2020)
Valuation
• Valuation of share using Dividend Discount Model
Calculation of value of equity by Dividend discount method in which we calculate we calculated value of share price as per Capital Asset Pricing Model(CAPM)
Value of equity share of BHP = Expected Dividend per share
Required rate of return- Growth
Going by the Capital Asset Pricing Model,
Rate of Return (expected)= Re
Risk-free rate of Return= Rf
Market Return= Rm
Beta= B
Expected Rate of Return (Re) = Risk-Free rate of return + (Market rate of return- Risk-free rate of Return) * Beta
Therefore, Re= Rf + (Rm-Rf) * B
a) Obtaining an estimation of Risk-free rate of return
risk-free interest Rate projected at 2.5% in year 2021
For DDM we have Rf at 2.5%
Step 2: Computation of Market rate of Return and market risk premium
.png)
Avg return in last 6 years = 11.94+18.73-8.95+25.51+6.99
5
=54.22/5=10.84%
(Rm)=10.84%
Market Risk premium= Rm-Rf
= 10.84%-2.5%
= 8.34%
Step 3: Beta
Beta of Cochlear= 0.92 (NYSE)
Step 4: calculation of Required rate of return
(Re)= Rf + Market risk premium *Beta
= 2.5 + 8.34 * 0.92
= 10.18%
Step 5: Computation of Intrinsic Value
Calculation of growth
Dividend in year 2020= $1.75 Dividend paid in 2021= $1.40.
assumption of Growth rate 6%
Dividend for next year= Dividend for current year * growth
Dividend for current year= USD 1.40
Dividend next year= 1.56*1.40
= 2.18
Intrinsic Value of share of Cochlear Ltd = Expected Dividend for next year
Required rate of return-Growth
=2.18
10.18%-1.40%
Intrinsic Value of share of Cochlear Company USD 0.24
• Valuation of equity share by Price to Earnings method
Cochlear is listed in the NYSE hence the closing price is undertaken that is $ 228.97 per share dated 6 May 2022
The EPS (basic) of $ 1.29 per share has been derived from the annual report of the company
Therefore, the value of Equity share is:
Value of share as per Price to Earning method= Market price per share = $228.97
Earnings per share= 1.29
Equity value per share = $ 177 per share
Value of Equity by both method comparisons
On the application of both these method, the valuation is different because of the assumption used in the valuation process. Both these valuation method is used but DDM mechanism is used because the company is paying the dividend to shareholder and PE method is used because the company earns profit (Anton 2015)
Cochlear PEER analysis
.png)
The competitors of Cochlear all around the world are compared. It is seen that market capitalization of Smith & Nehew plc remains the highest and a beta of less than 1. On the other hand the second best competitor is Cochlear with market capitalization of $9404 million and a beta of 0.92. With a beta of 0.92 it is more responsive to the market as compared to its peer (Morecroft 2015)..
Investment risk
With respect to operational risks, the company did not expend any dividend to its investors. However, the issue of not paying the bonus is that the investors must see value in their investments, and in this scenario, investors will more likely not invest. Such risk is called the risk of dividend payment.
As per Carlon (2019), market risks are the risks that are related with the factors influencing the market. First is the equity risk wherein the company is not able to perform and the prices of shares decline. The other market risk is the risk of interest rate. If Cochlear opts for investment in the alternate investment channel when the rate of interest is less, the company will lose resources. Lastly, currency risk is also related to the exchange rates. For instance, the company invests in various treasury bonds that are provided by the government of UK (Baristow 2020). Hence, if the value of pound shall increase, the bonds market value shall decline and vice-versa.
Liquidity risk is another risk that arises due to the incapability to sell investments at market prevailing rates in order to realize the initial expenses (Davydov 2016). Hence, when the company shall purchase bonds and when the offer for sale is lesser than the invested price, there arises the emergence of liquidity risk.
Credit risk is that risk wherein a government or firm issuing bonds will be incapable of paying interest or principal after their maturity (Ang & Weaver 2010). Hence, the company must focus while investing in bonds because some of them pursue high credit risk in comparison to others.
Concentration risk is the risk related to investment in one type of investment (Sherman 2015). Therefore, Cochlear must try to diversify its investment in various ways in order to prevent the failure associated to one stake. Besides, the company can also invest in both financial and commodity markets.
Foreign investment risk is the risk related to investment in varied geographical areas. Hence, the company must focus on economies that have stable rules and regulations so that risks are decreased on a whole (Laux 2014).
Inflation risk is directly related with the buying power of a currency and the company must try to invest in government bonds wherein inflation remains stable. Moreover, in the case of investment in economies with high rise in prices, it can result in losses to the company.
Overall, the analytic measures or strategies utilized are average equity, profitability ratio, current rate, return on assets, return on equity, debt to equity ratio, and sales evaluation. Further, investment risks like market risk, operation risk, foreign investment risks, credit risks, concentration risk, and inflation risk plays a key role in the generation of issues or dangers that are encountered by Cochlear Ltd.
References
.png)
Essay
Risk, Return, and Capital Asset Pricing Model Assignment Sample
Introduction
The CEO of SysConsult International commissioned this essay. Analysis of potential investments in Logical IT and Safeworth Grocery is the goal. The research of finance assignment makes the assumption that a one-year Treasury note will earn 5% over the following year, with Logical IT's beta being 1.70 and Safeworth Grocery's beta being 0.60. Table 1 below contains an examination of potential return rates for the two businesses under various economic scenarios.
.png)
Relationship between Risk and Rate of Return
General Rule
As a general rule, more risks are linked to greater potential rewards, whereas greater safety is linked to greater potential losses. A straightforward and common sense principle of companies seeking to acquire capital governs this connection. It is best to describe the situation by presuming that there is no such link. In this universe, regardless of volatility, all investments would yield the same rate of return. Therefore, there wouldn't be any incentives for investors to fund risky businesses or projects. In other words, only a select few businesses would be able to access the money from possible investors, as people would not want to take the chance of their money disappearing for no apparent reason.
In the real world, businesses have the opportunity to raise more money by providing investors with greater returns. Companies can either guarantee investors a portion of their income through dividend payments, or they can show that they will grow quickly, allowing investors to sell their shares at a profit. Potential investors have a cause to participate in businesses with high performance volatility thanks to incentives like these. Investors typically base their judgements on a comparison of potential returns and risks, choosing the market's optimum ratio. Investors are also influenced by their own level of risk tolerance, as some people may be unable to take a large risk of financial loss, regardless of how lucrative an investment could be.
Not a Direct Relationship
It should be noted that risk and return do not directly correlate. Bigger risks entail higher potential profits, where "potential" is the essential concept. A person must be willing to embrace the potential that they could lose some or all of the money they invest if they wish to fast expand their wealth. Two concrete examples—trading in penny stocks and cryptocurrencies—can be used to demonstrate this. Bitcoin and other cryptocurrencies are frequently linked to great profits. Figure 1 shows that if an investor had bought in October 2020 and sold in December 2020, their investment would have more than doubled.
.png)
Figure 1. Bitcoin-USD exchange rates between October 2020 and December 2020(Yahoo Finance, 2021)
Although purchasing Bitcoins may seem appealing, due to the extreme volatility of the exchange rates, it is not necessarily a safe investment. If investors had chosen to invest at the start of June 2021, as shown in Figure 2 below, they may have lost more than 40% of their money. Investors may also be higher at risk of losing money due to government laws against cryptocurrencies, low transaction and keeping security, and other factors. Twelve nations, including China and Russia, have outlawed cryptocurrency, indicating that further nations may do the same. Due to all of these factors, investors must be willing to risk the possibility of substantial losses in exchange for the potential for big profits.
.png)
Penny stocks are another illustration of the connection because they are regarded as high-risk investments because of the extreme share price volatility. Outside of the major stock exchanges, a small group of investors trade these equities at extremely low rates. As a result, if a substantial investor decides to buy shares, the stock price will increase significantly, giving other investors the chance to sell the stock at a premium. But these investments are frequently non-liquid, suggesting that nobody might desire to buy these equities. Additionally, the stock prices would decrease dramatically if a big investor decides to sell shares, which will result in losses.
Calculating the Expected Rate of Return
Definition and Formula
The anticipated rate of return is the value at which investors can expect a given probability distribution of probable returns. In other words, it is the result of adding the probability of all conceivable outcomes together. Given the probability distribution of outcomes, it may be seen as the typical return rate an investor should anticipate from an investment. An investor can determine if a stock is performing well or poorly using the expected rate of return as a benchmark. The expected rate of return is calculated using the following formula:
.png)
Where:
• E(R) = Expected Rate of Return
• Rn = Return Rate in case of n
• Pn = Probability of n occurring
Calculations
.png)
According to the estimates, Safe worth Grocery has the lowest predicted rate of return, while Logical IT has the best.
Calculating Standard Deviation
Definition and Formula
A measure of variability called standard deviation shows how much the actual data may deviate from the expected value in standard units. To put it another way, the standard deviation is a metric that shows how volatile a stock is predicted to be over a specific time frame. The following is the standard deviation formula:
.png)
Where:
• Rt = observed return rate
• R = expected return rate
Calculations
.png)
According to the estimates, Logical IT has the largest standard deviation, indicating that its stock is the most volatile.
Beta and CAPM
Beta vs Standard Deviation
Beta or the standard deviation are two ways to quantify volatility. The standard deviation, as it was discussed in Section 4, is a gauge of a stock's volatility over a specific time period. A stock's price fluctuation in relation to a benchmark is shown by the relative measure of volatility known as beta (for example, ASX200 index). The stock, for instance, will be 20% more volatile than the market if the beta is 1.2. This suggests that the stock should increase by 12% if the market increases by 10%. When predictions regarding the performance of the benchmark index are available, beta is helpful. Higher betas are recommended if the market is anticipated to rise, whereas lower betas are preferred in all other scenarios.
Since it helps to make decisions knowing the forecast for the benchmark, beta is a stronger indicator of risk in this situation for the common shares of the IT company and the supermarket company. According to the ASX200 forecast, there is only a 30% risk of a market recession and a 70% likelihood that the market would grow.
Using Beta for Calculations
The projected rate of return for the two companies under examination can be determined using the beta of the companies. The capital asset pricing model (CAPM) can be used to do that. The CAPM formula is as follows:
![]()
Where:
• Rf = risk free rate (treasury note)
• βi = company beta
• E(Rm)= benchmark return rate (ASX200)
Section 1 of the essay provides the betas for Logical IT and Safeworth Groceries as well as the risk-free rate. Section 3.2 of the essay provides the expected rate of return for the ASX200.
Following are the calculations for the two companies under analysis' projected rates of return:
If the cash flows are the same, Logical IT will be valued more because of its larger beta.
Volatility of the Benchmark
It is also vital to take into account how the anticipated return rate will vary if the market becomes unstable. Higher betas indicate that the value will likewise be more variable than projected. For instance, if the projected rate of the ASX200 falls by 5% (to 6%), Logical IT's share price will move more dramatically than Safeworth Groceries'. Following are the calculations:
.png)
This indicates how closely tied to market performance the value of Logical IT's shares is.
Portfolio Creation
Portfolio Beta
Putting such a portfolio is essential for protecting investments from threats. Investors want to distribute their capital among a variety of funds, including bonds, shares of small businesses, shares of internationally renowned companies, and shares of well-established foreign corporations. By making investments in various businesses, investors frequently diversify their portfolios. A technique like this helps protect the investor from the potential that the industry won't do well at a certain point in time. When it comes to Logical IT and Safeworth Groceries, investment in the grocery chain provides protection from the market's turbulence and the IT industry's performance.
A portfolio's beta, which is a weighted average of the betas of all the companies in the portfolio, can be used to describe it after it has been constructed. Understanding a portfolio's predicted volatility during the specified period is made easier with the help of the portfolio beta. The following formula is used to determine the portfolio's beta:
![]()
Two potential two-share portfolios were taken into account for investment. The first choice is to put $70,000 in Safeworth Groceries and $30,000 in Logical IT. According to this, 30% of the portfolio will presumably be invested in the IT company, and 70% in the grocery company. When it comes to portfolio beta:
![]()
The CAPM model can be used to determine the portfolio's anticipated rate of return:
According to the analysis, this option has a little lower risk than the ASX200 index. When the market prediction is unfavorable or fraught with uncertainty, this kind of portfolio may prove advantageous.
![]()
Alternatively, you might put $70,00 into Logical IT and 30% into Safeworth Groceries. The predicted rate of return and portfolio beta in this instance will be as follows:
![]()
Comparing this type of portfolio to the market benchmark of 11%, larger predicted returns are connected. When the outlook for the market is favourable, a portfolio like this is the ideal choice.
Recommendations
When comparing the two choices listed above, I would choose the second one, in which the IT business receives 70% of the funds and the food company receives 30%. As stated in Section 1 of the current paper, there is only a 30% likelihood of a market recession, thus the projection for the ASX200 index is favourable. Investors may be more risk-tolerant when the market is predicted to grow, so somewhat larger beta values are favoured. By investing in the grocery company in the second scenario, any potential underperformance of Logical IT is compensated for. It is advisable to safeguard the investment from the risk of a recession even though diversifying the portfolio reduced the possible rate of return from 15.2% to 13.22%. The expected returns from Logical IT will dramatically decrease if the market goes into a recession, whereas the expected returns from the grocery store are predicted to be rather steady (see Section 5.3). Additionally, buying in Safeworth Grocery shields funds against Logical IT's underperformance and market volatility.
Although the aforementioned advise seems to be appropriate, the investor ultimately has the last say. The investor's individual risk tolerance should be used as a reference when making investments. The 30% probability of underperformance may be too high for some investors. The first selection from the two-share portfolio is preferred in this situation. This portfolio's beta is only somewhat lower than the market benchmark, which suggests that predicted returns will be roughly average. The investor will also continue to be safe from any potential market turbulence.
Reference List
Orji, C. (2021). Bitcoin ban: These are the countries where crypto is restricted or illegal. EuroNews.
Yahoo Finance. (2021). Bitcoin USD (BTC-USD).
Dissertation
Competition and Integration Strategies of Stock Exchanges Assignment Sample
1. Introduction
There are currently 250 organisations designated as exchanges worldwide, and both alone and collectively, they are essential to the functioning of most national economies as well as the global economy. They offer markets for all of the major commodities and assets traded throughout the world, as well as cash, futures, options, and other derivatives.
International and national stock exchange competition is a relatively new phenomenon. It was challenging to imagine exchanges as businesses that create, sell, and compete with one another for clients until a few decades ago. Exchanges have historically been thought of as either formally private organisations but are heavily governed by public laws or as public enterprises. Given the distinctive nature of their operation, which closely matched that of a public good, they were frequently legal monopolists in both situations.
Exchanges used to have natural monopolies in the provision of many of their services, but this is no longer the case (Steil, 1996b). A monopolistic exchange that was owned by its members lacked the motive to maximise profits since the members in charge were not allowed to receive any earnings from the exchange. Exchanges are becoming increasingly aware that they must demutualize in order to convert a member-owned corporation into a stock company if they are to compete with businesses whose objective is to maximise shareholders' wealth. Exchanges have never been thought of as enterprises, but they have changed to become corporations with a focus on business. It is vital to revaluate what an exchange is, what its products are, where its revenues come from, and who its customers and suppliers are in order to comprehend the firm's perspective on an exchange. Exchanges are unique business entities that offer services for listing, trading, and price distribution. Direct consumers include publicly traded corporations, those looking to go public, information providers, and brokers who conduct business on the exchange. Indirect customers of an exchange, intermediaries trade on behalf of both individual and institutional clients.
Network providers are vendors. Listed firms serve as both information providers and trading venues for their stock.
This finance assignment dissertation's main goal is to examine the integration and competition tactics of businesses that resemble stock exchanges.
The dissertation is concerned with:
1. Stock exchange industry dynamics
2. The evolution of mergers on stock exchanges
3. Integration tactics, as well as
4. Trends in future consolidation.
The tendency toward globalisation has been hastened by technological developments. Specifically, remote access to trading systems, which suggests that stock exchange services can now be accessed from anywhere, includes companies whose stocks are traded on global exchanges while still being readily available to local investors. With such a setup, a competitive atmosphere is likely to emerge, where the most effective exchanges will eventually gain the trust of investors, traders, and businesses (Cybo-Ottone, Di Noia and Murgia 2000). The ecosystem surrounding the European stock exchange is continuously altering in structure. New stock exchange alliances, stock exchange privatisations, Internet exchanges, electronic exchanges, online brokers, etc., appear in the media almost every day. The deregulation of stock exchanges, advancements in technology, and a growing internationalisation of the securities markets have all contributed to increased competitiveness, which is the main force behind the developments.
Existing exchanges and electronic communication networks serve as competition (ECNs).
Due primarily to the restructuring of the securities markets, there is now more competition among stock exchanges, which has resulted in mergers, technology agreements between existing exchanges, price wars, takeovers, and the opening of new exchanges, even within the same nation. Quasi-exchanges, commonly referred to as ECNs, have recently posed a threat to exchanges. They are stock exchange parasites. Since they often exclusively trade stocks listed on other exchanges, they not only profit from the listing process but also from the price discovery process that allows exchange members to direct trading to them. ECNs are destroying more and more of the current stock exchanges' revenue streams.
One of the most likely strategic contacts between stock exchanges has been mergers. The idea provided here is based on research on network externalities. Exchanges can be thought of as networks where the value of the network increases exponentially as the network's size increases (Shapiro & Varian, 1999). In other words, people are more drawn to larger networks than to smaller ones. According to Castells (2000), a network's connectivity and consistency are related. When companies choose a listing exchange, they go for the one that has the most intermediaries connected to it and regularly offers the most liquidity.
The introduction of the euro has increased demand for stock exchange consolidation throughout Europe. Further facilitating the integration of the regional financial markets is the complete implementation of the Investment Service Directive 1992 (ISD), which grants its members remote access throughout the European Union (EU). The horizontal merger paradigm is being promoted by the European Securities Forum. In this concept, the three functional levels of trading, clearing and settlement, and custody are where national exchanges integrate. Through a single point of entry, each market participant has access to a variety of pan-European services.
This concept has led to the creation of Euronext, a consolidated organisation made up of the exchanges in Paris, Amsterdam, and Brussels, as well as the proposed development of International Exchange (iX) from the London Stock Exchange (LSE) and Deutsche Börse (DB).
The analysis of industry dynamics and integration strategies will be done within an analytical framework. The models employed include Ansoff's Product-Market Matrix, Network Society, and Porter's Five Forces Model. These models are used to illustrate how exchanges came up with their integration and consolidation methods as well as their reasons for wanting to merge.
A total of 5 interviews were performed with members of the London Stock Exchange, Hong Kong Stock Exchange, investment banks, and brokerage businesses due to the industry's rapid evolution. Interviews served as the basis for the primary data sources. Academic journals, novels, periodicals, and working papers were among the secondary data sources. This paper, which contains a literature analysis, conclusions and explanations, and two case studies, is the deliverable.
The project was carried out using a conventional methodology, including project specification, literature review, fact-finding, investigation, case analysis, and assessment.
The first conclusion drawn from the interviews is that merging is an obvious tactical choice for exchanges. This approach can produce economies of scale, network externalities, increase profitability, and boost the effectiveness of the facilities used for order routing and decision-making. With the assistance of the financial markets harmonisation, a cross-border merger between two exchanges is made possible in Europe.
The second observation is that mergers result in the vertical merger and horizontal merger patterns of convergence.
The former shows how exchanges join forces to create a comprehensive financial services company that facilitates trading in a wide range of financial instruments, including stocks, options, futures, and other derivatives. The latter defines the joining of specialised exchanges, which results in compatibility, a notion in which intermediaries dealing on one exchange are provided with remote access in other member states, with reciprocity and without additional restrictions.
The third result is that future inter-exchange alliance or merger is restricted by the existence of national regulatory frameworks, which are intricately woven with their corresponding regulators. It is improbable that we will soon achieve the ultimate aim of having a supranational regulator that enforces its own rules on the entire world.
The single price and time priority are not a problem in order-driven markets like the London Stock Exchange and the Hong Kong Stock Exchange, according to the fourth study. In contrast, each market maker acts as an execution centre in a quote-driven system like Nasdaq while adhering to rules established by the National Association of Securities Dealers (USA). There is room for the development of ECNs in quote-driven or hybrid systems. Quote-driven trading systems are gradually in danger of being replaced as a result of ECN growth.
A fascinating consensus regarding the reasons why investors decide to trade on an ECN can be drawn from the sixth finding. As long as they can execute their orders at the best price, investors are unable to distinguish between the functions of a stock exchange's trading system and those of an ECN. Price competition alone is insufficient for an ECN to survive. They are incompetent in drawing capital and disseminating information.
The structure of this dissertation is as follows:
• An exchange is a firm, according to Section 1;
• Section 2 examines the competitiveness and integration that the stock exchanges in Asia and Europe currently face;
• Section 3 shapes industry dynamics using Porter's Five Forces and network externalities, and then uses Ansoff's Product-Market Matrix to choose a stock exchange strategically;
The London Stock Exchange and the Hong Kong Stock Exchange are analysed using the interview methodology in Sections 4 and 5, respectively, while Section 4 further develops the findings and connects them to the theoretical framework and literature review.
2. Review of the Literature
2.1 What is an Exchange?
A stock exchange serves two main purposes. The listing of securities comes first. The stock exchange is responsible for overseeing the issuers' statutory information responsibilities as well as approving prospectuses for qualified securities. Second, the stock exchange serves as a trading venue for its participants to transact in the listed securities. Prior to the auction, the brokers physically assembled on the floor to fix the price. Brokers are no longer required to be present in person at the stock exchange because the majority of them now use computerised trading systems of some kind.
A market similar to the one where fruits and vegetables are traded can be observed in stock exchanges. The most prosperous ones will continually be modifying and expanding their market operations while still having reasonable regulation since they operate in accordance with the rules of supply and demand. Domowitz provided a thorough definition, saying: An exchange is a trading platform that must meet the following requirements:
• Offer trade execution tools
• Consistently or continuously provide price information in the form of purchase and sell quotations.
• Use its trading methods, regulations, or mechanisms to engage in price discovery.
• Be a single price auction, a consolidated limit order book, or a formal market-maker structure.
• Centralize trading for trade execution purposes.
• Include members
• Show that the system's rules and/or design have a good chance of generating liquidity in the sense of regular entry of buy and sell quotations, so that both buyers and sellers can anticipate to regularly executing their orders at these quotes.
Regulatory authorities often define an exchange as a company, corporation, or individual that offers a market for the exchange of securities between buyers and sellers. Traditionally, members who are also mediators own an exchange. Members did not have the incentive to invest in the infrastructure of the exchange, including the technology and trading facilities, under a member ownership structure because the rewards from these investments could not be transferred to them. The profitability of an exchange and, thus, its competitiveness were hampered by a lack of drive. In addition, prices were raised for intermediates that traded on monopoly exchanges.
They charged their consumers more to cover the rising operational costs. Members were hesitant to approve a transaction levy hike because of this. According to Hansmann (1980), the non-profit producer has the ability to raise prices...without much concern for customer backlash; nevertheless, it lacks the incentive to do so because those in charge are not allowed to keep the profits.
Exchanges have had to become more competitive as time has gone on in order to draw quality companies to list and intermediaries to trade; several of them have done this by demutualizing the member ownership arrangements they previously had. Demutualization plan participants are given shares of the exchange. They become exchange shareholders and are therefore potentially eligible for profit distribution. Since that time, exchanges have changed to become businesses with a focus on business and the maximisation of shareholder wealth.
2.1.1 Products
In addition to the role they play in an economy, stock exchanges can also be seen as a company that manufactures goods. The result is the development of a market for financial instruments, which transfers ownership of the stock exchange's pricing information. A stock exchange's products more explicitly include listing, trading, price-information services, and clearing & settlement, the percentages of which are displayed in Table 1. Given that other services are not usually included in the offering, the income distribution from these multiple products demonstrates that the emphasis is mostly on listing and trading.
Table 1
Fees Europe % N. America %
Listing 19.3 32.1
Trading 45.1 39.7
Services 24.4 22.6
Other 11.2 5.7
The "firm" perspective is concerned with the exchange's output and financial success. According to Mulherin et al. (1991), a financial exchange is not a market as it is typically understood, but rather a company that establishes a market that is distinguished by the use of financial vehicles.
According to Lee (1998), a security market should be thought of as a business that produces the following goods: research, pricing information dissemination, clearing and settlement services, securities trading, and listing. The aspect of providing settlement services is not covered in this dissertation because many exchanges either ignore it or outsource it to a different organisation.
Given that the consequences of network externalities produced by listed companies and intermediaries are the main focus of the dissertation, the exchange is viewed as a producer of listing and trading services.
2.1.2 Revenues
General fees, both initial and annual, make up the profits from listing and trading. Settlement & Clearing as well as price-information services are provided. As a result, the trading services provided by a stock exchange can be divided into three categories: the traded item (issued by some businesses that often pay a fee to have it listed), the trading medium (trading facilities, computers, a computerised floor, settlement), and price dissemination.
The front end of stock exchanges can be divided into the listing, trading, and related services. The unglamorous part that follows the trading of stocks or bonds on an exchange is clearing and settlement. A securities depository settles the trade by transferring the securities from one account to another, while a clearing house verifies that the buyer and seller have the funds and securities necessary to complete the transaction.
The degree to which an exchange is successful at drawing order flow and achieving the capacity to generate revenues is determined by its profitability (Lee, 1998). Order flow denotes market liquidity and trading volume, which is made up of both the number of deals made during a given time period and the total value of the shares moved. For an exchange, it creates income both directly and indirectly. The exchange's receipts for transaction services, which depend on how many trades it executes, have a direct impact. The trade volume recorded on an exchange is frequently used as a marketing technique to draw new listings to the exchange, which causes the indirect impact.
2.1.3 Customers
Both direct and indirect customers make up an exchange.
Both listed companies and those looking to go public are direct clients who pay for the use of listing services. They also include information suppliers who pay to have access to terminals and the right to share price information, as well as intermediaries who pay to be allowed to participate in trading.
Individuals and institutions who place orders with intermediaries for execution on an exchange are considered indirect customers. Either online trading or trading through a middleman is options. They both consider the exchange's quality, pricing variables, and transaction costs. Their decisions are influenced by factors in the market microstructure such as liquidity, price discovery, or immediacy, reputation, and monetary regulation. Share registration service fee revenue from initial public offerings is included under other income.
2.1.4 Suppliers
Due to the fact that they supply the data and the shares for trading, listed firms are also suppliers. The network provider, who offers physical connectivity services on an exchange infrastructure, is another category of suppliers.
The globalisations of financial markets and exchange competitiveness have led to an exchange's transformation from a market to a firm, as described above.
2.2 Globalisation of Financial Markets
Cross-border securities trades have increased significantly since 1980. By 1988, one in four stock market transactions worldwide involved a foreign counterparty or a foreign security (Howells and Bain, 2000). The estimated global turnover of foreign exchange more than doubled between 1989 and 1995.
Cross-border business in Europe is becoming more and more common since the creation of the European Union. Investors in Europe are being encouraged to do more cross-border transactions in quest of lucrative business possibilities by the introduction of the euro and a wider use of equity as a financing mechanism. Nevertheless, despite the allure of international trading, the majority of stock exchanges in Europe are national organisations that exclusively deal in domestic, country-specific equities.
But given that more stock exchanges are striving to operate internationally, this market structure seems to be shifting. According to a Transaction Survey conducted by the Hong Kong Stock Exchange in 2000, institutional investors from abroad have greatly boosted their involvement in the Hong Kong market. The creation of pan-European exchanges that allow for the trading of equities from various European nations has been the subject of numerous ambitious projects in Europe recently. The creation of these exchanges will probably have a significant positive impact on the financial markets. Examples of possible by-products of consolidation include the standardisation of trading platforms across exchanges, an increase in market liquidity, and a decrease in market fragmentation. These developments could assist to reduce the costs and issues related to cross-border trading in Europe.
Markets for goods and services are becoming more globally interconnected despite the presence of protectionism and barriers to free trade (Castells, 1996). In response to increased competition, financial institutions are expanding their business operations by creating new products or by entering new markets. Additionally, they are expanding their customer base to take advantage of size and scope economies.
Expansion takes place both within and outside of national borders in order to create a foothold in foreign markets. By enabling more effective transmission of information, goods, and services in the late 20th century, new communication and transportation technology contributed to the globalisation of markets.
2.2.1 Europe: Vision to Become a Pan-European Financial Market Since the 1957 Treaty of Rome, which founded the European Economic Community (EC), the idea of harmonising financial laws to create a single financial market across the EU has been advanced (Howells and Bain, 2000). In the 1960s, there was a significant liberalisation of the financial markets with regard to direct investments, commercial credits, and the purchase of assets on foreign stock exchanges. Securities markets and the insurance services sector are now part of the EU's true single financial market. Companies were able to list their shares or raise capital on other EU stock exchanges thanks to the Directive Co-ordinating the Conditions for the Admission of Securities to Official Stock Exchange Listing, which was passed in 1979. Based on the principles of the Single European Act, the ISD applied the single passport principle to non-bank investment firms, removing obstacles to the construction of branches across the EU for all firms as well as the provision of cross-border securities services. Additionally, it loosened the restrictions on who can access stock exchanges, financial futures exchanges, and options exchanges. All member states shared mutual recognition and home-country control for all security companies and banks providing investment services.
Similar to other financial services, the insurance sector saw the adoption of a number of directives, all of which established a company's ability to operate in another member state.
One step toward achieving economic convergence in Europe was the introduction of the Euro as a shared currency on January 1, 1999, by 11 European countries. With the establishment of shared, centralised accounting and administrative systems, the member countries' currency exchange expenses are drastically reduced, and price transparency is increased. When dealing with one currency instead of several different ones, even non-members interacting with member countries may benefit from improved price transparency (Geradine, 2000).
As was mentioned above, globalisation has emerged as a significant force for change, as evidenced by the quick rise of cross-border portfolio investment and market collaboration.
2.2.2 Asia: Evolution of Strategic Alliances and Cooperation
The exchange alliances and cooperative agreements moved at a frenzied pace in the Asia-Pacific region.
Most Recent examples include: The NASDAQ AMEX Pilot Program for the trading of seven worldwide shares (Amgen, Applied Materials, Cisco Systems, Dell, Intel, Microsoft, and Starbucks) in Hong Kong was launched on February 1 as a result of a collaborative agreement between the HKSE and Nasdaq. Following the customary T+2 (the second trading day following the transaction) settlement period, these shares may be traded and settled in Hong Kong dollars.
For instance, the Jakarta Stock Exchange and the Amsterdam Exchange, the Singapore Exchange and the Australian Stock Exchange, the Stock Exchange of Thailand and the Tokyo Stock Exchange have all signed Memorandums of Understanding to facilitate information sharing and cooperation on regulatory matters.
The Osaka Securities Exchange and Nasdaq Japan Inc. announced a business cooperation agreement in Japan to create Nasdaq Japan, which will accept listing applications for the Nasdaq-Japan market. In order to better manage their operations and protect investors, The Tokyo Stock Exchange and the Korea Stock Exchange inked another agreement of cooperation. This enabled a valuable information exchange on the promotion of stock investment and oversight of market activities.
2.3 Nature of Competition of Stock Exchanges
The development of new financial instruments, the waning monopoly of banks as a source of direct funding to borrowers and of direct investment for investors, the phenomenal advancement of information technology, a greater emphasis on financial literacy among people, and the fluctuations in interest rates, prices, and exchange rates brought on by the oil crises have all contributed to the growing importance of securities markets in the financial system, both as regulated exchanges and over the counter markets (OECD, 1996). All financial intermediaries (banks, mutual funds, etc.) perform a risk-management activity in between borrowers and lenders on the one side and markets on the other, providing a sort of risk insurance, according to new theories of financial intermediation (Allen and Santomero, 1996; Allen and Gale, 1997). Despite this, markets and banks can coexist (Boot and Thakor, 1997).
Because it makes exchanges more comparable and integrated, the development and transformation of the securities markets and information technology is a significant concern in both Europe and the United States. Investors now face a market whose boundaries are becoming increasingly hazy. As a result, rivalry between stock exchanges as well as between exchanges and automated trading systems is growing (Pagano and Steil, 1996). (Domowitz & Lee,1996).
Exchanges compete against one another in an effort to draw order flow. The market is fragmented mostly because no single exchange dominates in the economic sphere or because each exchange is too small on its own to have an impact on prices, yet is unwilling to act jointly to consolidate its market dominance (Lee, 1998). Both make the case that differing laws and regulations may be what prevent them from engaging in the same activities. Since ECNs have been implemented, the marginal cost of new transactions is effectively zero. Its introduction, which allows investors to automatically find the lowest-cost market, increases the pressure. Each of the issues of competition from ECNs, fragmentation, and rivalry are examined in the sections that follow.
2.3.1 Rivalry among Exchanges
Rivalry is a competition between various exchanges working for the same objective. All exchanges and trading platforms aim to draw liquidity as their main objective. A marketplace for the exchange of assets at the lowest possible transaction cost is a requirement for an exchange to be competitive. Exchange charges and brokerage commissions are examples of direct costs. According to Lee (1998), one of the characteristics of indirect costs is the lack of liquidity, which prevents the simultaneous purchase and selling of an unlimited number of assets at the same price and without delay. Deregulation of brokerage commissions also suggests a threat to trading as a source of income. An exchange has to entice more businesses to list and more intermediaries to trade in order to increase profitability.
Exchange competition is nothing new, particularly in the United States. For instance, these can be discovered from the early years of the NYSE. The Consolidated Stock Exchange3 opted to trade NYSE-listed equities in 1885, choosing to do so at a reduced commission rate because it used NYSE quotes and did not have to pay for a price-discovery system to be set up (Mulherin,1991). The empirical analysis of the recent integration of the US equity markets is done by Blume and Goldstein (1997).
In more recent times, the London Stock Exchange, which underwent significant reorganisation in 1986, unilaterally decided to allow trading of the most significant European equities on its international division (SEAQ International). Other European equities traded on national exchanges had to immediately upgrade their markets because it had gained such a big market share. The LSE is currently up against Trade point on a national level. The LSE has reduced its costs by more than 60% to undercut trade point after entering the market in 1995 and receiving the trades of three out of four Inter-dealer markets. To better compete with the order-driven European exchanges, the LSE made the decision to switch from a quote-driven system to an order-driven system for the leading shares of the FT100 Index.
Since it is possible to trade securities that are typically listed on exchanges on quasi-exchanges like automated trading systems (ATS), exchanges are now up against even more competition. Even though their nature is unclear from a regulatory perspective, ATS compete with exchanges.
2.3.2 Fragmentation
No one participant controls the market, which is characterised by fragmentation. The goal of exchanges operating in the same nation is to have a single exchange that focuses all securities trading, has a single order execution system, and consolidates all news releases with a single data dissemination centre. If not, expenditures in staff and technology will duplicate resources and affect liquidity.
The proposed creation of a Small and Medium Enterprise Securities Exchange to serve the needs of small and medium-sized businesses that do not match the listing standards of the PSE main board has previously been opposed by the Philippine Stock Exchange (PSE). If this kind of plan had been implemented, the market would have been divided and liquidity would have been reduced.
As was already said, a market that has multiple trading systems and no official linkages between their market structures is said to be fragmented.
2.3.3 Competition from ECNs
An ECN can be viewed as a particular form of exchange from an economic perspective, one that focuses on providing trading services without providing listing services and typically trades securities that are already listed on regulated exchanges. ECNs are low-cost, profit-oriented distribution channels that compete primarily on price while also taking advantage of quote-driven markets like Nasdaq's alleged lack of customer service. ECNs represent more than 15% of all US orders and almost 30% of Nasdaq activity (Baker, 2000). Instinet and Island, the two biggest ECNs, control 13% and 12%, respectively, of the Nasdaq market.
Some ECNs have submitted applications to the SEC to upgrade to full stock exchange status in order to stop paying Nasdaq trade reporting and quote fees, significantly reducing their operational costs and escalating rivalry with stock exchanges.
From the standpoint of the investor, broker-dealers can trade at the best price and in the most economical trading and settlement environment thanks to connection and advanced order-routing software (Butler, 2001). The likelihood that there will be enough liquidity in the system even in the face of growing market fragmentation increases as technology improves communication between market players. Vendors of ECN software have been successful in developing a virtual market.
Users won't care where their orders are fulfilled as long as they can receive the greatest prices on the market. This is due to the fact that while investors are naturally drawn to the most liquid platform that offers price transparency, they are also increasingly motivated by the need to reduce trading expenses.
ECNs are fragmenting the market from an exchange's perspective since they are stealing liquidity from the exchanges. But because they are bringing about price transparency, which makes it simpler to recognise prices, they are also concentrating liquidity (Butler, 2001). In the US, the emergence of ECNs is seen as the market's direct reaction to unhappiness with the pricing advantages enjoyed by floor-based exchange members. Exchanges need to be able to deliver the proper goods and services to the market in the most effective manner and at the most affordable price in order to thrive and grow.
ECNs provide the same purpose economically as exchanges (Britton, 2000). With a primary focus on order matching and execution at the most aggressive price, they appear particularly strong.
2.4 The effects of the increasing competition among Stock Exchanges
In terms of future market structures in Europe, it is challenging to assess the implications of the increased competition among exchanges. On the one hand, only the most effective exchanges should endure in the long run, trading equities from all other European nations and providing the most cutting-edge and aggressive financial products (especially derivatives). The existence of thirty European stock exchanges, nearly all of which use the same fundamental trading process (the continuous electronic auction), is, at the at least, redundant and a waste of resources, as noted by Steil (1996b). After 1996, the availability of remote membership will surely be expanded, which will undoubtedly help to remove significant obstacles to the development of a shared and larger pool of equity market liquidity and facilitate cost-effective cross-border trading.
The market would become even more integrated if there was a single European currency. This argument is supported by the first model in this study; just one trade (but not necessarily the most efficient) should endure.
On the other hand, especially following the introduction of the Euro, it's probable that a separate exchange will only develop for highly standardised and/or traded products (like government bonds, derivatives, and stocks of the biggest firms). In fact, remote access renders any competition between the various exchanges pointless, at least if they are on an equal technological level. In addition, the informational advantages provided to national firms, particularly small and medium-sized ones, by their national exchanges and intermediaries, will continue to be significant. Last but not least, all previous initiatives or attempts to establish a distinctive European stock market (PIPE, Euroquote, etc.) have failed. In any case, various trading techniques might readily provide the justification for the coexistence of numerous markets in various countries dealing in the same equities (as continuous auction favours transparency and market making favours liquidity).
The stock exchange market is becoming more and more globalised. Cross-border business is now feasible and easy thanks to technology, and deregulation has made it possible to take advantage of these opportunities. Market participants now have the option to join foreign stock exchanges remotely according to the EU Investment Services Directive (ISD), and stock exchanges can now set up electronic access abroad.
The internationalisation of the stock exchange environment has also been fueled by the demand side, particularly through institutional investors' investment practises. The involvement of institutional investors is becoming increasingly important to the development in the stock-exchange region in light of the growing volume of pension savings. In order to get higher returns, investors' portfolios are susceptible to more diversification.
This tendency has been greatly accelerated by the advent of the euro, which allows investors to diversify their holdings across numerous nations without taking on any exchange-rate risk. Institutional investors, who are frequently subject to placement restrictions limiting the number of investments made in foreign currencies, have found this to be of particular importance.
2.5 Revolutionary Changes of Technology in the Securities Markets
Information technology advancements have significantly influenced changes in the securities trading industry in a number of ways. First, electronic trading platforms can now process complex orders with ease. Second, unlike traditional floor trading, where the number of participants is physically constrained, the systems can support essentially an infinite number of users. Thirdly, geographical boundaries have been blurred by IT development. In theory, installing a terminal/PC and connecting to the system is all that is needed to participate in an electronic trading system.
The world is going through a dramatic expansion in the context of economic globalisation, as explained in section 2.2. Over the past 20 years, there has been a significant increase in international trade, money flows, foreign direct investment, and migration (Holland, 1987; Dunning, 1992, 1993). According to this theory, social, cultural, and political life have also undergone a comparable globalisation that has affected local communities and weakened links to national identity, citizenship, and political sovereignty (Held, 1991; Robertson, 1992). This economic and social globalisation was made possible by the creation and dissemination of technological advancements.
2.5.1 Evolution of Online Brokerage Firms
Technology globalisation was described as global technology exploitation by Archibugi and Michie in 1997. Businesses are utilising their innovations on international markets by either exporting goods that incorporate them or by licencing the technology. This suggests that financial institutions have taken advantage of the Internet and new digital technologies to expand internationally in order to cut operating costs, eliminate the need for intermediaries, and increase awareness and choice. Growing volumes of trading are being diverted away from existing exchanges and from the traditional member firms of the exchanges through the development of online brokerage firms as new avenues to reach customers.
To compete with the established member firms of exchanges, online brokerages with innovative business models have emerged (Weber, 2000). A study by the Securities
Industry Association (SIA) predicted that by 2003, 50% of retail stock market trades would be conducted online, up from 37% in 1999. Additionally, according to the SIA, 18% of stock buyers and sellers now use the Internet, up from only 10% a year ago. Around 150 firms already offer Internet trading, according to the US Banker. Since 1997, there have been five times as many daily average online trades, which currently surpass 500,000. From 2.2 million households a year ago, there are now 3 million investing online (Haggin, 2000).
E-brokerage is a direct electronic market access that enables investors to deal with buyers and sellers directly instead of going through an intermediary (Tunick, 2001). Some exchanges serve as a trigger in certain situations, enabling investors to cut out the middleman and trade straight within the execution destination of their choosing. For instance, the New Zealand Stock Exchange intends to introduce a wireless securities trading system that will enable investors to trade stocks directly with one another rather than through a broker. Under such an arrangement, investors can use a WAP-capable phone or palm computer to connect to the exchange's WAP server via their Internet service provider.
2.5.2 Impact of ECNs
New MONSTERS (Market-Oriented New Systems for Terrifying Exchanges and Regulators) have emerged as a result of computer technology (Lee, 1998). To maintain proven trajectories of performance improvement to the current trading systems, ECNs evolved as an incremental innovation. As a result, there is regulatory competition between regulated exchanges and ECNs, such as Instinet and the New York Stock Exchange (NYSE). Section 2.3.3 has described the ECNs' problems with competition.
2.5.3 The network effect - the advantage of being first and largest
The advantage of being first or largest in the market has likely functioned as a barrier to competition, but technological advancement and growing internationalisation have heightened competitiveness in the stock exchange sector.
In general, having multiple players in a trading system is advantageous to the users. This is so because it's expected that as participants grow, so does the system's liquidity. As a result, investors are able to purchase and sell assets at reduced spreads without having their opinion of the price of the securities negatively impacted. Investors frequently choose the big, well-known marketplaces because of the beneficial effect of numerous people using the same system (network effect).
The benefit of entering the market first has been advantageous to traditional stock exchanges. Meanwhile, high establishment expenses have reduced competitiveness. Given these circumstances, traditional stock exchanges have not always had a strong incentive to adopt cutting-edge technology or to evolve in line with market demands. For instance, the introduction of automatic trading systems to replace floor trading was delayed until the biggest stock exchanges. Floor trading is still a significant component of trading on the New York Stock Market, the largest stock exchange in the US.
It is conceivable to consider a network-externalities literature application to financial transactions and intermediation. Although it is a relatively recent topic, the use of network externalities in finance has advanced significantly in recent years. When it comes to stock exchanges, they can be thought of as networks where market uncertainty, as measured by the variance of market prices, is reduced the more traders (taken from the same distribution of uncertain endowments) enter the market (Economides, 1993).
Domowitz's study is one that specifically incorporates network externalities into exchange competition (1995). He sets up a game between exchanges using network externalities, though this is not analytically explained. In this game, traders can choose between floor trading and automated trading, and network externalities are what traders refer to as the liquidity effect because the more traders there are in a market, the more liquid it is. It is believed that the higher network externalities provided by electronic exchange structures will promote implicit mergers and act as their vehicle, which is currently taking place in fact as seen by different agreements, particularly among derivatives exchanges.
2.6 Integration of Stock Exchanges
The most recent merger in Asia took place in 1999 when Singapore International Monetary Exchange Limited and the demutualized Stock Exchange of Singapore merged. The HKSE and HKFE underwent demutualization in 2000 to become divisions of the Hong Kong Stock Exchange. In terms of regulatory efficiency and effectiveness, liquidity, economies of scale, settlement risk management, and customer service, the Hong Kong Stock Exchange has improved its competitiveness. In order to deal with the region's increasingly complicated and competitive global environment, more consolidation is anticipated.
Traditional exchanges are creating cross-border mergers or strategic alliances as a result of competitive constraints. After the proposed merger between DB and LSE in 2000 fell through, efforts to integrate Europe's stock exchanges continued. In 2000, Euronext connected the exchanges in Paris, Amsterdam, and Brussels (Zwick, 2001). The launch of the euro and the appearance of more advanced trading equipment have accelerated the pace. Unlike either the German or London Stock Exchanges, Euronext was able to aggregate an annual equities trading turnover of more than $1.5 trillion. This integrated trading, clearing, and settlement system uses cutting-edge technology to increase trading efficiency and decrease costs, which is exactly what stock exchange consumers demand.
There are already discussions with a few other smaller exchanges, such Lisbon. According to Paris Börse, there will only be three or four western European stock exchanges left in a few years, down from sixteen.
Because it makes exchanges more comparable and integrated, the development and transformation of the securities markets and information technology is a significant concern in both Europe and the United States. Investors now face a market whose boundaries are becoming increasingly hazy. As a result, rivalry between stock exchanges as well as between exchanges and automated trading systems is growing (Pagano and Steil, 1996). (Domowitz and Lee, 1996).
Cooperation between nations is growing. In May 2000, Nasdaq established a joint venture in Europe. Additionally, it has ties to the stock exchanges in Canada, Hong Kong, and Japan. More recently, NYSE, the biggest competitor of Nasdaq, has been investigating the viability of a worldwide equity market that could connect exchanges in numerous nations, including France and Japan. One 24-hour market where the shares of the largest blue-chip companies in the world can be traded affordably and effectively is advocated as a realistic aim.
2.7 Theoretical Influences
2.7.1 Industry Dynamics
Figure 1 Porter's Five Forces Model The Porter's Five Forces model is a straightforward tool for analysing the dynamics of the competitive structure of the stock exchange. This model's dynamic force-on-force interactions are what make it so useful. In the context of a stock exchange, the five dimensions are: current industry rivalry in the stock exchange sector; threat of new entrants; relative bargaining strength of suppliers; relative bargaining power of buyers; and threat of substitutes. Within the stock exchange sector, they don't have comparable strength. Over time, their relative power might fluctuate. For instance, the use of open networks based on fixed and wireless infrastructure for business transactions is made possible by Internet technology (Amit & Zott, 2000). Porter (2001) updates the model to include this additional feature in light of the influence of the Internet. Stock exchanges can use electronic trading as a crucial component of their business plans if they can see the Internet as an addition to conventional trading methods rather than as a cannibal. The ability to receive orders based on pricing and priority of delivery over the Internet improves operational efficiency. The highest level of trading efficiency and transparency is provided by the instantaneous dissemination of bid, offer, and transaction prices. The bargaining power of suppliers and purchasers is more static and reflects existing facts, but other forces like the ongoing competition, the threat of new competitors, or the threat of substitutes are mostly of a dynamic nature and are based on expectations. Several elements, some of which are described in Table 2, affect the strength of each of the five competing forces.
The strength of these elements is evaluated in order to determine how appealing a market is.
Table 2
.png)
In this dissertation, the strategic scenario analysis is done using the Porter model. In order to determine the strength of a portfolio of companies, a corporation must examine its current strategic exposure. This is known as strategic situation analysis. With the use of such an analysis, the stock exchange is able to evaluate the competitive strengths (S) and weaknesses (W) of its business and compare them to the opportunities (O) and threats (T) presented by the five forces. The stock exchange's current capabilities and those required to establish, maintain, or develop a competitive edge in the market are not aligned, as shown by the SWOT analysis.
Due to the mismatch, the stock exchange must move forward with the strategic option analysis, a scenario-building approach to its future strategic stance. The three main strategic alternatives are organic expansion, mergers, and strategic alliances. The decision of a stock exchange is based on:
1. The degree of rivalry in the host market;
2. The accessibility of organisational resources for organic expansion; and
3. The capacity to use potential additional value.
Competitor power reinforced by
Construction of additional capacity will invite retribution from the current companies if the degree of competition in the host market is already high and there is excess capacity. In these conditions, a merger with an already-existing stock exchange will lessen this risk.
Furthermore, it's possible that the stock exchange lacks some of the tools and talents it needs to successfully compete in the host market. Faster access to these resources and capabilities is enhanced through merger or strategic alliance. The fastest way to create synergies is through merger. The difficulties are primarily post-integration issues.
Network Society
To concentrate liquidity, mergers are justified. The importance of liquidity is a result of network externality. The phenomenon known as "network externalities" explains why larger networks are more appealing to users than smaller ones (Federal Trade Commission, 2000). There are two key impacts of network externalities on both the old and new economies (Shapiro and Varian, 1999). Because more people will use a product the more attractive it is, demand-side economies of scale were what propelled the old industrial economy. This affects how competitive products fare in today's market. The economics of networks is what drives the new information economy. Positive reinforcement, which makes the strong stronger and the weaker, is the important idea. It is now a stronger force than ever in the network economy; this was also discussed in 2.5.3.
When a good becomes more valuable to one user, there are positive network externalities because other users get attracted to the network and are more likely to utilise the same good. By putting this idea into practise in the context of exchanges, more stocks can move to a single exchange, where the largest pool of liquidity will grow and assist current trades by enabling them to occur at more affordable prices. The more brokers who execute more transactions on one exchange, the more likely it is that other brokers and companies seeking to go public will be drawn to the exchange. Compatibility, compatibility, and coordination are thus crucial elements of a network in complementary fashion.
Domowitz (1995) creates a game between exchanges where traders can choose between two technologies (floor and automated trading), directly relating network externalities to exchange rivalry. In terms of trading, network externalities produce the liquidity effect, whereby the more traders that participate in a market, the less uncertain it is and the more liquid it becomes.
A corporation chooses the exchange with the best utility since it allows for the consolidation of more trading orders and the trading of more intermediaries, which increases liquidity. This is how cross-network externality works (Noia, 1998). An increase in the consumption of a good from the same network results in utility. Investors assume that the more liquid the market, the more aware they are of the company's securities, and the more effective the market is in terms of the speed at which information is disseminated and the promptness with which orders are filled. Markets that are highly connected, transaction-focused, and have a wide reach and a wealth of information are generally said to have a cross-network externality effect.
When a corporation favours a listing exchange where many other companies choose to be listed, there is also a direct-network externality (Noia, 1998). Businesses assume that such an exchange will increase the fairness, openness, and accountability imposed by sound corporate governance procedures while also denoting a high level of market quality. Additionally, the more products the exchange can afford to produce, the better services like clearing and settlement and information dissemination can be offered. Most crucially, when additional intermediaries join the same exchange, the market's volatility may be lower than that of a market with a relatively smaller number of highly connected listed companies (Hull, 1998).
2.7.2 Integration Strategies
Growth and expansion of an acquirer's assets, sales, and market share are obviously the immediate goals of an acquisition. A more fundamental goal is to increase shareholder value through acquisitions and give the acquirer long-term competitive advantages. Only when two businesses are worth more combined than they are separately does a merger bring value (Myers, 2000). It is presumable that mergers are carried out to reduce expenses, increase revenues, or open up prospects for expansion, with the ultimate goal of achieving synergies in human resources and decision-making processes. Changes in ownership and control are drawbacks of mergers. New responsibilities for the senior management are frequently outlined in the merger agreement.
Mergers are frequently divided into horizontal, vertical, and conglomerate categories. A horizontal merger happens when two businesses in the same industry combine.
The iX's intended formation is a recent example. Companies supplying various products in the same market are involved in a vertical merger. Companies that use this technique aim to go up the supply chain in the direction of the final consumer or backwards toward the raw material supplier. In a conglomerate merger, businesses from unrelated industries come together. The broadening of the product offers is its main goal.
Ansoff's Product-Market Matrix
The stock exchange's merger strategy is determined by its strategic decision (Sudarsanam, 1995). Market penetration strategy, as suggested by Table 3, tries to boost a company's market share in its current markets. Selling current products internationally is a component of market extension strategy. Given the comparable organisational framework, it might be a horizontal merger. When both businesses may exchange complimentary resources, value is created. A company can sell new products that are connected to its current products in its current market by extending its product line. To do this, a vertical merger is possible. A conglomerate merger results from a diversification strategy where the goal is in an unrelated industry.
Ansoff's product-market matrix depicts the deep complexity of factors that influence markets' levels of competition or that contribute to a firm's ability to compete. Examples of mergers with components of horizontal and vertical mergers come from case studies of the London Stock Exchange and the Hong Kong Stock Exchange, respectively.
Table 3 Ansoff's Product-Mark
.png)
3. Methodology
3.1 Aim of Project
This project's goal is to demonstrate the present and potential future growth of stock exchanges. They were originally thought of as public entities, but with growing integration and stock exchange mergers, they have transformed into profit-maximizing companies. to explain why they shifted and adopted a more aggressive and integrated strategy.
3.2 Objectives of the project
This dissertation's main goal is to examine the integration and competition tactics of businesses that resemble stock exchanges.
The thesis is concerned with:
1. Stock exchange industry dynamics;
2. The evolution of mergers on stock exchanges;
3. Integration tactics, as well as
4. Trends in future consolidation.
3.3 Why I am interested in this topic
My prior employment at a stockbroker sparked my interest in this subject because it piqued my curiosity about stock exchanges and how they develop, with many people (especially traders at the company) responding to their shifting competitive strategies and the continuous introduction of new technology. I wanted to further my grasp of this topic and determine whether the tendency had spread beyond of Europe.
3.4 Background
Exchanges have had to become more competitive as time has gone on in order to draw quality companies to list and intermediaries to trade; several of them have done this by demutualizing the member ownership arrangements they previously had. Demutualization plan participants are given shares of the exchange. They become exchange shareholders and are therefore potentially eligible for profit distribution. Since that time, exchanges have changed and are now commercially driven businesses with the aim of maximising shareholder wealth.
Cross-border business in Europe is becoming more and more common since the creation of the European Union. Investors in Europe are being encouraged to do more cross-border transactions in quest of lucrative business possibilities by the introduction of the euro and a wider use of equity as a financing mechanism. Nevertheless, despite the allure of international trading, the majority of stock exchanges in Europe are national organisations that exclusively deal in domestic, country-specific equities.
Rivalry is a competition between various exchanges working for the same objective. All exchanges and trading platforms aim to draw liquidity as their main objective. A marketplace for the exchange of assets at the lowest possible transaction cost is a requirement for an exchange to be competitive. Exchange charges and brokerage commissions are examples of direct costs.
According to Lee (1998), one of the characteristics of indirect costs is the lack of liquidity, which prevents the simultaneous purchase and selling of an unlimited number of assets at the same price and without delay. Deregulation of brokerage commissions also suggests a threat to trading as a source of income. An exchange has to entice more businesses to list and more intermediaries to trade in order to increase profitability.
3.5 The General Approach
The researcher's frame of reference, which refers to one's general knowledge, norms, and values, has an impact on the entire approach of a study (Wiedersheim-Paul and Eriksson, 1997). This project's methodology is built on the frame of reference, which functions as a personal scale. The specific scale of the investigation is impacted by the used theories and models. As a result, it is crucial that the researcher retain an impartial viewpoint. I have read a variety of theories and works in the field of my studies in order to become objective. However, it is challenging to take a totally objective approach because a significant amount of the literature and articles itself contain interpretations and viewpoints that can affect my judgement.
You can perform a research project using one of two different ways. One method is a deductive approach, in which you create a theory and a hypothesis and plan a research strategy to test the hypothesis. Another method is an inductive approach, in which you gather data and create a theory as a consequence of the study of that evidence. Since my study is primarily based on articles and I'm examining the evolution of stock exchanges and how their strategies have changed over time, I've opted for a logical approach. I will use current literature and models to test the empirical results.
3.5.1 Choice of Method
Both quantitative and qualitative methods are acceptable. A quantitative approach is defined, structured, and distinguished by being selective and separated from the information source (Holme & Solvang, 1996). The method, which is based primarily on numerical observations, seeks to generalise a phenomenon through a systematic study of selected data, with statistics indicators playing a key part. On the other hand, a qualitative method, which is structured less, aims to determine whether the data is generally reliable. The method tries to foster a shared knowledge of the topic being studied by using verbal descriptions rather than just numerical facts.
I have decided to use a strategy that is primarily qualitative with some quantitative elements in order to attain the goal. The survey I conducted in the form of an interview, which was aimed at active investors, brokers, and participants in two stock exchanges, is referred to as the qualitative method. Using the London Stock Exchange and the Hong Kong Stock Exchange as examples, I hope to ascertain through the interview whether mergers in Europe are more advantageous than those conducted elsewhere. Additionally, how each exchange competes and how technology and other elements are influencing exchanges' rising methods for competition. The outcomes of the interviews have been examined using the quantitative method.
3.6 Data Collection
The majority of the information for my study was gathered through an interview and research using published materials on the competition and integration tactics of stock exchanges.
3.6.1 Primary Data
Data that is acquired with a specific goal in mind and is necessary to complete secondary data is referred to as primary data (Widersheim-Paul & Eriksson, 1997). An interview with a private client broker, a member of an investment bank, and representatives from two stock exchanges served as the project's main source of data. One interviewer is from UBS, a Swiss Financial Services Corporation, while the other is from Brewin Dolphin Securities Ltd., a private customers broker. Additionally, I spoke with participants from the London Stock Exchange and the Hong Kong Stock Exchange. Three of the participants had the interview performed over the phone, while the other two decided to have the interview conducted by email. All 5 people in the interview voluntarily participated and answered the questions.
There are nine questions in the survey about whether stock market mergers are advantageous for all parties and whether they are a European phenomenon or are occurring elsewhere, including in Hong Kong. Macroenvironment, integration tactics, partnership and competition difficulties, the impact of technology on stock markets, the bargaining power of both buyers and suppliers, and future consolidation trends were all topics covered throughout the interview.
Known project management and consulting approaches were used to plan and carry out the project (Cope: 2000). (Maylor: 1996). Given the industry's rapid evolution, this was viewed as being vital. The qualitative data were analysed and evaluated using the framework of industry dynamics and integration techniques described in section 2.6 (Grant: 1998). (Doyle: 1998). Last but not least, merger problems and strategy selection were introduced (Hart, 1998).
3.6.2 Secondary Data
The term "secondary data" refers to previously compiled and condensed information about the issue at hand. This information comes from databases, books, journals, and the Internet, among other sources (Wiedersheim-Paul & Eriksson, 1997). The literature that has already been written about the topic at hand, notably journal articles and online data sources, is referred to as the secondary data employed in my research. The search for information focused on the relatively young and dynamic field of stock exchange competitiveness and integration plans.
The Coventry University Library and internet search engines were where the majority of the literature was located. I also borrowed books from the library, but they weren't very helpful because they were out of date and lacked the knowledge I required.
3.7 Criticisms of the Sources
There may be elements in the primary and secondary data sources that have an impact on the calibre of the study. To determine the overall quality of the study, one must also take the validity and reliability of the research into account.
3.7.1 Primary Data Criticisms
The interview I performed is useful since the information gathered is distinct and modern in character, and the questions may be created to precisely correspond to the topic under study. However, the interview is open to the respondents' arbitrary judgements. The responses reveal a person's subjective memory for particular past occurrences when they are asked about past and future events. The respondents' responses might have evolved as a result of specific recent or upcoming events, or they might have been influenced by others.
As a result, the responses provided by respondents may be skewed toward reflecting their opinions on the relevant subject. Brokers will also have a distinct perspective when answering the same questions as stock exchange members. In addition to certain respondents' time restraints and the stock market members' partiality toward their own companies' interests, which prevented them from being completely truthful; limits were also brought about by respondents' lack of interest and secrecy.
3.7.2 Criticisms of Secondary Data
Since stock exchange competition and integration techniques are a relatively recent topic, there are many different ways to interpret the literature that has been written about them. I have made an effort to approach stock exchanges objectively. The vast majority of secondary data is of a contemporary nature and is derived from articles. I therefore believe that my secondary data is really relevant.
3.8 Validity
If a study just includes the topics that one wishes to explore and nothing else, it has a high level of validity (Thuren, 1991). Validity is the degree to which the research's data gathering and data analysis accurately reflect the world under investigation. In my opinion, the primary and secondary data I have gathered are very relevant to the topic of stock exchange integration and competition strategies.
3.9 Reliability
Reliability shows that a study's processes, including the methods used for gathering data, may be repeated with the same results. In my situation, I spoke with brokers and participants in the London and Hong Kong Stock Exchanges. I believe the same interviewing process would be simply transferable to another similar group of interviewers in the same industry. As a result, I think the study satisfies the reliability requirements. The answers given, however, are prone to subjectivity based on the respondents' areas of expertise and perceptions of mergers in Europe and Asia. The responses might also be skewed to some extent by retrospective bias.
4. Qualitative Analysis
4.1 Analysis of Industry Dynamics
Figure 1 shows how the Porter's Five Forces Model shapes the dynamics of the industry. Due to a competitive market, strong providers (listed companies), cautious customers (intermediaries and eventually investors), weak substitutes, and high entry hurdles, an exchange is in a very vulnerable situation.
4.1.1 Industry Dynamics in the Porter's Five Forces Model
Source: Porter, 2001
Threat of Substitutes
ECNs pose a threat of substitution as ineffective replacements.
• Low-cost, commercial distribution methods.
• Mainly compete on price
• Take advantage of a market that is quote-lack driven's of service to try and consolidate liquidity.
• Stock exchange parasites.
• New substitution risks won't be brought about by proliferation in either Europe or the Asia-Pacific region.
Obstacles to Entry
High entry barriers
• Why trading alone makes it challenging to protect proprietary from new competitors like ECNs.
• Capital consuming.
• Exorbitant expenditures associated with preserving sound corporate governance standards and a stable market.
Bargaining Power of Suppliers (Listed Companies / Network Providers)
Listed Companies
• An increase in rivals broadens the selection of listing exchanges and gives listed companies more clout.
• Listed firms can approach investors through e-brokerage over the Internet, lowering the leverage of intermediary stock exchanges.
Network Providers
• Giving access to connectivity services.
• Powerful negotiating position in terms of technological expertise and bandwidth
Buyers Bargaining Power of Channels / End Users
Cautious customers (Investors)
• More choice, less loyalty.
• Lower switching costs over time.
Effective Online Brokerage Channels
• Improves bargaining power over traditional channels or eliminates strong member brokers
Rivalry Among Existing Stock Exchanges
A competitive market for stock exchanges
• Decreasing brokerage commissions increase competition.
• Dual listing removes regional restrictions and allows for a large number of participants to provide identical proposals and standardised goods and services.
• The pressure to increase shareholder wealth is increased as a result of demutualization.
• The transfer of listing responsibility to a different body is comparable to an ECN.
4.1.2 A Competitive Market
Numerous factors influence competition, including the availability of immediate services, price discovery, price volatility, liquidity, transparency, and transaction costs. According to the perspectives I gathered, there were two main causes of competitiveness. First, thanks to technical advancement, services may now be delivered more quickly and affordably thanks to connectivity to regulated stock markets. Second, the urge for more cross-border trading is being driven by the growing influence of retail investors. There are further regional factors. The liberalisation of brokerage commissions, according to a member of the Hong Kong Stock Exchange, was expected to increase competitiveness in Hong Kong.
Demutualization was seen by regulators to be the best method of tying profits to members who also owned equity in the exchange. This encourages them to maximise shareholder wealth and so raise the stock exchange's level of competition. Liquidity and transaction costs were of most importance to investment banks and brokerage firms.
Liquidity and transaction costs were of most importance to investment banks and brokerage firms. If there is no information asymmetry and an intermediary must choose which market to trade on, they will, on balance, select the lowest-cost market. When there are additional intermediaries, an exchange will be more appealing to an intermediary since, theoretically, the more intermediaries drawn to the exchange floor or automated system, the higher the liquidity. Additionally, increased liquidity draws additional intermediaries. The literature on cross-network externality supports this. Regardless of variations in listing criteria and securities regulation, liquidity draws businesses. Companies desire to list on an exchange where there are numerous other listed companies. The direct-network externality and this agree.
Increased consumption of a separate good that is sort of connected to the same network results in utility. Numerous empirical studies demonstrate that liquidity significantly affects the value of securities. According to Pagano et al. (1995), listing on a significant exchange might draw in a lot of investors by serving as free advertising for the business.
This idea was made by Merton (1987), who demonstrated it in a capital-asset-pricing model with imperfect information by demonstrating that stock prices increase when investor awareness of the company's securities increases.
"At the same time, firms might choose to list on an exchange with a large number of listed firms (direct network effect), as it might be a sign of the market's quality or because they expect that there will be more intermediaries there and the variance of such a market may be lower than that of an exchange with a very small number of highly correlated firms. The more listed companies and trading intermediaries there are on a certain exchange, the greater value being listed has for a company. When all other factors are equal, a company will want to list on reputable exchanges with a large number of other listed companies because the market is more liquid when there are 100 listed companies as opposed to ten, and there are more trading intermediates available.
4.1.2 A Competitive Market
Network Providers
To provide physical connectivity services to an exchange, network providers are utilising their expertise. They are required to develop the foundation of the trading system for an exchange. They have considerable technical expertise and bandwidth. Initial outlays are enormous. They are able to secure stock exchanges that require them for on-going trading system maintenance and software upgrades in the future.
Listed Companies
Listed businesses make poor suppliers. A market influencer in the securities and futures industry stated that initially businesses prefer to list domestically since their clients and suppliers are more familiar with them. Regulators and investment banks/brokerage firms concurred that firms' negotiating power was minimal when selecting their primary listing exchange, but increased when selecting their secondary listing exchange, which is consistent with literature. They will take into account a trade that:
• A crucial number;
• The market's standing for effectiveness and quality;
• The aptitude for luring money.
In addition to the aforementioned, investment banks and broker-dealer businesses are better positioned to comprehend the demands of companies because they are particularly focused on the listing process, following disclosure obligations, securities legislation, and investor protection.
The literature that claimed dual listing was redundant and impractical since listed companies had to adhere to two sets of regulatory requirements, accounting standards and securities legislation, increasing their indirect costs, served to further bolster the weak negotiating position of businesses.
4.1.4 Bargaining Power of Buyers
End-users
Investors cannot tell the difference between an ECN and a monopolistic exchange in an order-driven market as long as the identical order is automatically matched and executed at the best price. Investors do not select a specific exchange if the stock they wish to purchase exclusively lists there, the broker business stressed.
Brokerage businesses came to the conclusion that the key factors in an investor's decision to choose a broker were accessibility to market information, ease of execution, and cheap transaction fees.
Financial intermediaries of all stripes take on greater and more risk management tasks (Allen and Santomero, 1996), which are lucrative and can replace other revenue streams that are sharply declining owing to the restructuring of financial markets (such net interest income). They are now able to trade (directly or through subsidiaries) as broker dealers on stock exchanges thanks to evolving legislation and new technologies.
Nowadays, intermediaries have a choice in where they transact. Because it is more appealing for diversifying their own portfolios and the portfolios of their customers, they might find an exchange with more financial goods listed to be more fascinating.
However, despite competition in charges and spread, intermediaries may find an exchange with many more intermediaries more appealing because they should help the market by providing liquidity. The selection of where to establish an intermediary is influenced by six criteria. Brokerage commissions, trading goals like speed and accuracy, legal constraints, economies of scale, network externalities, and improvements to order routing tools are some of them. Similar to publicly traded firms, intermediaries seek to trade on an exchange with a large number of other intermediates who can progressively increase market liquidity. The literature on positive network externality supports this.
This is also advantageous to an exchange since it can compete to draw more middlemen to the floor or to its automated system. The more middlemen, the higher the connection fees, and the larger the client base, the higher the trading commissions. Exchanges draw as many middlemen as possible in order to increase their effectiveness, quality, and reputation. While the latter draws more businesses with even bigger market capitalization to list on a more liquid exchange, the former improves scales of economies in the supply of transaction services.
New Channels
Online brokers have recently developed to compete with conventional brokers. Their expansion was place without significant opposition from conventional brokers, notably at a time of rapidly increasing stock market activity, stagnant customer base growth, and the development of Internet channels. As a result, the vast majority of active self-directed investors have already moved their trading online. A director of a multinational firm thus believed that a typical broker needed to specialise in order to compete in various market niches. One sector would be retirees who preferred stand-alone delivery of goods and services to a combination of personalised services and physical locations; another could be those in their middle to late twenties who were not financially stable but had a high potential for future income growth. The conventional powerhouse brokerage firms are aggressively exploring online methods as they quickly become aware of the possibility of direct retail brokerage services. And a lot of people are doing it globally.
Although brokerage companies in Asia asserted that e-trading only generated a small amount of turnover, European investment banks generally agreed that new online brokerage channels had greatly strengthened buyers' influence in Europe. Brokers must use a combination of traditional and online techniques to cater to the needs of varied clients. They can use financial platforms on the internet.
Additionally, they can modify the services to fit particular market niches, such as automated guidance, online financial planning, longer trading hours, and research delivery.
4.1.5 Inefficient Substitutes
The functions of an ECN are contrasted with those of the current electronic trading system in Table 4. These are well-established alternatives to the trade proposition from the viewpoint of an intermediary. However, as indicated in Figure 2, the interviewees generally believed that the ECN resembles a low-end outsourcing trading function.
As a result of lesser liquidity, increasing transaction costs might rapidly outweigh the advantages of outsourcing (Teece: 1986). In actuality, the savings in IT personnel and resources may be negligible in comparison to trading volume and monitoring expenses (Williamson: 1985).
Additionally, the majority of the viewpoints I gathered appeared to concur that the business model resembled an order-driven market, as is the case in Europe and the majority of East Asian nations. Uptake in these nations was essentially flat. Investor caution brought on by uncertainty and lack of trust has resulted in a lower acceptance rate than expected. They were worried about the value and service quality. The inability of the ECN to attract liquidity and the lack of price transparency worried investment banks and brokerage businesses.
.png)
Table 4 - ECN versus Traditional electronic trading platform
Note: New functionalities are highlighted in italic.
Figure 2 - Ansoff's Product Matrix
4.1.6 High Barriers to Entry
The idea that a national stock market is a monopoly by natural law is no longer valid. Stock exchanges are now commercial enterprises rather than public utilities. If an ECN wants to be registered as an exchange, it must meet a number of criteria, including having enough financial resources and following rules and regulations that guarantee an orderly market and provide investor protection.
Alternative trading systems, new exchanges, and established exchanges have all entered the market as new participants in an effort to draw listings and international trade to their marketplaces. All participants in the discussion agreed that only the most effective exchanges—those that provide trading in stocks from all over the world and provide the most cutting-edge and aggressive financial instruments—should endure in the long run. Academics believed that stock exchanges were resource-wasting and redundant because they used the same fundamental trading mechanism. This was particularly true in Europe, where after 1996, the growth of distant membership access clearly made cost-effective cross-border trading possible and removed key obstacles to the development of a shared and expanded pool of equities market liquidity. The market would become even more integrated if there was a single European currency. However, persistent discrepancies in law and regulation posed significant challenges to mergers at the national and international levels, ultimately leading to the formation of a transnational exchange. Academics asserted that there have been continuous disagreements regarding a common set of regulations between LSE and DB following their regional merger.
4.2 Case Studies
4.2.1 International Exchange - London Stock Exchange: A Prototype of Horizontal Merger
The first recorded instance of share trading in the United Kingdom dates back to 1760, when 150 brokers who had previously belonged to the Royal Exchange established a club at Jonathan's Coffee House to buy and sell shares. The club's name was changed to Stock Exchange by a vote of the members in 1773. The Big Bang of 1986 caused a significant upheaval in UK securities trading. The biggest impact was the cessation of single capacity trading and the opening up of dual capacity operations for market makers. Brokers purchased and sold securities on behalf of clients in single capacity trading, whereas jobbers maintained stocks of securities that they purchased and sold to brokers. After 1986, market makers were able to act as jobbers and deal with investors directly, cutting off the middleman broker.
The minimum commission rate was eliminated. Instead of trading on the floor, it is now done from separate dealing rooms through computer and telephone. To improve market speed and efficiency, Stock Exchange Electronic Trading Service was introduced in 1997. The settlement meant that CRESTCo, a new electronic share-settlement service provider, took over LSE's operation. LSE went public in July 2001 after converting to a public limited company in 2000. The Frankfurt Stock Exchange was founded in Germany 223 years ago as a private organisation run by several businessmen. Frankfurt currently leads the German stock market, with a total volume of almost 5,200 billion euros in 2000. The full range of services and system applications, from trading in securities and derivatives to clearing, providing market information, and developing systems, are all included in DB. The Xetra trading platform in particular has elevated DB to the position of second-largest fully electronic cash market globally.
From LSE's standpoint, the proposed merger to create iX is reviewed. The LSE SWOT analysis is summarised in Table 8.
.png)
Table 5 - SWOT Analysis of LSE
Building Market Credibility
LSE was looking to form more partnerships with its rivals in Europe and other places in order to continue establishing its market credibility and to eventually establish a Pan-European stock exchange. This is consistent with EU strategy, which seeks to liberalise market access and establish a unified European financial services market.
Consolidation
The number of cross-border transactions is rising as institutional and ordinary investors' investment strategies shift to a sectoral rather than a geographical investing focus. LSE aspired to promote liquidity and price transparency while consolidating trading volume in the fragmented European equity market.
Synergy
The LSE intended to unite in order to create a unified trading platform with superior order routing capabilities, which would increase efficiency. Additionally, a merger might make it possible to share current technology, cutting down on transaction expenses.
(ii) Merger Strategy
On May 3, 2000, Exchange, also known as iX, was originally launched. The initial merger discussions between LSE and DB took place in July 1998 as a result of growing customer demands and competitive pressure. With the aid of market harmonisation across Europe and the ease of a single passport licence, LSE seeks to create a joint trading platform with DB. The headquarters of iX would be in London, with its main operations being in Frankfurt.
In an effort to establish a durable competitive advantage, LSE chose a horizontal merger to address the mismatch between the resources, competencies, and opportunities available to both exchanges. It is possible to significantly reduce the duplication of use of resources, including the infrastructure for trading, R&D, and surplus operating capacity. Additional resources that manifest as strategic assets, such as market dominance and entry obstacles like the experience curve or size, can be improved.
The particular abilities of an exchange, such as its architecture, ability for innovation, and reputation, can produce a long-lasting competitive advantage.
iii) Mergers Challengers .
The merger of the Frankfurt Deutsche Boerse with the London Stock Exchange (LSE) was announced for 2000. The two were supposed to collaborate with Nasdaq to establish a Frankfurt-based exchange for high-growth European equities.
The technological issues at LSE were brought to light by the merger, which hurt the company's reputation and was one of the main reasons they were unable to finish the integration.
The issues with LSE date back several years. It and Deutsche Borse sought to create an uniform European trading platform two years before to the planned merger, but they were unsuccessful. Gavin Casey, the outgoing chief executive of the London Stock Exchange, has come under fire in European newspapers for failing to put in place a stable electronic trading system—two multimillion dollar attempts at electronic trading failed—and for failing to raise the exchange's profile in the face of increased competition.
Political obstacles and competing interests among the partners prevented the idea of a pan-European market from really taking hold. According to an LSE member, First, there are significant political impediments. The national regulatory parties resisted ceding their authority and clearly established national jurisdictions. This was supported by the literature, which noted that nations would want to keep their stock exchanges with their established reputation and source of income.
Second, even though all settlements could be made in euros, each stock exchange had its own clearing and settlement system that operated in its own jurisdiction. This implies that any further delay in settlement would incur further financial costs.
Third, from an economic perspective, stock exchanges are businesses that demand significant expenditures in technology. The possibility of creating economic synergies as a result of the merger is not assured.
Costs to LSE
A broker I spoke with thought that the low offer price was caused by the LSE's undervaluation. Even if the merger had gone through, the LSE would have had to pay a significant transitional fee to connect with Xetra, the proposed German trading system. The LSE member emphasised that there was relatively little market size that could be enhanced through merger per unit effort. Additionally, he asserted that because of LSE's size, a merger with a stock exchange with a similar market size would be challenging. In Europe, 55% of all stock trading volume is conducted on the LSE. The LSE can earn a maximum of 9% from Switzerland, 7% from Italy, 5% from Spain, and 3% from Sweden if it joins with the most important and active European stock exchanges. To the LSE, such a distinction is inconsequential.
Regulation and Compliance
It might be argued that the combined company would potentially increase regulation and compliance rather than necessarily streamlining the listing and flotation process. Academics believed that there was still some debate on whether a cross-listed firm should be subject to the regulatory requirements of either its country of origin or both. Any firm wishing to list its shares on the LSE would just need to adhere to German regulations, according to DB's proposal. The Financial Services Authority vigorously opposed this idea, demanding that all share trades in the UK be subject to UK regulations regardless of where the initial stock exchange was located. As mentioned above, worries about regulatory harmonisation and the possible magnitude of running costs led to the official withdrawal of the iX merger plan.
4.2.2 Hong Kong Exchanges and Clearing Limited: A Typical Model of Vertical Merger
Reports of stock trading in Hong Kong go back to the middle of the nineteenth century. The Association of Stockbrokers in Hong Kong, the first official market, didn't start operating until 1891; in 1914, it changed its name to Hong Kong Stock Exchange. The Hong Kong Stockbrokers' Association, a second exchange, was founded in 1921. These two exchanges united to become the Hong Kong Stock Exchange in 1947 with the goal of rebuilding the stock market following World War II. Three further exchanges were established as a result of Hong Kong's swift economic development: the Far East Exchange in 1969; the Kam Ngan Stock Exchange in 1971; and the Kowloon Stock Exchange in 1972.
To tighten market regulation and integrate the four exchanges, HKSE was established in 1980. On April 2, 1986, trading on the new exchange began using a computer-assisted system. The Hong Kong stock market was the second largest in Asia and ranked tenth in the world by capitalisation as of September 2000.
The HKFE was founded in 1976 to offer more than 130 participating organisations, many of which are connected to international financial institutions, efficient and diversified markets for trading futures and options contracts. The futures and options markets for a wide variety of goods, including equity index, stock, interest rate, and foreign exchange, are operated by the derivatives market under HKFE. In a liquid and well-regulated market, it maintains a strict risk management system that enables participants and their clients to meet their investing and hedging demands.
In 1989, the HKSCC became a legal entity. It was the primary counterparty for all CCASS members when it established the Central Clearing And Settlement System (CCASS) in 1992. Share settlement follows the T+2 mechanism and is done on a continuous net settlement basis by electronic book entry to participants' stock accounts in CCASS (the second trading day following the transaction).
The merger is examined from HKSE's viewpoint. See Table 6:
.png)
Before the finance secretary of the Hong Kong government announced the reform of the securities and futures market in March 1999, the settlement and clearing services, trading of derivatives, and trading of stocks were handled, respectively, by HKSE, HKFE, and HKSCC. The 1997–1998 Asian financial crisis had a significant negative impact on Hong Kong, which had long been regarded as the region's financial flagship. Hedge funds attacked the Hong Kong Dollar's peg to the US Dollar in August 1998 and succeeded in accumulating sizable positions in both the stock and futures markets. Because HKSE and HKFE were independent of one another, regulators and government representatives were unaware of this. They were self-regulatory businesses that infrequently shared information and transactional data. The government discovered anomalies in the settlement policies as it worked to cover the short positions in the stock market intervention. HKFE required the settlement of futures on a T+3 basis, whilst shares traded on HKSE were settled by T+2 (the second day after the trading day) (the third day following the trading day). Such incompatibility resulted in higher borrowing expenses.
The following highlights additional factors that led to the merger, in addition to the policies of both are being aligned:
Acquisition of liquidity pool
Regulators, brokerage houses, and academic research all held the solid belief that a liquid exchange could draw top-tier businesses. Since more orders will be aggregated for execution as a result of more high-quality firms, this is consistent with positive network externalities.
Commercially driven business
According to a member of HKEx, the government wanted to combine the many markets that were before operated as cosy brokers' clubs and administer them as shareholder-owned corporations.
Elimination of inconsistency in product development
In the process of creating new products, a disagreement developed between HKSE and HKFE. For instance, due to their strong correlation with the underlying shares, warrants, which are typically traded on futures exchanges, are HKSE products. Since the main difference between the HKSE and HKFE markets is the goods, they aren't really competitors. The operating system is the same even when the product is artificially separated.
Economies of scale
The government wants to avoid duplicative investments in trading and computer systems and gain economies of scale in research and development. This is crucial if Hong Kong is to maintain its status as a hub for Mainland China's international capital formation.
ii) Merger Techniques
The merger was mostly driven by the government. The exchanges will be combined as part of this vertical merger, and they will pool their resources to work toward shared goals:
1. Eliminate inconsistencies in the application of settlement policies and improve product development cooperation.
2. Reduce resource duplication in serving overlapping markets.
3. Develop market clout to establish the Asian time zone as a mainstay of the international securities and futures markets; and
4. Become the go-to Asian partner for significant exchanges looking to forge worldwide partnerships.
As part of the reform, the clearing houses HKSE, HKFE, HKSCC, and two more clearing houses amalgamated to become HKEx after demutualizing and merging. The merger was finalised on March 6th, 2000, and on June 27th, 2000, HKEx introduced its shares to the stock market.
iv) Problems with mergers
Market reforms started out slowly because local brokers, who make up the bulk of brokerage firms in Hong Kong and only have a few hundred clients, were badly hurt by the 1997 stock market disaster because of irrecoverable margin financing borrowings. They opposed any move that may put their company at even greater risk.
The most difficult task was also combining two trading systems because it required a lot of work and money to execute user acceptability testing and rollout operations.
4.3 Implications and Discussion
i) Strategic Choice
Both instances suggest that a merger is an obvious strategic choice to accomplish the aforementioned goals. Although the method of strategic analysis is rather broad, considerations unique to a particular nation or region are what ultimately determine which course of action to take.
For instance, competition among the stock exchanges in Europe focuses more on technological cooperation than anything else. The primary focus in Asia is the idea of creating a whole financial services organisation within each area.
Exchanges have realised that they must become traded firms themselves in order to respond commercially to competitors. DB was now traded and listed. Previously, in July 2001, London demutualized and went public. In June 2000, the clearinghouses, HKFE, and HKSE were merged into HKEx. All respondents agree that, although there may be fewer trading systems in three to five years, there will likely be fewer clearing and settlement processes.
ii) Consolidation Obstacles
Although the investigation covered some national and regional features of consolidation, the idea does not appear to be universal for the following reasons:
1. Thanks to technology, intermediaries may now provide investors with services at a significantly cheaper cost and without being confined by national borders.
2. Regulators underlined that because each stock exchange serves a different market, it would be expensive to balance all of the interests of the numerous market user groups. Cross-border mergers in particular necessitate the balancing of regulations from several jurisdictions.
3. Because the cost of capital might be quite high, the major expense of the transaction is the delay in settlement. Because investors would be able to trade at more affordable costs as a result of the deregulation of commission, transaction fees are not very important.
Exchanges are creating infrastructure links to support mergers or alliances at the back end after spotting a possible opportunity.
4. The stock market is a national resource. Political parties will not agree to share a set of laws and regulations from several jurisdictions or give up their dominant position in a merger.
iii) Patterns of Merger
The LSE and HKSE have adopted policies of horizontal merger and vertical merger, respectively, in response to the growing competition. Europe was going through a period of fierce struggle between two convergence theories. Many market participants were persuaded that domestically regulated financial markets were antiquated and uncompetitive by the emerging development of a pan-European market with a common currency. The horizontal merger paradigm is being promoted by the European Securities Forum. A more open architecture along three functional levels—trading, clearing and settlement, and custody—replaces national exchanges in this paradigm. Through a single point of entry, each market participant can so receive remote access to a variety of pan-European services.
The basic presumption is that only the most effective exchanges should endure over the long term, trading equities from other European nations and providing the most cutting-edge and aggressive financial instruments. Another merger concept is the fusion of the depository, clearinghouses, and exchanges within a single nation. Traditional exchanges are typically attracted to this strategy. They understand that trading does not create enough revenue on its own to compete with other less expensive Internet-based alternative trading platforms, which is why they want to establish a whole financial services organisation. Additionally, buyers and sellers can now trade and settle transactions outside of exchanges and clearing houses.
Due to the absence of enablers like a single currency, consolidation across borders in Asia has not occurred as much as it has in Europe. Furthermore, given the generally low trading activity in most Asian nations, the claim that a merger will considerably attract liquidity is not very compelling.
HKEx and LSE have continued to meet the demands and overcome the hurdles despite the aforementioned uncertainties or obstacles. They are more aware than ever of the need to put their strategies into practise in a variety of ways.
5. Conclusion
The research has shown that the stock exchange sector is extremely dynamic and rapidly changing. Since stock exchanges were previously legal, public or private monopolies, competition among them is a relatively new phenomena. ECNs, incumbent exchanges, and new exchanges are all in competition with one another in order to attract liquidity. The conclusions have a number of ramifications.
First, through partnerships and links in technology, exchanges influence the globalisation of capital markets. Through business development activities and appropriate mergers, acquisitions, joint ventures, and alliances, stock exchanges hope to expand their current operations and broaden their scope. The most practical strategic option for stock exchanges among these is a merger. It provides a tactical advantage when "speed to market" is crucial, in addition to being the fastest way to enter a new market. When two value chains are rearranged to produce or enhance the competitive advantages for the merged business, the merger can realise any anticipated synergies. One or both value chains may need to be changed as part of the reconfiguration process, most notably in the organisational structure changes and new management responsibilities. Second, different merger types are motivated by various value creation objectives. A stock exchange should be able to choose a target exchange that will aid in achieving its strategic goals and adding value after conducting studies of its strategic situation and strategic decision. The vertical merger was used by HKSE to considerably reduce infrastructure expenses for both exchanges and share resource consumption. A single passport and a shared currency in Europe made it easier for LSE to employ a horizontal merger to expand geographically.
Further consolidation would appear to be advantageous, though, as stock exchanges can benefit from economies of scale, increase market liquidity, and draw more investors.
However, given the state of the economy right now, vertical integration in line with investors' preference for domestic markets seems to be a sound business plan. Merger discussions will soon start once a steady economic outlook can be determined. In the long run, there might be a single global stock exchange for blue chips and national specialised exchanges for other market categories. But first, Europe needs to do a much better job of harmonising its laws and regulations.
Thirdly, there is an intriguing convergence among all the viewpoints I have gathered, most notably that they disagree with the literature on the potential for future stock exchange consolidation. There is a general consensus that the clearing and settlement systems will cooperate strategically and reach greater technological agreements. Strong market competitors will never try to reach arrangements with weaker competitors. This supports the claim made by the regulator that LSE favours incompatibility since, on the one hand, it already has a sizable network to generate its own liquidity and is hesitant to cede its dominating position to other exchanges in a merger.
Consolidation among exchanges should be expected given that institutional investors' and investment banks' mergers have increased demand for global access to exchange facilities. Political factors, however, prevent the compromise from creating a unified set of regulatory norms. It is unlikely that the transaction levy will be reduced in price up front, especially in light of the deregulation of brokerage commissions. As exchanges look to achieve economies of scale, consolidation is therefore anticipated to continue in the form of collaboration among clearing and settlement providers and strategic alliances in technology innovations.
Fourthly, the US has mostly been the source of ECN's expansion. The US exchanges, particularly Nasdaq, are criticised by European and the majority of Asian exchanges for not creating central limit order books, which concentrate liquidity and reduce execution costs. These exchanges created order auto-matching techniques as a result of converting to electronic trading in recent years, which allowed them to reject incoming ECNs. Furthermore, the largest pool of liquidity was already under the jurisdiction of these established exchanges. For ECNs to survive, price competition alone is insufficient, especially in light of the liberalisation of brokerage commissions.
Finally, from the standpoint of the investor, the operation of an ECN is identical to that of an order-driven trading system. Even while these crossing networks are less expensive, they do carry some dangers from the standpoint of the efficiency of the capital market as a whole. If intermediaries migrate their trade from exchanges to ECNs, liquidity suffers. A growing amount of value-based securities transactions will be impacted by a declining portion of the entire market. It is obvious that liquidity will decrease, prices will become more volatile, and smaller deals will ensue if the prices dictating trades become fewer. Risk and equity capital costs will consequently increase.
Many of the questions discussed in this dissertation lacked clear-cut solutions, necessitating the use of additional analytical judgement. Among other things, the following issues will need more clarification and might be left as more in-depth research topics:
1. The rationale behind the presence of the two distinct systems, order-driven and quote-driven, as well as when and when one may take precedence over the other.
2. Consolidation at the clearing and settlement levels: costs and advantages.
3. The likelihood of creating strategic alliances or cooperative agreements with ECNs.
Bibliography and References
.png)
.png)

Thesis Writing
THE IMPACT OF THE INTENSITY OF FIRMS’S INTANGIBLE ASSETS ON THE VOLATILITY OF THEIR PRICES
CHAPTER ONE - INTRODUCTION
1.1 Background of study
Intangible asset size increase and its impact on business growth during the last 20 years provide an intriguing area for investigation. Strong market incentives for analysts to supply value-added information for high-intangible organisations are implied by the growing significance of intangible assets and the lack of clear information regarding the contribution of intangible to profitability. According to Gold finger (1974), the development and management of intangible assets, rather than the production of physical things, is the current source of economic value and prosperity1.
Forecasting profitability for companies with a high concentration of intangible assets is becoming more and more challenging.
Using two sets of stocks, Chan, Louis K.C., Lakonishok, and Sougiannis [1999] hypothesised that businesses with a high R&D intensity had a unique impact on returns. R&D-intensive firms often outperform stocks with little to no R&D within the group of growth stocks. Similar findings come from their naive examination of how advertising affects returns. They offered proof that R&D intensity has a favourable correlation with return volatility2.
In order to increase revenues, the pharmaceutical business spends billions of dollars each year on intangibles. Investors are therefore naturally curious about whether intangible investments and costs really increase shareholder value. Heiens, Richard A.; McGrath's study,
Four intangibles—advertising, research and development (R&D), goodwill, and other intangibles—are examined to determine their influence on market-adjusted holding period returns in Leanne C. and Leach, Robert T.'s 2008 study (HPR). Their findings seem to suggest that, among these factors, advertising really seems to have a significant and advantageous influence on HPR.3
It has been noted that the stock market behaviour of so-called "knowledge corporations" usually differs from that of fundamental sectors. Additionally, there is some data that suggests a relationship between a company's intangible assets and its share market value [Amir and Lev 1996, Lev 1997, Lev and Zarowin 1998].
The necessity for understanding how businesses produce and manage their intangible assets and how intangible assets effect company share prices has expanded as a result of the growing relevance of intangible assets to investors, analysts, and shareholders.
1.2 Statement of the problem
This finance assignment help - thesis seeks to provide an answer to the question:
What is the impact of the intensity of firm’s intangible assets on the volatility of their stock prices?
1.3 Purpose of the study
This research attempts to
• An outline of the problems with intangible assets.
• After presenting an introduction, various types and definitions of intangible assets, and evaluating the effect of intangible asset intensity assets in a company on the erratic nature of the company's share prices will be carried out.
1.4 Significance of the study
The relevance and usefulness of increased study on intangible assets is further supported by the rising contribution of intangible assets to firm value development in recent years.
The research will be helpful to shareholders, analysts, and investors who are curious in how a company's intangible asset size impacts the volatility of its stock price.
The impact of intangible asset intensity on stock prices will also be discussed and subsequent research on the basis of this study.
1.5 Limitation of the study
The manufacturers of basic medicines, food goods and beverages, information technology, and manufacturers of basic metals are the four industrial groupings whose listed businesses provided the data for this research. These companies had consolidated balance sheets for between eight and ten years. As a consequence, the conclusions we draw are based entirely on the data utilised in this research.
1.6 Layout of the study
There are five chapters in the research. The backdrop of the research, the issue statement, the objective of the investigation, its importance, and its limitations are the main topics of the first chapter. An overview of intangible assets is provided in Chapter 2. That serves as a definition, categorization, and method of value. The study design and a review of earlier studies in this field are covered in chapter three. In chapter four, the data sample and empirical findings are presented, and in chapter five, the findings are summarised and conclusions are offered.
CHAPTER TWO - OVERVIEW OF INTANGIBLE ASSETS
In the context of innovation, intangible assets have been widely analysed in economic literature4. On the economic nature, definition, and categorization of intangible assets, there is often no consensus.
2.1 Definition of intangible asset
For the sake of simplicity, we refer to an intangible asset as a value-adding item that is not physical in nature5.Corporate intellectual property, including goodwill and brand awareness, includes things like patents, trademarks, copyrights, and business processes. Intangible assets, in a nutshell, are noncurrent, nonphysical assets that are utilised in the functioning of the firm. Intangible assets should be valued based on their cost; they will only be placed on the balance sheet if they incurred substantial expenses during their acquisition or development. These assets will appear on the balance sheet at their cost.
2.2 Classification of intangible assets
The categorization of intangible assets is not widely recognised. However, the following six recommended intangible asset types are the most popular:
? General refers to goodwill and other things, such as beneficial connections with the government.
? Brand equity is the ability of a company to support and promote consumer demand as well as other market capabilities like advertising.
? Intellectual capital includes both intellectual property (patents, trade names, trademarks, and copyrights), which are protected by a complex body of legislation, as well as trade secrets, internally produced computer software, drawings, and other proprietary technologies.
? The assembled workforce (the relationship between the company and its employees, employee contracts, and employee training), leadership, the organization's capacity for commercially viable innovation, the organization's capacity for learning, leaseholds, franchises, licences, and mineral rights are all examples of structural capital.
? Customer equity includes distribution agreements and connections, customer lists and other customer-based intangibles, customer loyalty, and customer pleasure.
? Supplier relations, include contracts, ownership stakes in suppliers, and supplier dependability
CHAPTER THREE - REVIEW OF PREVIOUS RESEARCH AND RESAERCH DESIGN
3.1 Review of previous research
The majority of intangible assets that are taken into account are those whose expenses are high when spent, such R&D and advertising.
Lev and Sougiannis (1996) hypothesised that the excess returns either reflect stock market mispricing or serve as compensation for the increased risk associated with businesses that invest heavily in research and development. After doing a number of studies, Lev and Sougiannis (1999) come to the conclusion that the extra returns are more likely a result of increased risk.
However, later research (Lev, Sarath, and Sougiannis, 2000; and Penman and Zhang, 2002) shifted their attention from R&D intensity defined based on the estimated amount of R&D assets to change in R&D assets because observations suggest that R&D assets' absolute levels may not be what affect earnings persistence. These studies provide data supporting the claim that the market is, in part, obsessed on profits and underappreciates the effect of R&D accounting on earnings quality.
More convincing evidence for the risk explanation may be found in the conference article by Chambers, Jennings, and Thompson. They also demonstrate that R&D-intensive companies have substantial profits volatility, which is consistent with earlier results (see Chan, Lakonishok and Sougiannis, 2000)
The impact of technology progress on rising firm-specific and overall stock price volatility is highlighted in recent finance literature (Campbell et al. 2001, Shiller 2000, Pastor and Veronesi 2005).
The market worth of a corporation, its level of innovation, and its productivity have all been positively correlated, according to productivity literature.
Patents' citation weighted by R&D intensity (Griliches 1981; Pakes 1985; Hall 1993, Hall, Jaffe and Trajtenberg 2005).
The study is based on Mazzucato's empirical research (2002, 2003), which indicated that stock price volatility is greatest during the stages of an industry's life cycle when innovation is the most "competence-destroying," as judged at the industry level.
Although it has been often said that intangible assets play a significant role in economic prosperity, scholarly research has yet to adequately measure their influence (Griliches 1998). One issue is the difficulty in measuring intangible assets including R&D expenditures, marketing, advertising, and human capital. Academic studies often use either firm financials or market data. Due to a lack of information on other types of intangible investment, prior studies employing the former had a tendency to focus only on research efforts.
After the "New Economy" era, when many high-tech firms that were seen to be overpriced witnessed a significant decline in their share price, there has been greater focus on stock price volatility. Even while there hasn't been a trend rise in overall stock price volatility, this pervasive notion of the "knowledge economy" has contributed to even higher stock price volatility (Schwert 1989; 2002).
According to Shiller's research from 2000, there is more "excess volatility" at times of technological revolutions when uncertainty is at its peak because investors lack confidence in their own assessments as a result of the heightened uncertainty surrounding both technology and demand. He argues that since the efficient market model does not take into account the social process by which expectations are generated, it significantly understates stock price volatility (i.e. animal spirits, herd behaviour, bandwagon effects).
In finance models, uncertainty relates to how assumptions about a company's future growth impact its market value (Campbell, Lo and McKinley 19973)6.Technology developments are an example of real uncertainty, according to Knight (1921) and Keynes (1973), which cannot be assessed using probabilities like risk but are a significant factor in a firm's potential future growth.
Interesting insights on the connection between innovation, uncertainty, and stock price volatility may be found in Pastor and Veronesi's (2005) study. They contend that if uncertainty about a company's typical future profitability is taken into account in market valuation models, bubbles may be viewed as the result of reasonable, rather than irrational, behaviour towards future predicted growth. Thus, market value rises when there is uncertainty regarding average productivity, according to Pastor and Veronesi's (2004) finding. They develop the model to explain why technology revolutions increase the volatility and exhibit bubble-like patterns in the stock prices of innovative companies. The fundamental tenet is that when a company adopts a new technology, its stock price increases because investors anticipate that the technology would increase productivity. Because danger is unpredictable when technology is applied on a small scale, volatility also increases. The risk becomes systematic when the new technology spreads across the economy, which lowers volatility and causes a decline in stock price. The most unpredictable technologies exhibit this bubble-like behaviour the strongest.
According to Mazzucato and Tancioni's study from 2005, it is untrue that industries with higher levels of innovation are generally more volatile than those with lower levels of innovation. Instead, idiosyncratic risk and R&D intensity are found to be positively and significantly correlated at the firm level.My goal is to determine if, as suggested in the works above, the amount of excess volatility in stock prices is positively connected with greater intangible assets (innovations).
3.2 Research Design
According to prior studies, businesses purchase intangible assets for two reasons: to get new knowledge and to learn about and profit from the innovations of others (Mowery, 1983; and Cohen and Levinthal, 1989) Therefore, we anticipate that companies (Industry group) with more intangible assets would experience greater stock price volatility.
Our theory (in modified form):
Higher intangible asset firms (or industry groups) have more volatile stock prices.
We research the volatility of the firm's stock prices and the intangible assets recorded on the balance sheet
(BI) of the company (S). We estimate using the following regression model to look at the intensity of a firm's intangible assets and the volatility of stock prices:
St = α + βBIt + εt
Where St represents stock price volatility. It should be mentioned that we used price changes for the year 2006 to compute price volatility since we believed that price volatility would be constant throughout the course of the ten-year timeframe. On the company's balance sheet, BIt stands for the intensity of the yearly average recorded value of intangible assets.
A more specific version of the hypothesis is therefore given from the regression model as;
H1: β > 0
If the volatility of the stock prices is correlated with the firm's intangible intensity, it may be determined by the coefficient estimate β of the intangible variable BI.
CHAPTER FOUR - SAMPLE DATA AND EMPERICAL RESULTS
4.1 Sample Data
The sample businesses (industry group) included in this study's test must have at least ten (10) years' worth of consolidated balance sheet data, and they must be listed on at least one stock exchange. The analysis includes 40 companies from four different industry groups and spans the years 1996 to 2006.
The necessary financial data were obtained from two secondary sources, namely the BVDEP-Amadeus database7 for the consolidated balance sheet and the ECO Win database from various stock markets for the stock prices. Due to a lack of stock price information, data from two businesses was later removed from the study.
The following industrial categories are represented by sample companies in this study: production of basic medicines, production of food and drinks, production of information technology, and production of basic metals.
Tables 1 and 2 below provide the data set and descriptive statistics for the relevant variables. It is clear that there is significant concentration in a group of companies with larger intangible assets since the mean values of BI and stock price volatility are all higher than their medians.
www.bvdep.com/en/amadeus.html
Table 1: Data Set of Project

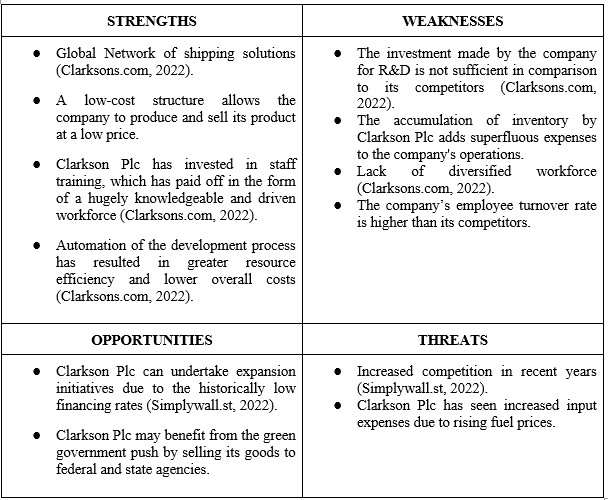
4.2 Empirical Results
Both Microsoft Excel and SPSS were used to do the regression analysis. The findings from both programmes are similar and are shown in Table 3 below.
The standardised beta (β = -0.203), which also indicates that the ratio of intangible assets to total assets, BI (-.011, p=0.221), seems to be unrelated to stock price volatility. The Intangible Intensity Coefficient is not Statistically Significant, according to the data.
The R-squared is 0.041, which indicates that the model's variables can explain 4.1% of the variation in stock price volatility (St).
.png)
The resultant negative association between intangible asset intensity and stock price volatility contradicts earlier studies on the extent of intangible assets that are not recorded. At first glance, the negative sign of the beta coefficient (β) seems to point in the opposite direction of what we would anticipate. This negative association may be caused by the following factors:
? There appears to be little or no significant impact of booked intangible asset on the volatility of the firm share prices, which are driven by uncertainty and the expectation of future growth.
? One may also contend that costs for R&D and marketing (advertising) are what will ultimately be producing intangible asset, but this argument is debatable. Not when these expenses are recognised as intangible assets, often with fairly conservative/precautionary application of accounting standards, are they classified as such to have a favourable influence on the volatility of share prices. As a result, the book value of an intangible asset is never equal to its real worth.
Following the findings from the preceding analysis, an industry-wise regression is performed on the same data, with the results shown in the tables 4, 5, 6, and 7 below.
Table 4: Statistics summary of OLS regression for Basic Pharmaceutical
.png)
From table 4 above, it seems that the ratio of intangible assets to total assets, BI (0.019, p=0.215), for the production of basic medicines, is connected to stock price volatility, which is also suggested by the standardised beta (β= 0.430). This positive association backs up earlier studies that found a positive relationship between the intensity of intangible assets and the volatility of pharmaceutical company stock prices, perhaps as a result of the high degree of R&D in this sector.
The results of the regression show that there is a negative correlation between the intensity of intangible assets and the volatility of stock prices in the other three industry groups, which include the manufacture of food and beverage products, information technology, and the manufacture of basic metals, with beta values of -0.318, -0.415, and -0.348, respectively. These negative coefficients seem to be moving in the opposite direction from what we anticipated, which might be because there is the booked intangible asset has little to no effect on how volatile the firm's share prices are.
.png)
CHAPTER FIVE - SUMMARY AND CONCLUSIONS
In this research, I provide a general introduction of intangible assets and investigate the relationship between the concentration of intangible assets as a percentage of book value at 38 different companies and the volatility of their stock prices.
In contrast to my original hypothesis and other research in this field, the analysis reveals a negative link between the intensity of a firm's intangible assets and the volatility of its stock prices. The fact that the statistics for intangible assets utilised in this research were book values, which are less than their real worth, and the fact that the results were averaged over a period of between 8 and 10 years may have contributed to the counterintuitive findings.
I look at the relationship between the intensity of the book value of intangible assets of four business groups and the volatility of their stock prices based on industry groupings. This hypothesis is backed by my discovery of a positive association between the book value of intangible assets for the pharmaceutical sector and the cyclicality of their stock prices. Due to the significant degree of R&D being conducted in this business, the influences of uncertainty and expectations on investor behaviour also contribute to this outcome.
The findings from the other three industry groups were consistent with the study's principal finding.
The research may serve as a starting point for a more thorough understanding of how the book value of intangible assets affects the volatility of stock prices.
Future research should take into account all intangible assets rather than only concentrating on R&D and marketing. Intangible assets in general should also be considered, since investor behaviour is a significant contributor to stock price volatility.
REFERENCES
.png)
.png)
Essay
Is AI Taking Over the Work of Financial Analysts?
Question
Task: Within 1200 words (about five pages), and drawing from a variety of sources, essay on the topic "Are financial analysts' jobs being replaced by artificial intelligence and machine learning"?
Answer
The current financial analysis essay discusses the function of financial analysts, including their involvement in a variety of financial planning, analysis, and decision-making processes. Financial analysts must create a variety of budgets and forecasts as part of financial planning in order to estimate the financial health of a project or business well in advance of the year's beginning and compare actual performance to the predicted numbers to analyse overall financial performance.
In the present period, a modernised business world is expanding quickly due to technological improvement. The employment of artificial intelligence in many business operations has developed into a cornerstone for achieving organisational performance, according to the research of essay writing services on financial analysis essays. Machine learning and AI have assumed a central role in corporate organisations around the world due to the increasing relevance of accurate and timely data (Jordan & Mitchell, 2015). Artificial intelligence has presented enticing possibilities to handle activities with greater accuracy and in real-time in the financial sector (O'Leary, 2013). It is true that financial analysts' jobs have been largely replaced by machines thanks to artificial intelligence (AI), which allows robots to perform tasks that would otherwise need physical labour. The primary duty of a financial analyst, as described in this essay on financial analysis, is to evaluate the suitability of any project or company based on its financial performance. The analysis calls for extensive professional skills (Adhikari & Agrawal, 2014). Other industries are integrating their business operations with AI, not just the financial industry, particularly when it comes to analysing the financial success of the organisation overall or a specific project.
Artificial intelligence enables the speedy completion of all calculations, analyses, and other associated tasks that previously required human experts in more conventional situations (via automated processes) (Krollner, Vanstone & Finnie, 2010). Due to manual interaction, the reports produced in the conventional analysis process had a larger likelihood of error; however, with the use of tools incorporating artificial intelligence, the likelihood of error has almost been eliminated. As a result, the reports generated by AI tools are thought to be more accurate. According to research on financial analysis essay, during the past few years, virtually every industry, including manufacturing and marketing, has witnessed a tremendous increase in the use of robots, digital assistants, and other smart equipment (Dirican, 2015). The role of financial analysts has been impacted by AI's ability to make it fairly convenient to simulate human thought processes and behaviour by utilising a variety of learning algorithms (Kou, Peng & Wang, 2014).
Financial analysts could enter a new world where their routine work will be taken over by machines, and they will need to conceive of analytics strategies in novel ways due to the availability of affordable hardware and high-level software as well as numerous revolutionary AI technologies like the Internet of Things, Big Data, Cloud, etc. (Sohangir, Wang, Pomeranets & Khoshgoftaar, 2018).
Although it is true that artificial intelligence has replaced the work that financial analysts once did, this does not mean that their position in an organisation has been eliminated as a result of AI. Instead, AI has aided financial analyst roles by giving them correct data in real-time so they can perform the in-depth analysis component (Baldwin, Brown & Trinkle, 2006).
One of the primary applications of machine learning algorithms in the financial analysis process outlined in the financial analysis essay is their capacity to evaluate huge amounts of transactional data and to identify questionable transactions, or transactions with high-risk scores, in real-time (Arnold, 2018). When artificial intelligence was not yet a concept, financial analysts still performed these tasks manually using tools like advanced Excel and other analytics tools, but because of manual intervention, the data results could not be as accurate as needed to make informed decisions, and these tasks also required more time to complete (Daniels & Caron, 2009). Human experts' incapacity to analyse the data and create the report in real-time frequently prevented their reports from serving their primary function. The inaccuracy of the input and the delay in its creation for analysis can result in a hazy analysis that causes firms to make bad decisions (Cath, Wachter, Mittelstadt, Taddeo & Florida, 2018).
Without a doubt, technology is essential for automating the everyday activities of financial analysts and for identifying data trends in enormous datasets, ensuring that financial analysts retain their importance in businesses (Soufian, Forbes & Hudson, 2014). The real truth, as mentioned in this article on financial analysis, is that the function of the financial analyst is expanding and that they will be given more responsibility—responsibilities that robots cannot carry out using logic and algorithms. Instead of wasting time collecting data from various sources for financial research, time will now be spent on high-end tasks, including in-depth data analysis, exercising rational judgement based on data supplied by AI tools, and evaluating quantitative algorithms (Bertone? che & Knight, 2001). The ability of humans to make decisions still outweighs that of AI. Additionally, it is acknowledged in this example of a financial analysis essay that quantitative models are generally more advanced than human experts, but it is undeniable that they are better able to identify arbitrary data, such as future trends based on microeconomic and macroeconomic conditions, which are not taken into account when using artificial intelligence tools for financial analysis. Additionally, when results are ambiguous and highly subjective to a higher degree of unpredictability, AI, machine learning, and big data demonstrate less effectiveness (Richins, Stapleton, Stratopoulos & Wong, 2017).
Future financial analysts' ability to perform their jobs effectively will be largely dependent on their ability to continuously learn new patterns, analyse data, and offer distinctive financial services. The future of artificial intelligence and machine learning in business organisations will be shaped by insights regarding the accuracy, timeliness, predictions, and other elements. The aforementioned explanation of the financial analysis essay can be used to draw the conclusion that, despite the fact that artificial intelligence has simply automated regular duties for financial analysts, this has not led to the eradication of their areas of responsibility. Instead, there has been a certain expansion in the job of the financial analyst. With the help of AI, simple tasks may now be automated, freeing up financial analysts to focus on higher-level tasks like data analysis and critical activity judgement (Benninga, 2014). In order to instal and operate the technologies in the business processes, human intelligence will always be needed. It would be more accurate to draw the conclusion from the readings discussed above for the financial analysis essay that pairing financial analysts with machines will enable both of them to flourish in different areas, which will lead to digital transformation in the field of financial analysis (Benninga, 2014).
References:
.png)
Research
MAN605 Financial Analysis and Decision Making Assignment Sample
Weighting: 25%
Word Limit: 1,200 words
Due date: Week 10 Sunday 11:59 pm
Please select one (1) out of the following three (3) organisations to base your report on.
? Delaware North Companies Australia Pty Ltd
? Retail Zoo Holdings Pty Ltd
? Oaks Hotels & Resorts Limited
Your manager has been asked to prepare a report for the Board of Directors on the financial health of the business and needs your help.
Use IBISWorld to locate the company report and conduct research online to understand the company’s:
? Company information – background, vision
? Strategy and direction
? Financial performance based on their ratios
? Performance compared to industry average and competitor performance
You may not have all the information to complete a full analysis so you will need to include in your report any additional information you need and why – your manager is expecting this.
Your manager hopes that your analysis will show that the business is healthy and therefore that she is performing well in her role.
Required
Prepare a report for your manager, in a short report format, that assesses the financial health of the organisation. Your report must include the following:
? your assessment of the financial health of the organisation for at least the past 3 years.
This would include an explanation of the ratios or other data you are using to support your analysis.
? any additional information that you need to complete your analysis.
? an explanation of at least 3 (but not limited to) recommendations that your manager can take to the Board of Directors that are related to the strategic focus of the business.
You may refer to the lecture and tutorial notes and activities to help you organise your analysis.
Getting started: You can also use the following questions to guide your analysis for assignment help -
Profitability
How has the business performed?
Is the business generating a satisfactory return?
Efficiency
Are debts being collected? How long does it take?
Is the inventory turning over efficiently? Are inventory holdings increasing or decreasing?
What are the implications for cash flow?
Are the assets working hard?
Liquidity
Can the business pay its bills?
Are they collecting their debtors efficiently?
Do they have a lot of creditors?
What are the inventory holdings?
Solvency
Can the business repay its long term loans?
Can the business pay its interest?
What is the balance of equity to debt?
Other suggested areas to research include: current interest rates, supply and demand, market trends. You can even complete a short PESTLE analysis however it is not required for this assessment.
Solution
1: Introduction
This report shall discuss the essential aspects relevant for the financial analysis and decision-making skills on a long-term prospect. In order to evaluate the financial analysis and decision making, the company selected is Delaware North Companies Pty Ltd. (DNCPL), while a detailed discussion on company background, vision and information shall also be discussed. Analysis and calculation of financial ratios shall also be conducted in this report to outline the stability of the company’s performance as compared to industry benchmarks and competitors’ performance.
2: Company Background, Vision and Information
DNCPL is considered to be a strong industry player who is engaged in the retail and hospitality sector over a span of three decades. The background is further energised by strong financial performances, where the company was able to generate revenues worth $281,986,000 (my-ibisworld-com, 2022). The vision and information statement of the company further suggests a steep inclination to keep progressing and growing in the field of hospitality services.
3: Strategy and Direction
The major strategies and direction of the company are considered to be mostly based with meeting financial and nonfinancial objectives. Hence, a cohesive direction is being employed by the concerned loggerhead of the company to ensure through meeting of goals and objectives prescribed by the company. As per explanations and illustrations of Xu, Sheng & Tian (2020), a unified direction is needed to be emphasised where teamwork and proper management should be initiated for ensuring financial and nonfinancial growth of an organisation.
4: Financial Performance
4.1: Calculation of Ratios
The calculation of ratios for DNCPL shall be substantiated by considering the relevant figures during 2020, 2019 and 2018 respectively.
4.1.1: “Profitability Ratios”
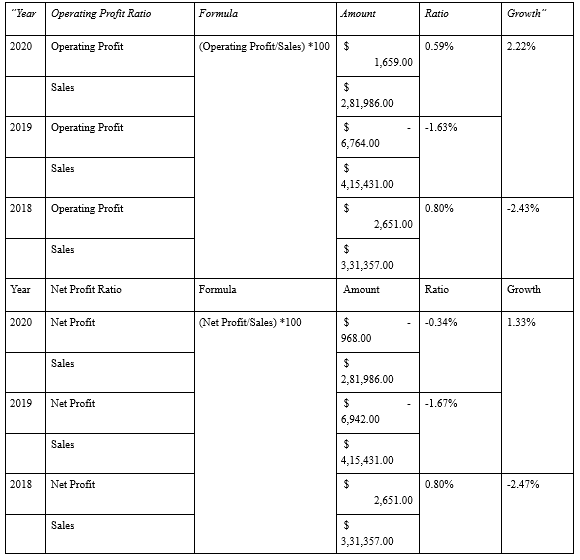

Table 1: Profitability Ratios
4.1.2: “Liquidity Ratios”
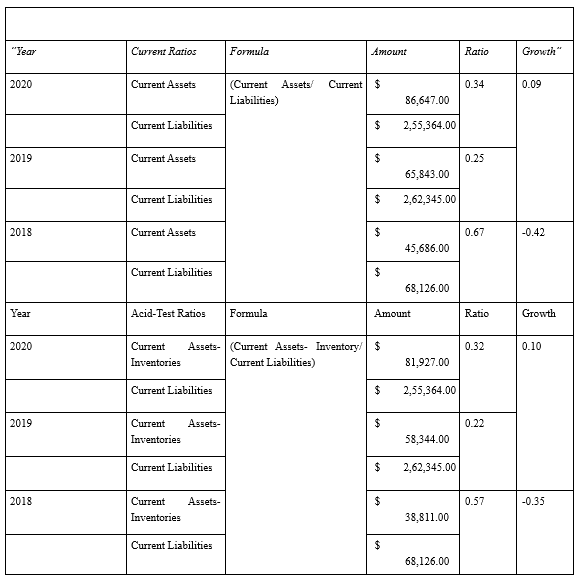
Table 2: Liquidity Ratios
The above table of liquidity ratios further suggests marginal improvement in current and quick ratios in 2020 as compared to 2019. The overall growth in 2020 as compared to 2019 is considered to be 0.09.
4.1.3: “Solvency Ratios”
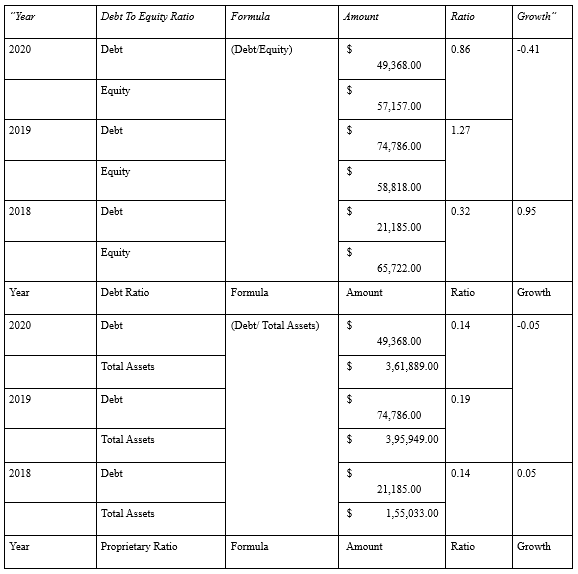
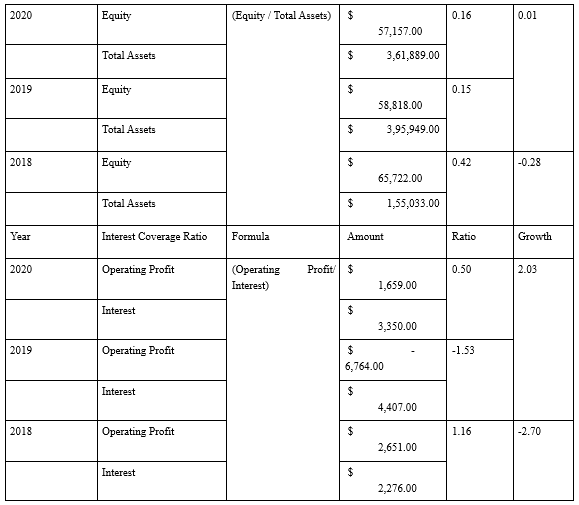
Table 3: Solvency Ratios
The above table of solvency ratios further reads to better performance in 2020 as compared to 2019 and 2018.
4.1.4: Efficiency Ratios
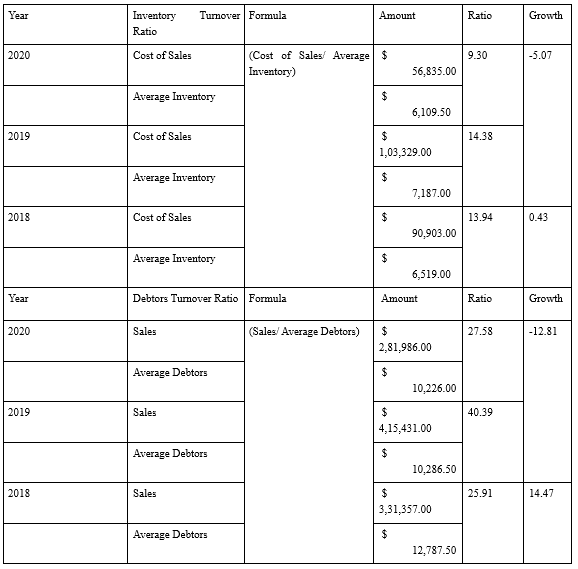
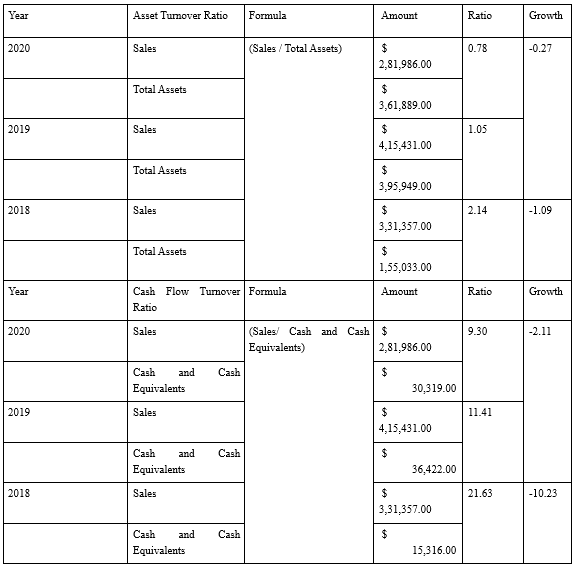
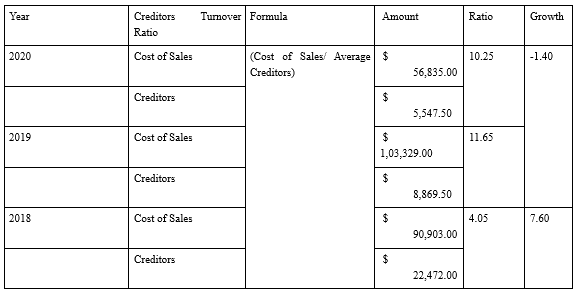
Table 4: Efficiency Ratios
As per the above table of efficiency ratios, it can be ascertained that the ratio metrics has decreased substantially in 2020 as compared to 2019 and 2018.
5: Analysis of Performance
Profitability Analysis
The profitability ratios suggest that a marginal increase in performance is being witnessed in 2020 as compared to 2019. The business performance in 2020 is considered to be adversely positioned owing to net loss of $ -968.00.
Yes, the business has generated a sufficient return for the years. Based on the estimation, it has shows a growth in 2020 return value. Hence, it can be determined that the company is failing to generate a satisfactory return [Refer Table 1].
Efficiency Analysis
The debtors and inventory turnover ratios are valued as 27.58 and 9.30, thereby depicting decent readings for debt collection and low reading for inventory holding. Thus, debt collection is facilitated after a span of nearly 13 days, while inventory is being held for approximately 40-41 days.
The inventory turnover value is mainly suggested as 9.30 times for the firm. Inventory is turning over efficiently as it is matched the aggregate value. Furthermore, it has found turnover value was increased from 2018 to 2019. It has dropped 2020 that has indicated as 9.30 as per the value.
Therefore, it can be ascertained that inventory holding is decreasing in 2020, while cash flow implications suggest adverse readings of 9.30 times in 2020 as compared to 11.41 times in 2019.
It can be considered that assets are not working as per their achievable capacity. The asset turnover ratio is mainly suggested a value of 0.78 that has evaluated a lower utilisation of asset. It is required to increase the asset value based on the liability provided. [Refer Table 4].
Liquidity Analysis
The liquidity analysis suggests that the company does not possess relevant financial credentials to pay bills, while debts are being collected in an inefficient manner. The identification of 0.34 is lower than ideal value that suggested a lower ability to pay its bills.
The identification of debtors, it has found that DNCPL is collecting its debt random that has increased the liability value. It has effected on total value of liquidity.
However, the creditor valuation is considerably lower in 2020 along with inventory holding valuations. Limited holding og creditor has been indentified in this case.
As per illustrations and explanations of Plesca (2018), the stipulated industry benchmark of current and quick ratios is considered to be 2:1 and 1:1 respectively [Refer Table 2].
Solvency Analysis
As per the solvency ratios, it can be ascertained that DNCPL has the ability to repay its long-term loans owing to lower proportion of debt as compared to equity, which determines a balance of 0.86:1 as the ratio.
The interest coverage ratio, however is deemed to be negatively positioned owing to lesser operating profit and higher interest expenses in 2020
The calculations indicates that the balance of equity to debt 0.86 in 2020. Previous year, the balance has indicated as 1.27 in 2019 that was lower in 2018 (i.e. 0.32).
[Refer Table 3].
6: Conclusion and Recommendations
6.1: Conclusion
This report has discussed the important aspects of the financial reporting and decision making with respect to the selected company DNCPL, where the ratio metrics are considered to be adversely positioned in comparison to industry benchmarks and its competitor. The vision and mission strategy of the company is considered to ensure harmonious progression of business across Australia and overseas countries including New Zealand.
6.2: Recommendation
In order to excel with regards to financial credibility and stability following recommendations are being proposed.
• It is recommended to ensure optimisation of financial and non-financial resources.
• It is recommended to identify additional sources of revenue generation.
• It is recommended to enable a streamlined organisational structure for ensuring higher profitability prospects.
References
My-ibisworld-com, 2022, Revenues [online], Retrieved from: https://my-ibisworld-com.ezproxy.angliss.edu.au/au/en/company-reports/5376/company-details [Retrieved on: 07th October, 2022]
Plesca, A., 2018. Temperature distribution of HBC fuses with asymmetric electric current ratios through fuselinks. Energies, 11(8), p.1990. https://doi.org/10.3390/en11081990
Xu, S., Sheng, C., & Tian, C. (2020). Changing soil carbon: influencing factors, sequestration strategy and research direction. Carbon balance and management, 15(1), 1-9. https://doi.org/10.1186/s13021-020-0137-5
Research
BEAFGE Business Economics and Finance in a Global Environment Assignment Sample
A. Project question
You have received an email from the Chief Executive Officer of Clark Casc Logistics plc, where you are employed as manager of the refrigerated goods division, inviting you to the first in a series of budget-setting meetings and asking you to submit a brief report in advance for assignment help.
You are only permitted to submit your report once. Trial runs are not permitted and no spare, draft or test drop boxes will be provided. It is your responsibility to submit your own work and to ensure that your report is finalised, complete and properly edited before, not after, you submit it.
This is an individual assignment. The sharing of files or copying of work between students is not permitted.
You are only allowed to submit one document, which must contain your full report, including your reference list. Do not attempt to submit additional documents.
Your submission must be either a Word document in .doc or .docx format or a .pdf document.
Appendices are not permitted.
Dear “Laser”,
For the last financial year Clark Casc Logistics plc made a profit of £32 million – with profits of £18 million in the first six months of this year and the Board believes that there is scope for continuing expansion. We are therefore reaching out to all managers to provide realistic budgets for the income and costs for which they are responsible, so that we can plan ahead with confidence.
We will be holding a first round of budget-setting meetings on Thursday next week. As the manager of the refrigerated goods division, the income and expenditure for which you were responsible for the last financial year were as follows.
Your expenditure for the first six months of the present financial year is as follows, with a comparison with the budget which, I would remind you, you agreed to this time last year.
Year Ended April 30th 2022
Six Months to October 31st 2021
Refrigerated Goods
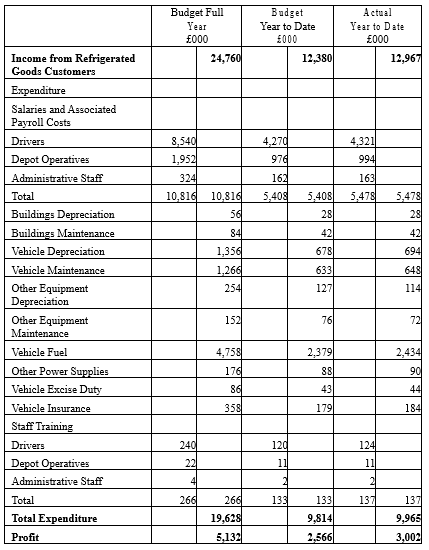
Next Year: Year Ending April 30th 2023
The purpose of next week’s meeting is not to congratulate ourselves on past profits but to plan for the future.
We already have a budget for the rest of this year and monitoring progress against this is an entirely separate exercise and not the purpose of this report, so do not include any budget monitoring information, as we already have that.
We need a realistic budget for income and expenditure, to tell us how much sales income we intend to make and how much we are going to have to spend to earn it. This year is already underway and what we need is a budget for next year. We need this budget to be agreed well in advance, so that we can make the necessary commitments and contractual arrangements for all our planned expenditure.
Please provide a report in advance of the meeting detailing your budget for the year ending April 30th 2023.
The format of the proposed budget is up to you, as is the method by which you arrive at the budget. However, please include the following sections in your report. We do not require an executive summary:
1. Introduction
2. Approach to evaluation of the proposed investment in a new depot
3. Evaluation of the proposed investment in the new depot
4. Approach to drawing up the refrigerated goods department budget
5. Relevant calculations to show that your budget for the year ending April 30th 2023 is realistic
6. Your proposed budget for the year ending April 30th 2023 with complete income and expenditure figures
7. A conclusion on the levels of income and expenditure in your department and on the likely result of building the new depot
8. Recommendations on the new depot proposal, including a recommendation on whether or not to proceed with it, and on the next steps in managing resources in the refrigerated goods department
Please make sure you provide a list of references to any published external material you refer to in your report.
Make sure your report is at least 2,250 words to prove you’ve done some work but I’m not reading it if it’s more than 2,750 words apart from the references. I will not waste time reading appendices. If you have something to say, say it in your report.
Our growing sales income has already enabled the Board to give employment to the Chief Executive’s son and I was frankly astonished to find that he has been assigned to the Finance department. As I am struggling to find any real use for his talents, I will be reading your report carefully for signs that you “need help” with financial matters, in which case I will have no hesitation in sending young Tony to “help” you on a daily basis.
Best Wishes,
Iain
“Until a man dies, wait and until then never call him happy but only fortunate.”
Herodotus
This email contains confidential information relating to Clark Casc Logistics plc. If you are not the intended recipient delete this email immediately.
Further information
As manager of the refrigerated goods division you are responsible for sales income from the transport of refrigerated goods.
Note that the figures above are for six months. You are required to provide a budget for a full year and not for six months only.
You are responsible for pricing and negotiating each contract. You have complete discretion over pricing and all refrigerated goods contracts must be signed by you or somebody authorised by you. You usually start by offering a price based on £0.22 per tonne per kilometre. However, if a prospective client has asked for sealed bids in a competitive bidding process you submit a bid priced at £0.19 per tonne per kilometre, which is approximately the average price you are able to negotiate with customers.
The sales income generated by your department over the past six months has been as
As manager of the refrigerated goods division, you are responsible for the following costs:
Salaries and Associated Payroll Costs
In addition to the salaries below, Clark Casc is required to pay Employer’s National Insurance Contributions. Employer’s National Insurance Contributions are presently assessed as 13.8% of each employee’s salary, including bonuses but excluding the first £8,840 of the employee’s annual salary.
Clark Casc is also required to pay an additional 0.5% of total salaries, including bonuses, as an apprenticeship levy.
Clark Casc also contributes to an employees’ superannuation scheme. Clark Casc’s contribution is 8.5% of all staff salaries, including bonuses.
All of these costs are part of your budget.
Heavy Goods Vehicle Drivers:
You have 202 drivers earning an average base salary of £35,000 per year. Each driver can presently cover about 125,000 miles per year. Last year, all drivers also qualified for a bonus of 10% of base salary for accident-free driving and there have been no vehicle accidents this year.
Employer’s insurance is handled centrally and is not part of your department’s budget.
Refrigerated Goods Depot Operatives
You have 97 operatives working at you refrigerated goods depot, earning an average salary of £19,000 per year.
Administrative Staff
You have 11 administrative staff in the refrigerated goods department, earning an average salary of £27,000 per year.
Property Plant and Equipment
Vehicles
Your department uses 151 heavy goods vehicles and 16 other vehicles, all of which are owned by Clark Casc. Each vehicle has an estimated useful life of 12 years in the company after which it can be resold for an estimated 10% of its original cost. The average replacement cost of a heavy goods vehicle is presently £120,000 and the average replacement cost of other vehicles is £24,000 per vehicle. You are responsible for the cost of depreciation on these vehicles. Depreciation is to be charged at current replacement cost.
Vehicle Excise Duty
Vehicle Excise Duty varies from vehicle to vehicle but is an average of £560 per vehicle per year for heavy goods vehicles and an average of £220 per vehicle per year for other vehicles.
Vehicle Insurance
Your vehicle insurance costs average £2,400 per vehicle per year for heavy goods vehicles and £400 per vehicle per year for other vehicles.
Other Equipment
You have just completed a major exercise with the finance department to establish what equipment you are using at the refrigerated goods depot and in the office. The annual depreciation cost at current replacement cost for this equipment is £228,000.
Equipment insurance other than vehicle insurance is handled by another department and is not part of your budget responsibilities.
Buildings Depreciation
The depot and office which you occupy have a current replacement cost of £3,500,000 and a useful life of 50 years. The land which they occupy has a current resale value of £600,000 and the scrap value of the building materials is estimated at £100,000 at current prices. You are required to budget for depreciation on the buildings on a straight-line basis.
Buildings Maintenance
Buildings maintenance, including cleaning, is carried out by the in-house Buildings Maintenance Department and recharged to your department. It is a fixed cost and averages £7,000 per month.
Equipment Maintenance
Vehicle Maintenance
Clark Casc’s vehicle maintenance department is under separate management. You are responsible for booking the vehicles in your department in for repairs, routine maintenance and annual testing. You are also responsible for ordering the recovery of any vehicles which have broken down or been involved in accidents. All of these
services are managed by the vehicle maintenance department. There have been no motor vehicle accidents in your department in the last 18 months.
Vehicle maintenance is a semi-variable cost.
The vehicle maintenance costs charged to your department over the last six months have been as follows:
The sales income generated by your department over the past six months has been as follows:
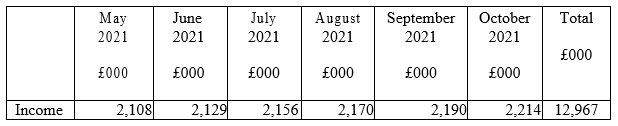
Other Equipment Maintenance
Depot and office equipment maintenance is a fixed cost and averages £12,000 per month.
Fuel and Power Costs
Vehicle Fuel
Vehicle fuel is a semi-variable cost.
Total vehicle fuel costs for the last six months have been as follows:
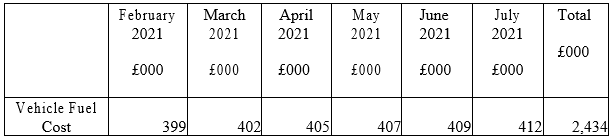
Other Power Supplies
Gas and electricity supplies to the depot and office are a fixed cost and average £15,000 per month.
Staff Training
The cost of drivers’ training averages £1,225 per driver per year, including fees for Certificates of Professional Competence.
Depot operatives’ training costs average £225 per operative per year. Administrative staff training costs average £275 per person per year.
Other Costs
There are no other costs in your budget. All other costs, including legal costs, employer’s insurance, public liability insurance and insurance of buildings and non-vehicle equipment, are handled by other departments and you are not responsible for managing them.
Step Fixed Costs
You presently have enough drivers and vehicles to meet demand up to 140 million tonne kilometres per year (£26,600,000 sales income per year at £0.19 per tonne kilometre). To fulfil orders above this level you will need 2 extra drivers and 1 extra heavy goods vehicle for every 1.4 million extra tonne kilometres per year (£266,000 sales income per year at £0.19 per tonne kilometre).
Proposed New Depot
If sales exceed 150 million tonne kilometres per year (£28,500,000 sales income per year at £0.19 per tonne kilometre), your department will need a new depot of the same size and with the same number of depot operatives as the existing depot and you will also need 3 additional administrative staff with salaries of £27,000 per year each. It will take 12 months to build a new depot and bring it into use and Clark Casc will have to pay the builders before it is complete.
You are responsible for deciding whether to make this extra investment in a new depot or not. You are not responsible for deciding on how to finance it. However, you have been told that further investments are required to make a return of at least 9% per annum and that this is to be used as the discount rate in any discounted cash flow calculations.
Additional Information
You are the manager of the refrigerated goods department and you have full access to any additional information required. If more information is required from a published, broadcast or webcast source, you must present that information with a proper reference in the normal referencing format required in the business school. If further information would be required from internal sources at Clark Casc, you must create that information yourself for use in drawing up your report and provide your own indication of internal sources.
You must not present a report which concludes that information is incomplete, or that further information is required or which recommends that further information is obtained. This would be a clear indication that you have not completed your report as required.
Required:
Write your report, addressed to the Managing Director of Clark Casc and containing the following sections, as directed in the Managing Director’s email. Submit your report in the Turnitin dropbox.
1. Introduction
2. Budgeting Approach
3. Relevant Calculations, including any investment appraisal
4. Proposed Income and Expenditure Budget
5. Conclusion
6. Recommendations
7. References
Your report must be between 2,250 and 2,750 words in length excluding references.
Do not include an executive summary.
Appendices are not permitted.
Solution
Introduction
The term forecasting is associated with the aspect of predicting the future expected outcome by analysing the present situation. As we are all know, that being human, it is difficult to watch the future, but on can make an predication about the possibility. The corporate leaders or business leaders, use their skill and the methods, along with the past data for projection of future projected outcome. Forecasting is the systematic approach of examining the future. Forecasting sales in this context refers to the act of producing a prediction about future sales, followed by a careful investigation of data linked to future events and factors that may effect the entire firm. This budget report is drafted based on the past experience, the prevailing situation of business and the expectation of top management. (Ogun Bayo, B. F., Alibaba, C. O., Thala, W. D., & Akinradewo, O. I. (2022).
As a head of the refrigerator department, I believer, that every corporate operates under the Isolated business environment and they are open to influence by the factors associated in the business environment. the smart business tried to take an advantage through continues scanning, reviewing and analysing the operation and non-operation activities surrounding the business. All these activities are essential for continues growth and development of business. Further scanning, analysing, reviewing, planning, controlling and formulating the action plans are some key elements which are widely associated with business. After associating myself with Clark Cask Logistics plc, and after reviewing the work culture in the corporation. I feel that the planning and budgeting is the primary requirement for continues growth of business. Any decision with logical reason, required detail research, as well as this decision required continues observation of business environment. this budget report is drafted based on the experience gain in last year, as well as observing the overall strength of my department and considering that this budget report shall be realistic one. We have seen numbers of opportunities in the competitive business environment, but we sometime wait to check the actual reaction of change in the market.
Approach To Evaluate The Proposal To Invest in New Department
The growth and expansion of any business is the outcome of hardworking, delegation and continues commitment from the all the people associated with the company and the various department. projection about the future inflows and flows are made based on the overall demand for customer as the company market share in the competitive environment. further business is also required to update and up-grade them self, with the change in the business environment and level of competition. The expansion strategy of business can be carried out either by acquiring control over the competitor or by reinvesting the in exiting business by adding funds in exiting operation. Either of the selected option will result into growth of business and which will enhance the capacity of company to serve more and more customers. However, this decision of expansion of operation or the decision to enhance the operating capacity, again suffers from the numbers of drawback, hence it is essential to make proper research, before adding new capital either in exiting operating capacity or to expand the business operation. Here in current case, our management are on the option that we are in position to grow our business, considering these facts we have plan out to adopt some strategic action plan, at each division. It is totally true that we are in position to growth. But as the responsible person of the refrigerator goods department. I personally feel that before finally taking an decision for further, expansion or investment of funds in to the existing operation, we need to wait for another one year. (Nikodijevi?, M. (2021). the proposal of new investment is totally correct, but before finally deciding, or taking a finical conclusive decision. We are supposing consider the growth rate in sales of industry as whole as well as the growth of sales of our department from one year or another year. based on the growth in sales of during first 6 months, it can be projected that the refrigerator department will continues to grow at the stable rate, however as the industry is growing and our top executive also feel that we have a opportunities to expand, then in such a situation we can project that refrigerator department can grow at the rate of 10 % in total sales, this growth rate Is seem realistic, and if we consider this growth rate, then the budged sales will be nearly to £27000000, this situation does not permit use to make an further investment in new plan, rather we can go with the option of adding some more resources, which can help our operation to work smoothly and deliver the product and services with high quality standard. Here we can adopt the approach of being aggressive but with suitable Calculation. Here we will adopt the approach of adding new resources and expanding the operation in next one or two years. Further even if we take a decision for further investment in this department, it will start operating after a year.
This decision shall not be limited with the final conclusion to avoid investment in department in order to expand the operation strategy. As we are in middle of year, we are can wait for next 6 month in order to oversee the actual performance of industry as whole, the competitor position and the reaction of our customers. The new investment decision will result into the high outflow of cash. this decision required to consider the opportunity cost with this investment planning. Hence it is best suitable for wait for some time let say 6 months, and then after again the meeting shall be called to take a decision to start new operation division.
Evaluation of Proposed Investment in New Department
Starting the new department is always indicate that business is growing and creating new opportunities, but it is not means that we shall make an investment to start a new division, without being considering the negative phase of propose investment option. If the top management feel that it will be best suitable to make an investment in new division, then we need to consider the fact about the possible operating outflow, and expected inflow. Here we need to compare the proposal with the inflow and outflow. Cost benefit analysis is always advisable to consider. Here, the major investment is the capital investment, and I believer that out company is in sound position to make such investment. This addition division strategy will be suitable when it gives the high in sales by more than 25 % as again the current level of sales. In addition to that if the new department is in position to grow the net earnings by more than 12 % than again this investment option is best suitable, as here we believe that the nominal rate of return is nearly 7 %, which again indicate the risk-free return. Hence it is essential to consider that the new investment plan in department will contribute in net profitability of not less than 9 %. The second condition which as the superior authority at the department, I also think that the new department must be in position to give some additional benefits to the society at large as well as to the current and prospective customers. The further investment in new department also required supportive level of sales, which are nor less then £28,500,000, if we are fail to get this level of sales, than it become hard for our department to justify that our suggestion was correct, and we are in position to use the invested resources in productive ways. the new investment in department required, new deport with the same size, nearly 97 new of operators, whose average salaries are nearly to the existing staff, £19,000 per year. additional 3 administrative staff, whose expected salary are not less than £27,000 per year for each employee. Further this proposal will take nearly 1 year to build the new deport in order to bring into the usage and it is essential that our company shall allocate the space and allocate the work to the builder before it is complete. This outflow will not end here with as we are planning to enhance the operating capacity the additional investment in vehicles, driver, training to new staff, etc are some associated with the outflow and they will surly incurred. The new division will result into continues outflow for the fixed as well as operating expense, the expected sales level may not be in position to justify these expenses, however if we believe that out division will grow at the average rate, that is nearly 10%, then we are position to justify the expected outflow with the sales and profitability along with the return on investment.
Relevant Calculation To Associated with Budget
Instead of investing in new division, at this level we are can consider this option as the next level, and present we shall make certain amount of investment activities to enhance out ability to serve the customer. Our team believe that during the year ended 2023; we are in position to achieve the sales at the growth rate of 10% by taking the based budgeted sales of 2022. This sales required one additional vehicle, two additional driver. (Nikodijevi?, M. (2021).
This additional injection of new workforce will result in to additional outflow in driver salary. Additional outflow to Purchase new vehicle and additional cost of new vehicle for maintenance, fuel, vehicle excise duty, training expenses for the driver.
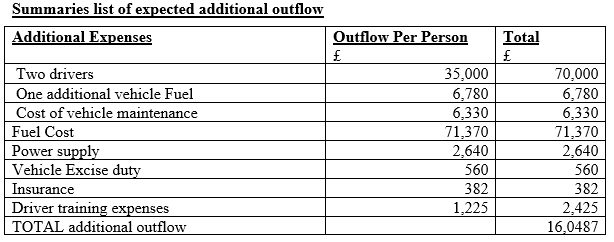
The above stated table shows the additional outflow one account of reaching our sales in excess of expected level. Here this expenses or additional investment can be justified by the level of sales we can achieve, the growth in the sales by nearly 10 % is suitable considering the fact about the overall growth of industry as well as again the inflection found in the market. Additional of two driver and one vehicle will enhance the strength of department and we are in position to boot our sales and improve the overall services in order to maintain the customer based as well as to maintain the strength of our department.
Computation of budgeted statement showing income and expenditure for the year ended on April 30th 2033
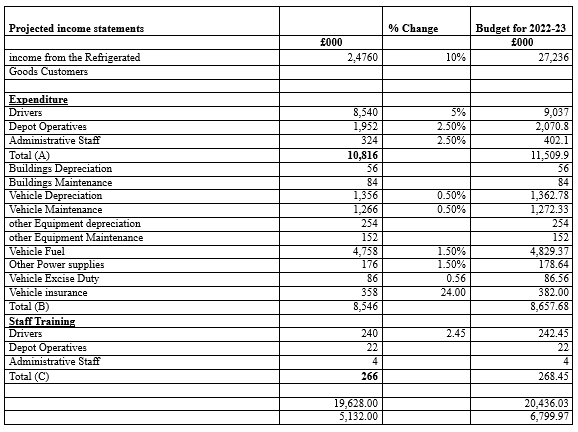
Conclusion on income and expenditure over the refrigerator goods department
The above stated calculation shows the budgeted inflow and outflow based on the income year of 2021-22. Here major focus is given toward the overall growth in expenses and the income, further a change for the year ended 2023 as again 2022, is reflected in form of percentage (Hartanto, 2018). This can make the statement user-friendly for every interested stakeholder of this department. the drafted budget report shows the growth in sales by 10 %, along with minor to major change in the operating expenses, however we have assumed that there isn’t any addition of new building, hence the cost associated with building maintenance and depreciation will be same as it was in the previous year. major change is found in the area which are variable in nature and such expenses will continues to be change due to change in overall price, tax rate, and others expenses which are not in the control. Further the above budgeted report also excludes the employee insurance contribution, bounds to the employees and other benefits which employees are eligible to receive, these benefits and the outflow for the company are in addition to above stated projection, the average percentage of this additional expense will be 5 % of sales. The above stated budget shows the comparative data of two year, here we can see the change in all major expenses, except those which are fixed in nature, such as the non-cash expenses.
Recommendation for New Deport Proposal.
After going through the above stated discussion, and after analysing the possible benefits and the drawback of adopting and investment option of new department., we are on conclusion that instead of investment this major amount to expand operation, we need to wait for next 6 month or till the end of current financial year, at the year end we are in position to know the growth of industry and overall demand of our product and services. If there is a unexpected growth in sales for next 6 months then we should plan to make additional investment, and if we are not in position to observe the expected level of growth in sales and revenue than we shall drop an plan for new deport proposal.
References
Ogun Bayo, B. F., Alibaba, C. O., Thala, W. D., & Akinradewo, O. I. (2022). Assessing maintenance budget elements for building maintenance management in Nigerian built environment: a Delphi study. Built Environment Project and Asset Management. https://doi.org/10.1108/BEPAM-06-2021-0080
Nasri, H., Nurman, N., Azwirman, A., Zainal, Z., & Riauan, I. (2022). Implementation of collaboration planning and budget performance information for special allocation fund in budget planning in the regional development planning agency of Rokan Hilir regency. International Journal of Health Sciences (IJHS) Ecuador, 6(S4), 639-651. https://doi.org/10.53730/ijhs.v6nS4.5597
Nikodijevi?, M. (2021). Implications and challenges of using driver-based budgeting in contemporary business environment. Trendovi u poslovanju, 1(17), 49-57. https://scindeks-clanci.ceon.rs/data/pdf/2334-816X/2021/2334-816X2101049N.pdf
Hartanto M. R. (2018). Implementation of Performance-Based Budgeting: A Phenomenological Study on National Land Agency. International Journal of Scientific Research and Management. Vol. 6 No. 02 (2018). https://ijsrm.in/index.php/ijsrm/article/view/1277
Moses, M. (2022). Inside the Crisis of Municipal Budgeting. In The Municipal Financial Crisis (pp. 27-52). Palgrave Macmillan, Cham. https://doi.org/10.1007/978-3-030-87836-8_1
Research
MCR006 Financial Management Assignment Sample
Assignment Brief
Due date - Friday Week 10 11.59 pm
Weight - 15%
Marks for assignment - 50
The Research Report should contain no more than 2,000 words, excluding references.
Submission via Turn-it-in on Moodle and strict adherence to submission and uploading rules to be followed. All parts should be answered.
All references and examples must be within an Australian context.
Scope of the research can include Academic articles and journals, and relevant Books. Students are encouraged to use the e-library resources.
Assignment Topics
Complete all questions for assignment help
Part A 400 words each 10 marks each
a. Explain how the general dividend valuation model values a share.
b. Explain, compare and contrast the various capital budgeting methods such as the Net
Present Value Method, the Payback Period, the Accounting Rate of Return and the Internal Rate of Return.
c. Discuss the two Modigliani and Miller propositions and the key assumptions underlying them and their relevance to capital structure decisions.
Part B 800 words 20 marks
Your Board of Directors is considering acquiring a business in the same industry. The Board has not undertaken such a venture before. The CEO has come to you to ask you to prepare a Board report
which clearly explains the 3 main methods of valuing a business. Include in your report the specific valuation methods the board should consider when making their decision on the company they should acquire. Assume this is a listed company and the company Being acquired is a listed company.
In the report identify and explain some other areas than valuation methods that should be considered by the directors when undertaking the acquisition of another organisation.
Solution
Abstract
This report provides the acquisition analyses of the two business corporate belong to Australia in the industry of gold mines. Saracen Mineral Holdings has acquired Kalgoorlie Consolidated Gold Mine. It also includes the various financial appraisal technique and model. Saracen Mineral Holdings company engaged in the mineral development and exploration while KCGM has also been engaged in the same business filed.
Part A
a. Dividend Valuation Model
The dividend is referred to as a part of a business's profit that is distributed by an entity to its shareholders (Sahoo 2020). Whenever a business entity earns profits, it has the option to either reinvest the earned profits in its business or payout such profits to its shareholders in the form of a dividend. Different patterns or models may be followed by the business entities for the payment of dividends. These dividend valuation methods help in determining the value of an entity's share. These patterns may include the following:
? Zero Growth Model
When the payment of dividends by any business entity is expected to remain the same in the future, then it may be said that the business entity applies a zero growth dividend model. The following formula may be used to determine the value of share when the entity is using a zero growth model for the dividend payment:
Stock’s Value = Dividend / Required (RoR) Rate of Return
The above formula is also used to determine the present value (PV) of perpetuity. Also, the formula may be used to calculate the price of the preferred stock of the entity that pays the dividend at a particular rate. The price of the stock may change in the zero-growth model when there is a change in the required rate (RoR) of a return due to the change in risk factors (d'Amico & De Blasis, (2020)).
? Constant Growth Model
When the payment of dividends by any business entity is estimated to grow or increase at the same rate in the future, then it may be said that the business entity applies a constant growth dividend model. It is also known as Gordon (GGM) Growth Model. Valuation of matured companies may be performed based on this dividend model. The dividends of matured companies using this model increase on a steady basis. The formula in the below-provided image is used to determine the value of the entity's share who is applying constant growth model for dividend:

? Variable Growth Model
The variable growth model is the most commonly used dividend model in a real-life scenario. As the business entity goes through different phases, it becomes difficult for the entity to pay the same dividend every year. The growth in the variable model may be divided into 2 or 3 phases. The growth rate in the initial phase may be high, then it may get low in the transition phase and finally, it may end with a lower dividend rate. The formula in the below-provided image may be used to calculate the stock value as per the variable model:
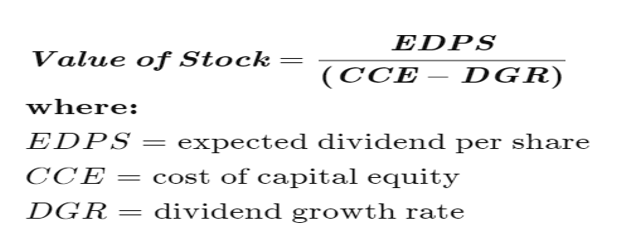
b. Capital Budgeting
Capital Budgeting is a method used in finance to evaluate the potential of a major investment proposal or project (Siziba & Hall, (2021)). It helps the investors to ascertain the value that a potential project may provide to them. Capital Budgeting helps to make an important investment decision that may increase its profitability and ultimately the wealth of its shareholders (Cloyne & Surico, (2018)). Different methods may be used by the business entity in the process of capital budgeting that has been discussed hereunder:
? Net Present (NPV) Value
Net Present (NPV) Value helps to assess the profitability aspect of an investment proposal in the process of capital budgeting (Kadim & Husain, (2020)). The present value (PV) of all the cash inflows that are expected to be generated through the tenure of the project is subtracted from the present value (PV) of all the cash outflows to arrive at the Net Present (NPV) Value. If the difference between the cash flows is positive that the investment project may be considered viable. The discount rate is used to ascertain the expected cash flows of the future period. Assessing the profitability of a project from NPV may have several errors as it is based on various assumptions & estimates.
? Payback Period
The payback period is the period by which the investment cost in any investment project is recovered. It is the period by which the project reaches its break-even. A short payback period is considered favorable by the investors. This method has some limitations as it ignores the time value (TVM) of money. Overall profitability of an investment proposal may not be ascertained through the payback period as it will only tell the time by which cost will be recovered and it will not tell what will happen after such period.
? Internal Rate (IRR) of Return
Internal Rate (IRR) of Return is referred to as a rate of discount that will make the NPV of future cash (FCF) flows to zero. A higher IRR is always considered good by the investors. It is calculated similarly as the NPV is calculated. The only difference in the calculation is that IRR makes the NPV zero.
? Accounting Rate (ARR) of Return
Accounting Rate (ARR) of Return is referred to a rate (RoR) of return that may be expected from an investment in comparison to the cost of the initial investment. ARR is calculated by dividing the average revenue of an asset by the entity's initial investment. ARR is useful when determining the profitability of investment quickly but it ignores the time value (TVM) of money.
c. Modigliani & (MM) Miller Approach
The theory of Modigliani & (MM) Miller Approach states that the overall value of a business entity is not affected by its capital structure. In Modigliani & (MM) Miller Approach's first version there were a lot of limitations as such version was developed with the assumption that a business entity operating in the perfectly efficient industry wherein it need not pay taxes. Later on, Modigliani along with Miller developed the next version of the theory wherein they included bankruptcy costs, asymmetric data, and taxes.
MM Approach in Perfect Market
Modigliani & Miller's first version of the theory assumed that businesses always operate in the perfectly efficient market. This means that the business entities are not required to pay tax, no transaction costs are incurred on the trading of the entity's shares. Also, it had the assumption that no bankruptcy costs are incurred in case of bankruptcy.
Proposition 1 (First Version)
Value of (Vl) Levered Entity = Value of (Vu) Unlevered Entity
According to the first proposition, the value of an entity is not affected by its capital structure whether it is funded by only equity or by a combination of debt & equity as its value is determined by the present value (PV) of future (FCF) cash flows. Additionally, entities need not pay taxes in a perfect market, the entity does not get a benefit tax deduction for the interest on the debt.
Proposition 2 (First Version)
Cost of (Re) levered equity = Cost of (Ra) unlevered equity + Debt to (D/E) Equity (Ra – Cost of (Rd) Debt)
According to the 2nd Proposition of the theory, the Cost of (Ke) Equity and leverage level of entity is directly proportional. When leverage level increases, the entity's profitability of entity also increases.
MM Approach in Real Life
Proposition I
Value of (Vl) Levered Entity = Value of (Vu) Unlevered Entity + Tax Rate x Debt
According to the 1st Proposition, the value of (Vl) levered entity is higher than the unlevered entity's value because of the tax benefit shield on the interest payment.
Proposition II
Cost of (Re) levered equity = Cost of (Ra) unlevered equity + Debt to (D/E) Equity x (1 – Tax Rate) x (Ra – Cost of (Rd) Debt)
According to the 2nd proposition, the cost of (Ke) equity and leverage level of the entity is directly proportional. The effect of tax shield makes the cost of (Ke) equity& entity’s leverage level less sensitive to each other.
Part B
Board Report
Introduction
At Saracen Mineral Holdings, all of our operations are controlled and managed by the Board of Directors on shareholders' behalf. This report has an agenda for the acquisition of the business of one of the listed companies known as Kalgoorlie Consolidated Gold Mines (KCGM) which is also engaged in the business of gold mining.
Reason for Acquisition
The main reason for the acquisition is to become the source player in the gold industry and to remain in the field of basic material . As our company is competing with Saracen Mineral in the Gold industry, its acquisition will help our company in gaining competitive advantages and both the company will merge to create the AUS 16 billion global gold producer (Saracen Mineral Holdings 2019)
Capital Expenditure
On considering the business of Saracen Mineral and its market value, Board is willing to expand a budget of AUD 1099.31million (Saracen Mineral Holdings 2019) Various business valuation methods have been applied to assess the most realistic value for the business of Saracen Mineral .
Business Valuation Methods
? Net Asset Method
Net Asset Method is one of the business valuation methods that derive the value of an entity's business by deducting all the liabilities of the entity from its total assets. The following formula may be used to derive the net asset of the business.
Net Assets = (Assets in Total – Total Liabilities – Preferred Stock) / Outstanding Equity Shares
Net Asset (NAV) Valuation helps to understand the real worth of the business. The acquirer firm always wants to assess the value of the acquired firm to offer the best bid price. SARACEN MINERAL HOLDINGS is getting the value of 50% by paying a sum of $ 750 million which is a very great deal for the entity. This will add value to the wealth of the shareholders in the coming future (Saracen Mineral Holdings 2019)
? Price-Earnings (P/E) Ratio
Price-Earnings (P/E) ratio is used to determine the value of the business by comparing the share price of an entity's share with its earnings (EPS) per share (Anwar, (2019)). PE ratio helps to understand whether the share price of an entity is undervalued or overvalued. This ratio helps to know the value that an investor may pay for an entity's share on the earnings of the entity (Wibowo & Radianto, (2019)). The P/E ratio of KCGM is 24.14 and the P/E ratio of the industry in which Kalgoorlie Consolidated Gold Mines Operates is 18.6. This means that the share price of KCGM is undervalued and it is a great opportunity for us to make our investment in KCGM 's Business.
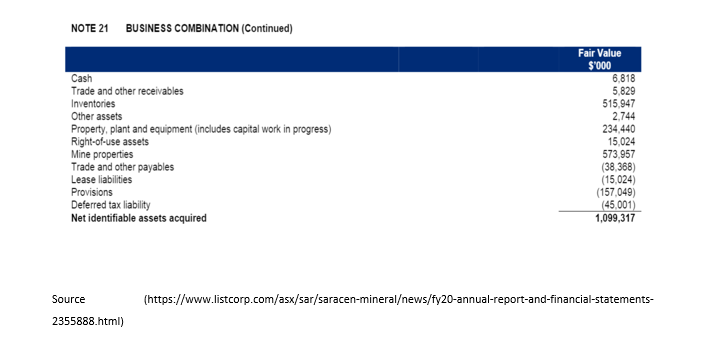
? Discounted Cash (DCF) Flow
Discounted Cash (DCF) Flow is one of the business valuation methods that consider the present value (PV) of all the cash flows that are expected from the investment proposal. The present value (PV) of future cash (FCF) flows are added with the present value (PV) of Terminal value (TV) to arrive at the total value of the business (Fernandez, (2019)). The following images are presented to show the business value of Kalgoorlie Consolidated Gold Mineson the basis of the DCF method:
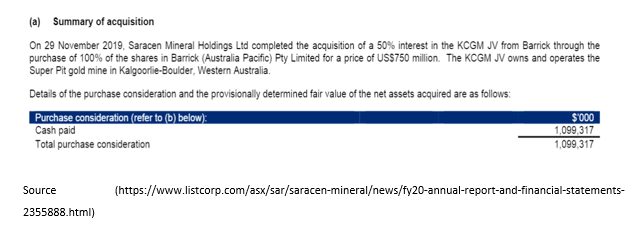
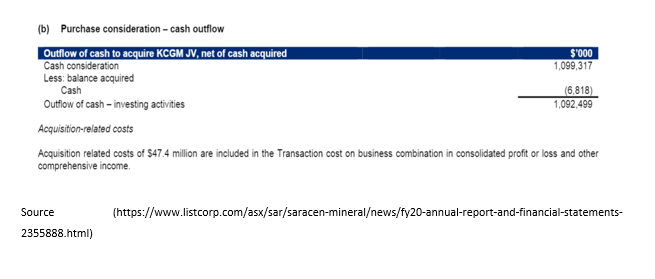
According to the above calculation, the value of each share of KCGM is lower than market price of its share. This means that the share of the company is undervalued and the company has the potential to grow shortly that making it a great investment opportunity that will surely bring value addition to SARACEN MINERAL HOLDINGS and will help in increasing the wealth of its shareholders in near future.
Compliances
? Appropriate standards for corporate governance along with legal compliance are required to be established by the management to proceed with the acquisition.
? Statement on Corporate Governance along with ASX Appendix is required to be approved
? Charter of Board committee is required to be approved
Risk Management
? Framework for managing the overall risk of the company is to be approved.
? Policies regarding risk management, taxes, and financials are required to be approved.
? Due Diligence shall be exercised to make sure that the company is complying with all the required obligations.
Human resources
? Selection, Remuneration, cessation, and termination terms for the Managing director along with the CEO are required to be approved.
? Performance objectives for every person shall be set.
? Incentive plans for the employees shall be considered by the board.
Health & Safety
? Board is required to consider the reports on health & safety along with the environment.
? It shall be made sure that the health & safety of the entity's people is not compromised at any cost and the entity complies with all the environmental obligations.
? Policies related to health & Safety shall be approved.
? Policies related to Environment shall be approved.
References
Anwar, Y. (2019). The effect of return on equity, earning per share, and price earning ratio on stock prices. The Accounting Journal of Binaniaga, 4(01), 57-66.https://stiebinaniaga.ac.id/e-journal/index.php/Accounting/article/download/314/264
Cloyne, J., Ferreira, C., Froemel, M., & Surico, P. (2018). Monetary policy, corporate finance, and investment (No. w25366). National Bureau of Economic Research.https://www.nber.org/system/files/working_papers/w25366/w25366.pdf
D'Amico, G., & De Blasis, R. (2020). A review of the Dividend Discount Model: from deterministic to stochastic models. Statistical Topics and Stochastic Models for Dependent Data with Applications, 47-67.https://arxiv.org/pdf/2001.00465
Fernandez, P. (2019). Three residual income valuation methods and discounted cash flow valuation.http://pruss.narod.ru/ThreeIncome_OneDCF.pdf
Kadim, A., Sunardi, N., & Husain, T. (2020). The modeling firm's value is based on financial ratios, intellectual capital, and dividend policy. Accounting, 6(5), 859-870.http://m.growingscience.com/ac/Vol6/ac_2020_48.pdf
Sahoo, V. D. Investors perception on Dividend Policy and Valuation Models (2020) .https://www.academia.edu/download/79810078/13635.pdf.pdf
Siziba, S., & Hall, J. H. (2021). The evolution of the application of capital budgeting techniques in enterprises. Global Finance Journal, 47, 100504.https://repository.up.ac.za/bitstream/handle/2263/74586/Siziba_Evolution_2020.pdf?sequence=1
Wibowo, A. I. L., Putra, A. D., Dewi, M. S., & Radianto, D. O. (2019). Differences In Intrinsic Value With Stock Market Prices Using The Price Earning Ratio (Per) Approach As An Investment Decision Making Indicator (Case Study Of Manufacturing Companies In Indonesia Period 2016-2017). Aptisi Transactions On Technopreneurship (ATT), 1(1), 82-92.https://att.aptisi.or.id/index.php/att/article/download/23/6
Assignment
BST903 Financial and Business Analytics Assignment Sample
INDIVIDUAL ASSIGNMENT
KEY DETAILS:
The individual assessed assignment counts for 50% of your final module mark.
The submission date for the assignment is: 11 February 2022 by 11.00a.m.
GUIDELINES
You are required to answer all parts of the assignment. The word limit for the assignment is 2,000 words, excluding appendices, tables and a reference list for assignment help Calculations may be included as part of the appendices (they will not form part of the word count). Please note that failure to comply with the word limit may result in a restriction of marks.
You will be awarded marks for the assignment for a number of different criteria, including evidence of conceptual understanding of the material being tested, clear and accurate analysis of the data, and analytical and critical thought. You will also be awarded marks for originality and evidence of additional reading. Finally, a proportion of marks will also be allocated for the structure, style and logical development of the report, and grammar and appropriate referencing (you should reference appropriately all your work and cite the complete list of references used at the end of the report).
Kindly double/1.5 space your report and submit it via Learning Central.
All administrative issues should be directed to the Postgraduate Hub: carbs-PGQueries@cardiff.ac.uk
1. Introduction
The board of directors met for their regular quarterly meeting on 6 January at which the CEO, Charles Chatters, presented details about a new project. The board also, as part of its agenda, considered the funding preferences for this project and potential future ones.
The meeting of 6 January was the first meeting that Fred Franks (FF) the new finance director attended. Discussions at the meeting got somewhat heated when FF suggested that the company use the net present value model of investment appraisal to appraise capital projects. CC immediately became defensive and resisted this advice - arguing that the company had traditionally used the accounting rate of return model and ‘there was no need to change methods of appraisal’.
CC and FF were also disagreed on methods of financing for future investment projects. While FF deemed it prudent to use the retained surplus cash within the company before seeking external funding, CC was keen to seek out new debt, as the cheaper form of finance. The company currently has surplus funds of £120 million.
Following the diverse views of the board, a decision was taken to seek advice from an external consultant.
2. Investment Project
In recent years, CC has been keen to move into the niche market of healthy snacks. Following a sizeable investment into the research and development of such products (the costs of which have been written off in the annual accounts), the company has developed a new healthy snack for toddlers, Wigglers. CC now hopes that Wigglers is a commercially viable product. His team has generated the following data.
i. The company would manufacture the product out of its Bournemouth site that is currently unused, if deemed worthwhile. It would require capital investment in plant and equipment of £100 million, half of which is payable immediately and the other half in twelve months’ time. The plant and equipment will have a useful life of five years, at the end of which it will be sold for £25 million.
ii. Annual sales volume of Wigglers is expected to be 10 million wholesale boxes for the first two years. Thereafter it will fall by 20% as competition rises; this fall will be a one-off in year three and stagnate at this level thereafter. The sales price per wholesale box has been proposed to be £22.00 for the duration of the project.
iii. Variable costs per wholesale box have been estimated as follows:
Variable materials 8.00
Variable labour 1.80
Variable overhead 1.20
In addition, fixed costs inclusive of depreciation of plant and equipment have been calculated at £84 million per annum.
iv. Depreciation is computed on a straight-line basis by the firm. All assets are depreciable.
v. The company requires a working capital investment of 10% of the annual sales value. 95% of the working capital investment is expected to be recovered. Working capital investment levels (and in turn working capital recovered) reflect any change in demand patterns.
The company pays taxes at a rate of 20% and makes ample profits onto which to pay this tax. Finally, Magenta plc has a required rate of return of 15%.
3. Company Background
Magenta plc’s humble beginnings started with a staff base of 18 employees in 1988 and a turnover of just £240,000. Currently listed on the Alternative Investment Market (in 2000), the company is valued at £4 billion and has 3,500 employees across 15 locations in the UK. Originally specialising in potato crisps, today the company manufactures a range of different snacks, catering for different client preferences. The company’s financial performance has generally shown an upward trend and in recent years this is in part a reflection of its rapid expansion programme under the leadership of the current CEO. CC joined the company 8 years ago and has led considerable expansion of the business and has two more years to run before he retires. One observation in light of the expansion plans is that Magenta plc is more heavily geared than its competitors – 10% more than the industry average (ruling out any outliers).
REQUIRED:
PART A (20 Marks, split equally between Ai and Aii)
Assuming that the objective of the firm is to maximise the wealth of its shareholders:
i. Appraise the investment project using the two models supported by senior managers and determine whether Magenta plc should proceed with the manufacture of Wigglers, giving a justification for your choice of model. You may use a spread sheet for your computations;
ii. Drawing on literature you are familiar with, evaluate the views put forward by the senior managers in relation to the financing choices should the current project (or indeed other projects) be selected, proposing a solution based on your assessment of the company’s position.
(Indicative word count: 400 words for Ai and ii combined)
PART B (40 Marks)
CC firmly believes that budgets should be set by the board and then imposed on those in functional/operational positions, whereas FF thinks that the company's budgeting system is far more likely to attain its objectives if employees and junior management are given a say in how their budgets are set.
Give a critical review of the two apparently conflicting opinions, considering claimed advantages and disadvantaged from both practical and theoretical perspectives.
(Indicative word count: 800 words)
PART C (40 Marks)
Based on data relating to the six major firms in the snack industry as presented in the tabs of the accompanying Excel spread sheet:
i) Calculate the industry weighted average of a) the return on capital employed (%) and b) the gearing ratio (%). You should fully discuss your weighted averages, and clearly explain any key underlying assumptions in making these calculations.
ii) Calculate the standard deviation for the two variables in C(i) above. You should fully discuss your results for the standard deviation, along with any assumptions you have made in undertaking these calculations.
You may choose whichever approach you consider the most appropriate for calculating the weighted averages but you must specify and justify that approach.
(Indicative word count: 800 words)
Solution
Part A
Appraise the investment project using two models.
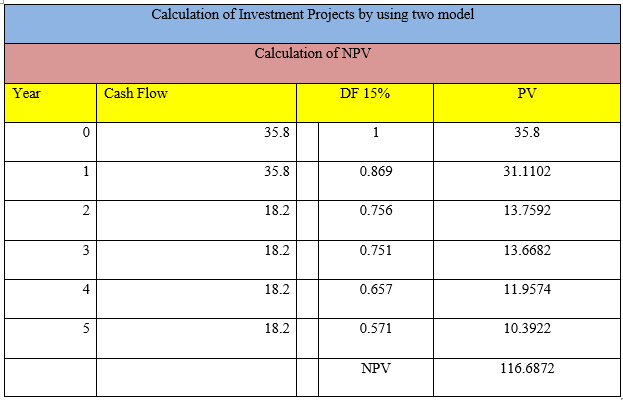
Table 1: Net Present Value
(Source: Created by Author)
Model NPV is considered as the time value of money. These are specified as the financial metrics that have to seek capture with the total value with potential value opportunity. Here, the value of NPV is 116.6872. Discounting factor is 15%. The positive value of NPV indicates the projected earnings that exceed the anticipated costs.
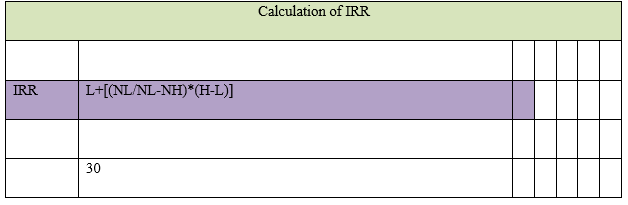
Table 2: Internal Rate of Return
(Source: Created by Author)
There is the calculation of IRR = L+[(NL/NL-NH)*(H-L)] (Wild 2019). Value comes in IRR is 30.
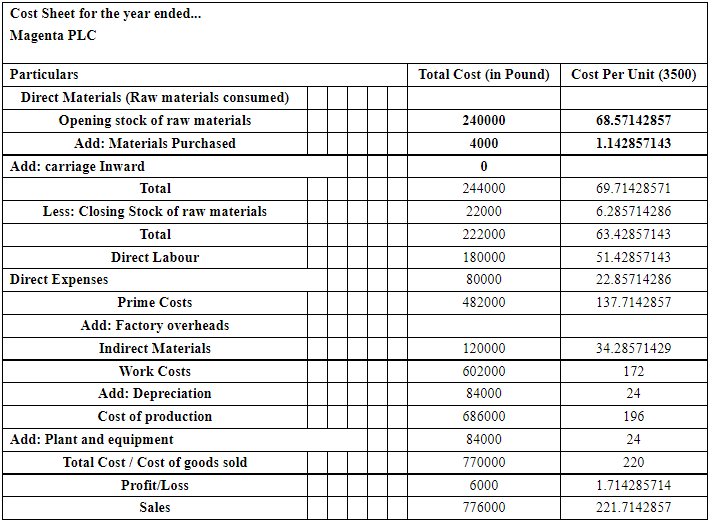
Table 3 Cost Sheet
(Source: Created by Author)
There is the following calculation of the cost sheet of Magenta PLC. The value of sales is GBP 694200. Here, the valuation of Magenta PLC is GBP 4 billion. Calculation of cost sheet is important for analysing production and factory costs (Appelbaum et al. 2017).Value of plant and equipment is GBP 84million.Magenta PLC is making working capital investments of 95%. Opening stock os raw materials are GBP 240000 million is based on 18 employees. Accurate costing information verifies the capacity to build and maintain a proper business in an organisation (Morningstar.com 2022). Here, the total cost/ cost of goods sold is GBP 688200.
Evaluate the views with senior managers about financing choice of current projects.
In this organisation, financial managers are responsible for the financial health of the organisation. Guiding as per supervisors in an individual’s departments is the following responsibilities roles of the senior managers. Investing and financial planning have to be analysed organisation weaknesses and strengths. Managers of organisations help to improve the profitability of an organisation. The above financial analysis is familiar with the business because of the positive value of Net present value. The positive value of net present value iis accepted for investment analysis. This current project must be select for the organisations current position. Most simple way of net present value determines about the market capitalisation of an organisation. Managers should be accepted positive value of NPV because of the free additional cash flows. Magenta PLC is required working capital investments 10%. Positive amount of IRR is also acceptable of a business organisation. Calculation of Net present value is done with the help of discounting factor 15%.This mainly, indicates about the angel investments, which is considered as the good for the organisation.
Senior manager assisting departments by creating and managing forecast and budgets for gathering information of an organisation. Financial manager helps to build capital structure of the organisation (Sun et al. 2017). This business used as a combination of financing sources and raising funds. Proper financial decision helps to perform in the financial statement analysis of the organisation.
Part B
Advantages and disadvantages of budgets in both theoretical and practical perspectives
Top down is more tedious in nature and have a vital advantages in growth of financial. Proper budgeting should be used in managing the money efficiently. Top down approach has an advantage for stating based on goal and budget allocation in an organisation. Specific flexible budgets are created by using formula and certain price of the organisation. Budgeting helps to know about the specific information of financial position in the organisation and in this organisation, flexible budgets and saves time with more realistically emphasising executive resource planning and decision in an organisation.
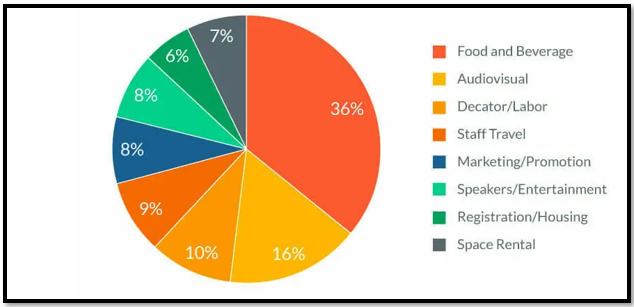
Figure b.1: Graph of budget in CC firm
(Source: Kim et al. 2020).
Certain financial criticisms of budgets have to reduce flexibility and entities of an organisation. Proper budgeting systems arises motivation of an organisation. Bottom down approaches in budgets is creating a financial budgeting in an organisation. Proper department of the organisation is creating is creating cost projection and list in expenses. Budget of employees in bottom down approaches of budgets can approved capital expenditure in a specific period.
A disadvantage in top down approaches may lead over and under employment with new plan of budget allocation. Top down approaches of may result in unrealistic calculation economic situation and organisational activities. Budgeting mainly allows to the financial managers to explore revenue and price within the sets of the operating assumptions. This represents a certain qualifications within management features. The Top down approach has eliminated bulks and fragment and accumulated High employment coverage and with having top visibility are the advantages of implementation in practical approaches. Specific standardize with services and products is having a business impacts of the theoretical approaches in management. Whereas the Bottom ups approach has initially identified the Proper budgets are having conflicting roles to evaluate co coordinating activities in an organisation. Output of the budgets should be matched with projected sales. In preparing the budgets properly, managers of all the levels of management have to take systematic rules of the organisation (Aydiner et al. 2019). Operational budgets systems are having vital roles that built difficult to meet them. It is often to evaluating individual managers from their budgets standards effects in price or certain circumstances in this development expenses.
There is the potential conflict of top down approaches between motivation and evaluation roles of budgets. Top down approaches involves with senior management team that can improve high level of budgets in organisation. During the end of the budgets periods, certain modification and adjustments have to be made for changing this environmental condition in this organisation. Budgets are having specific consequences that have to achieve financial and academic goal of these organisation. Bottom down budgeting helps in indicating faster budgeting procedure and better financial controlling of the organisation. Effective budget mainly, forecast expenses and incomes of this organisation. Significance of the budgets helps to make investment contribution. Inaccurate forecasting and having potential with underperformance can be deducted in performance of demand planners in the organisation (Vidgen et al. 2017). Budgets are the following estimation of expenses and revenue in a specific future period.
Budgeting is also having unrealistic outcomes in this organisation. Following budgets is also set with assumptions that generally are not so distant in operating conditions. Top down approaches; budget can save both resources and time of the organisation. Due to these approaches, managers of the organisation can saves time in organisation and can use to formulate of implementation in budget Proper cost structure and organisation’s revenue can be change actual results from this expectations plotted of the budgets. In this organisation, there is rigid decision making in the practical perspective of budgets functions. Here, budgeting procedure mainly, focuses in the attention of management strategy and team during this budget formulation. Top down approaches of budgeting have to decreases the motivation of lower level manager. For this top down approaches, there is creating a conflict between organisation executive and lower level manager. Proper budget creation in practical perspectives is a very time consuming. Work required in the budget is more extensive, if the conditions of the business constantly change in the repeated iterations of budgets periods. Time is consuming low, if there is better design in the creation of budgets. In this organisation, an experienced financial manager can be attempt in introducing budgetary slack, this mainly, involves deducting in estimating revenues and also improving this estimated expenses.
Lack of Practical perspectives in budgets is having expenses allocation that prescribed a specific amount of certain price. Managers of expenses allocation departments of this organisation are not allowed to provide alternatives due to the lower price services. Thus, proper budgets is making tends for the managers entitled certain amount of funds in a year. If this department is allowed with specific amount of expenditure, then it cannot appear in the quantitative aspects of the business (Appelbaum et al. 2018). Following nature of budgets is so numeric and it considers as a financial outcomes of this business. This usually means that the budgets intend to focus in maintaining or improving aspects of profitability. If, this department does not have any of the budgeted outcomes, then this department managers can be blame any of the other departments and provides certain services.
Top down approaches is creating easier to manage in implementation and drafting with goal of organisation. Ideas or projects in bottom down approaches are deciding proper values of organisation’s budgeting, that provides a great expectation in organisation. Budgets lead to the inflexibility in the decision making of an organisation. Budgeting has to be considered as the time consuming process in any of the large business. Procedure of budgets, is mainly consider financial outcomes. Proper nature of budgets tends to focus with management attention in these quantitative aspects of organisation.
Part C
Calculate the industry weighted Average
ia) Return on capital employed
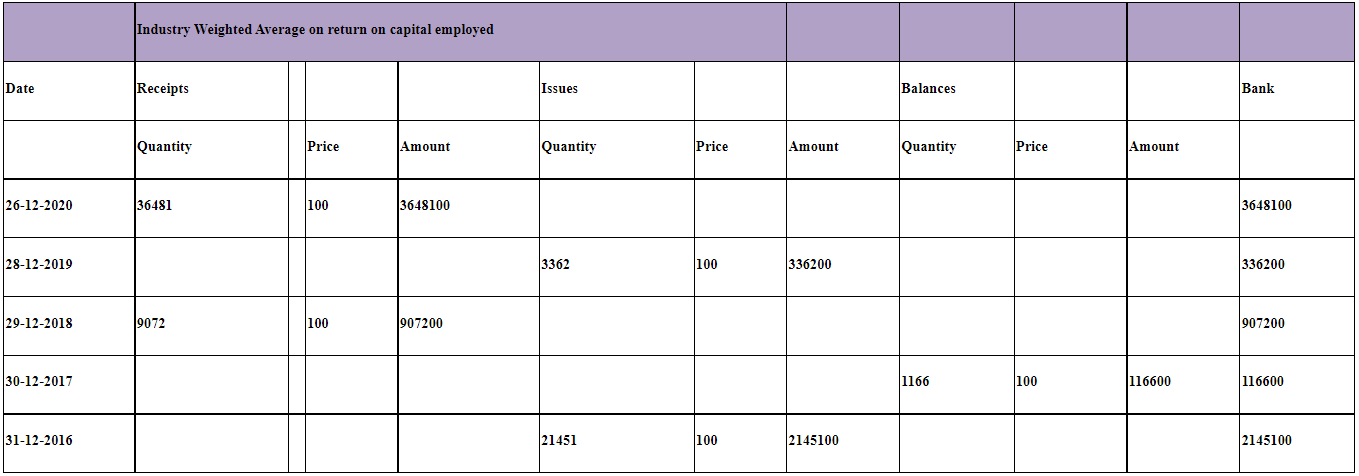
Table 5: WACC
(Source: Created by Author)
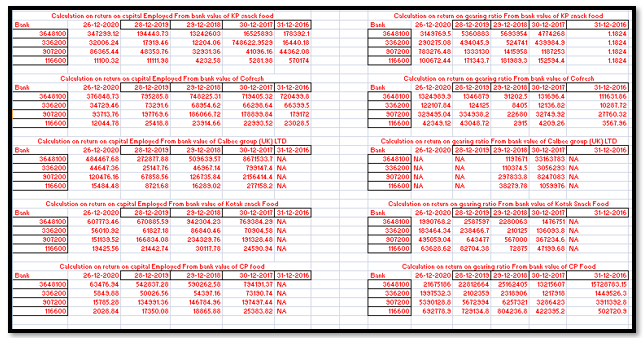
Table 6: Calculation on Return on capital employed and Gearing Ratio
(Source: Wang and Byrd 2017)
The Calculation of WACC is done by net tangible assets and Here, in 26-12-2020 36481*100 = 3648100, in issues of 28-12-2019 is 3362*100 = 336200, in receipts amount of 29-12-2018 is 9072*100 = 907200, in balance amount of 30-12-2017 is 1166*100 = 116600, in 31-12-2016 is 21451*100= 2145100. There is the following calculation of weighted average method of capital employed. Here, is the calculation of receipts, issues and balances of the bank. Further calculation of Specific amount of 26-12-2020 is GBP 3648100, in 28-12-2019 is GBP 336200, in 29-12-2018 is GBP 907200, in 30-12 2017 is GBP 116600 and in 31-12-2016 is GBP 2145100. There is the calculation of WACC from the ratio return on capital employed and gearing of five companies. Five companies are KP snacks limited, co-fresh, Calbee group (UK) limited, Kotak snack food and CP food.
Return on capital employed has to be calculated with the dividing net profit and capital employed (Wang and Byrd 2017). It is useful to calculate because of comparing the performance of the organisation with the sectors of capital intensive. These analyses prove as the following business gains from the certain assets and liabilities of this organisation (Lacerenza et al. 2018). Return on capital employed represents amount of specific capital investment in front of operations.
b) Gearing Ratio
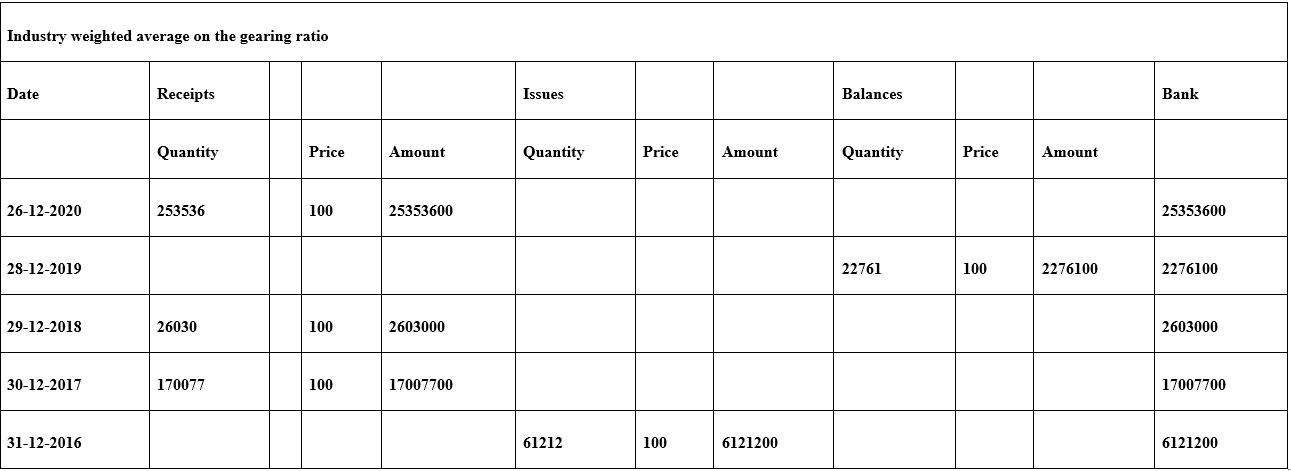
Table 6: Gearing Ratio
(Source: Created by Author)
Industry weighted average return on gearing ratio have to be calculated in multiplying costs and capital of each of the following sources (Kumar et al. 2017). This causes a relevant sources of equity and debt, that can determines value of organisation. Calculation of the has been done by identifying Balance of 26-12-2020 has been calculated as GBP 25353600, in 28-12-2019 is GBP 2276100, in 29-12-2018 is GBP 2603000, in 30-12-2017 is GBP 17007700 and in 31-12-2016 is GBP 6121200.
Capital employed of the following balance sheet is the measure of reduced in valuing assets and current liabilities. Here, present liabilities of an organisation are considered as the portion of organisation’s debt. Working capital in gearing ratio maily, shows the amount of liabilities and assets of an organisation (Kokina and Davenport, 2017). Capital investments in gearing ratio represents how much of owner has invested into the business along having prospering profits. Gearing ratio mainly measure, how much operation are funded and received from shareholders as an equity. Gearing ratio in weighted average return indicates financial leverage and level with interest bearing of organisation. This analysis mainly, determines about the firms operation have to be funded with the shareholders. There is having appropriate level of the gearing ratio in organisation (Hofmann and Rutschmann 2018). 60% of this organisation shows debt level and 60% of its having equity. Gearing ratio can be manageable, for the utility in an organisation.
ii) Calculate the standard deviation of two variables
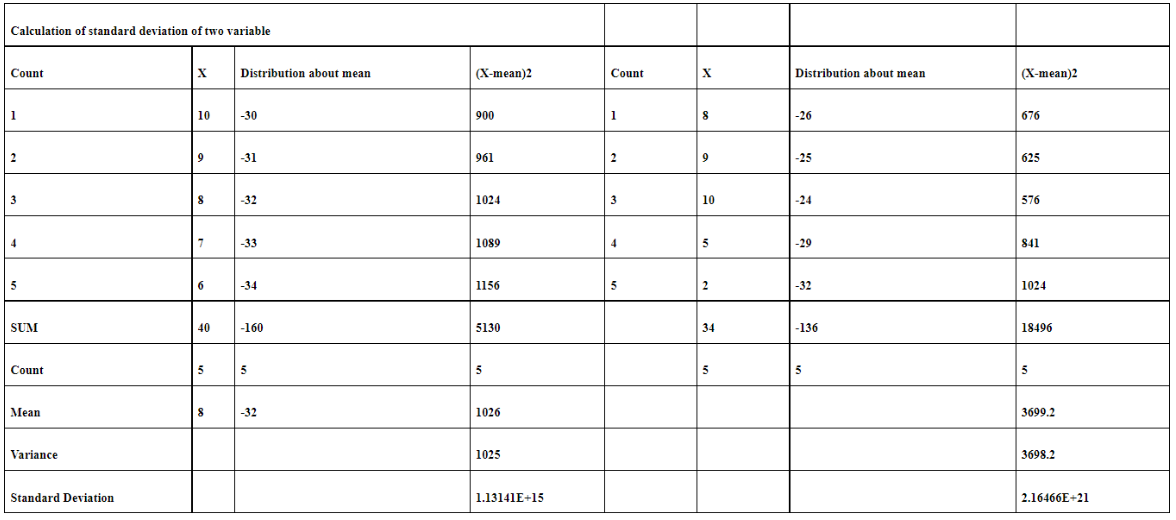
Table 6: WACC
(Source: Created by Author)
There is the following calculation of standard deviation of X and Y. Standard deviation of X is 1.31 and standard deviation of Y is 2.16. This analysis verifies about the spreading the values within datasets. Following calculation of variance of X have to be done by sum/Count-1. 5130/5 = 1025. Variance of X is 1025 and variance of y is 3698.2. The analysis of standard deviation is the following statistical terms that have to be measured in financial statements. Standard deviation is useful in analysing of trading strategies and also formulating proper investments decision of an organisation (Weber et al. 2019). Potential investments of an organisation are having important factors of an organisation. Return of investment helps in determining specific standard deviation of the organisation.
Analysis of standard deviation helps to calculate proper margins with error in consumer satisfaction and inventory prices. Standard deviation has to be determined by the variability in an organisation. Proper variance can help in finding distribution of information in this analysis. Standard deviation specifies the accurate mean of an organisation. Uses of standard deviation cannot assume its normality of the organisation. Formula of identifying the distribution of mean is (X-mean) and (X-mean) 2. Following calculation is based on the square root of the two variance by determining the data points related to its mean (Shaturaev, and Bekimbetova 2021). Assumption of normal distribution in standard deviation has to be obtained by random allocation and random sampling.
References
Journal
Appelbaum, D., Kogan, A., Vasarhelyi, M. and Yan, Z. 2017. Impact of business analytics and enterprise systems on managerial accounting. International Journal of Accounting Information Systems, 25, pp.29-44. Available at: DOI: http://dx.doi.org/10.1016/j.accinf.2017.03.003 R. [Accessed on: 1st February 2022]
Appelbaum, D.A., Kogan, A. and Vasarhelyi, M.A. 2018. Analytical procedures in external auditing: A comprehensive literature survey and framework for external audit analytics. Journal of Accounting Literature, 40, pp.83-101. Available at: DOI: https://doi.org/10.1016/j.acclit.2018.01.001. [Accessed on: 1st February 2022]
Aydiner, A.S., Tatoglu, E., Bayraktar, E., Zaim, S. and Delen, D. 2019. Business analytics and firm performance: The mediating role of business process performance. Journal of business research, 96, pp.228-237. Available at: DOI: https://doi.org/10.1016/j.jbusres.2018.11.028 R [Accessed on : 1st February 2021]
Hofmann, E. and Rutschmann, E. 2018. Big data analytics and demand forecasting in supply chains: a conceptual analysis. The International Journal of Logistics Management. Available at : DOI: https://doi.org/10.1108/IJLM-04-2017-0088. [Accessed on: 1st February 2021]
Kim, A., Yang, Y., Lessmann, S., Ma, T., Sung, M.C. and Johnson, J.E. 2020. Can deep learning predict risky retail investors? A case study in financial risk behavior forecasting. European Journal of Operational Research, 283(1), pp.217-234. Available at: https://core.ac.uk/download/pdf/250590642.pdf. [Accessed on: 1st February 2021]
Kokina, J. and Davenport, T.H. 2017. The emergence of artificial intelligence: How automation is changing auditing. Journal of emerging technologies in accounting, 14(1), pp.115-122. Available at: DOI: 10.1002/isaf.277 [Accessed on: 1st February 2022]
Kumar, A., Sah, B., Singh, A.R., Deng, Y., He, X., Kumar, P. and Bansal, R.C. 2017. A review of multi criteria decision making (MCDM) towards sustainable renewable energy development. Renewable and Sustainable Energy Reviews, 69, pp.596-609. Available at: DOI: http://dx.doi.org/10.1016/j.rser.2016.11.191 R [Accessed on : 1st February 2022]
Lacerenza, C.N., Marlow, S.L., Tannenbaum, S.I. and Salas, E. 2018. Team development interventions: Evidence-based approaches for improving teamwork. American Psychologist, 73(4), p.517. Available at: DOI: 0003-066X/18/$12.00 http://dx.doi.org/10.1037/amp0000295 [Accessed on: 1st February 2021]
Shaturaev, J. and Bekimbetova, G. 2021. THE DIFFERENCE BETWEEN EDUCATIONAL MANAGEMENT AND EDUCATIONAL LEADERSHIP AND THE IMPORTANCE OF EDUCATIONAL RESPONSIBILITY. InterConf. Available at: DOI: 0000-0002-0982-5741. [Accessed on : 1st February 2022]
Sun, Z., Strang, K. and Firmin, S. 2017. Business analytics-based enterprise information systems. Journal of Computer Information Systems, 57(2), pp.169-178.. Available at : DOI: 10.1080/08874417.2016.1183977 [Accessed on : 1st February 2022]
Vidgen, R., Shaw, S. and Grant, D.B. 2017. Management challenges in creating value from business analytics. European Journal of Operational Research, 261(2), pp.626-639. Available at: DOI: https://eprints.bbk.ac.uk/id/eprint/19847/ [Accessed on: 1st February 2022]
Wang, Y. and Byrd, T.A. 2017. Business analytics-enabled decision-making effectiveness through knowledge absorptive capacity in health care. Journal of Knowledge Management. Available at: DOI: link to article: https://doi.org/10.1108/JKM-08-2015-0301 [Accessed on – 1st February 2022]
Weber, M., Domeniconi, G., Chen, J., Weidele, D.K.I., Bellei, C., Robinson, T. and Leiserson, C.E. 2019. Anti-money laundering in bitcoin: Experimenting with graph convolutional networks for financial forensics. arXiv preprint arXiv:1908.02591. Available at: DOI: https://arxiv.org/pdf/1908.02591.pdf. [Accessed on: 1st February 2022]
Wild, J. 2019. Financial Accounting: Information for Decisions, 9e.DOI: Detailed List of New Features. Available at: http://ecommerce-prod.mheducation.com.s3.amazonaws.com/unitas/highered/changes/wild-financial-accounting-9e.pdf [Accessed on: 1st February 2022]
Website
Morningstar.com, 2022. Magenta 2020 PLC. Available at: https://www.dbrsmorningstar.com/issuers/24720/magenta-2020-plc. [Accessed on: 1st February, 2022]
Research
MBM BST 713 Analysing Financial Performance Assignment Sample
Assignment Brief
• You are required to produce a 2,000 word individual report containing:
An analysis of the financial performance and position of Marks and Spencer. Your analysis should be based on your calculation of basic accounting and financial ratios for 2021, and 2020 for comparative purposes; and an evaluation of the results of those calculations. In addition, your analysis should be supplemented by key data contained in the narrative sections of the 2021 annual report and other sources; (40 marks)
• a consideration of Marks and Spencer’s prospects for the foreseeable future, taking into account the challenges facing the group and its responses thereto;(30 marks) and,
• drawing on appropriate literature, an assessment of the extent to which Marks and Spencer could justifiably claim to have a diverse board of Directors. (20 marks)
The remaining 10 marks will be awarded for the presentation and structure of your report and appropriate referencing.
The report can be found here:
https://corporate.marksandspencer.com/msar2021/m-and- s_ar21_full_210602.pdf
Report Guidance:
As a guide, for the report, you should aim to devote:
• 900 words on Marks and Spencer’s past financial performance;
• 600 words on the future prospects of the group; and
• 500 words on the corporate governance aspect.
In addition, you should present the accounting ratios as a table in an appendix to your report for https://www.theassignmenthelpline.com/ (see proforma on final page); the appendix will not be included in the overall word count for the assignment. You MUST show the figures you use in the calculation of the ratios AND, if they do not come from the face of the Consolidated Statement of Comprehensive Income or the Consolidated Statement of Financial Position, you must show the exact source of the figure(s). Failure to do so will result in no marks being awarded for that calculation.
Your report should also be:
1. Word-processed;
2. Professionally presented with page numbers and having undergone a Grammar/spell-check;
3. Properly referenced (where you use words taken from a source, you must give a proper citation to that source).
Academic Misconduct
You need to be aware that this is an individual assignment. Academic misconduct will not be tolerated. Do not be tempted to copy another’s work or use another person to do the work that you should do yourself. Academic misconduct will result in an award of a zero mark, at best; at worst, the consequences could be more serious.
Submission Details:
Deadline for submission is: 11.00 AM BST, March 18, 2022. The report must be submitted via the Learning Central portal. If you have any queries or difficulties with submitting your work, please address those to the PG Hub, NOT to academic staff.
Solution
Introduction
The business environment is uncertain and dynamic that is faced by the business organization. This report provides the business performance analyses of Marks and Spencer by implementing the ratio analyses tool. It also contained the recommendation to improve the business performance of the company. It considers the foreseeable future of the company and the challenges faced by the company. Diversify board of directors has been assessed in this report.
Company outlook(MKS.L)
Marks and Spencer Group plc engaged in the industry of department stores in the sector of consumer cyclical with the total number of employees of 69577. It operates as a retail store in 5 segments. These five segments are UK Clothing & Home, UK Food, International, OCADO, and all others. It offers protein daily, ambient, dairy produce, meals dessert, and food on move products. It also provides women's wear, menswear, and clothing for kids. Apart from that company invest in real estate property. It has been founded in 1884 and headquarter in London, The United Kingdom (MKS.L 2021).
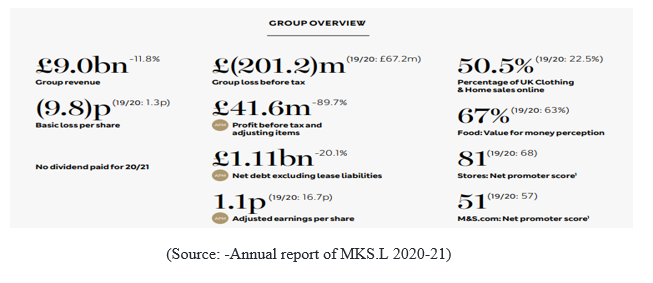
Financial review of MKS.L
To assess the financial performance of the business organization, the ratio analyses tool is the best option. It helps to assess the financial data of the company in comparative form so that trends in each financial item can be understood easily. It considers the financial data of more than 1 year. Following are the computational ratio analyses of the Marks and Spencer Group plc:-
Core ( Financial Ratio computation)
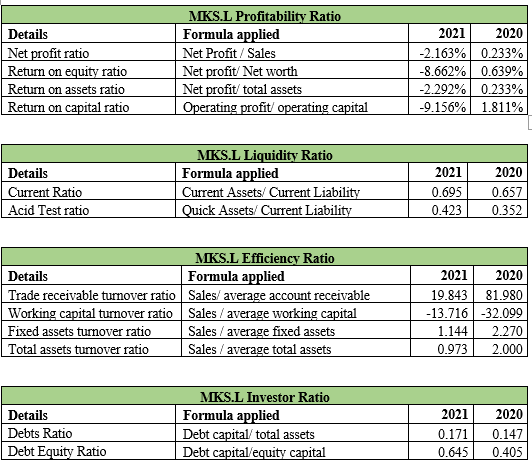
Additional ( Interpretation , Notes to accounts)
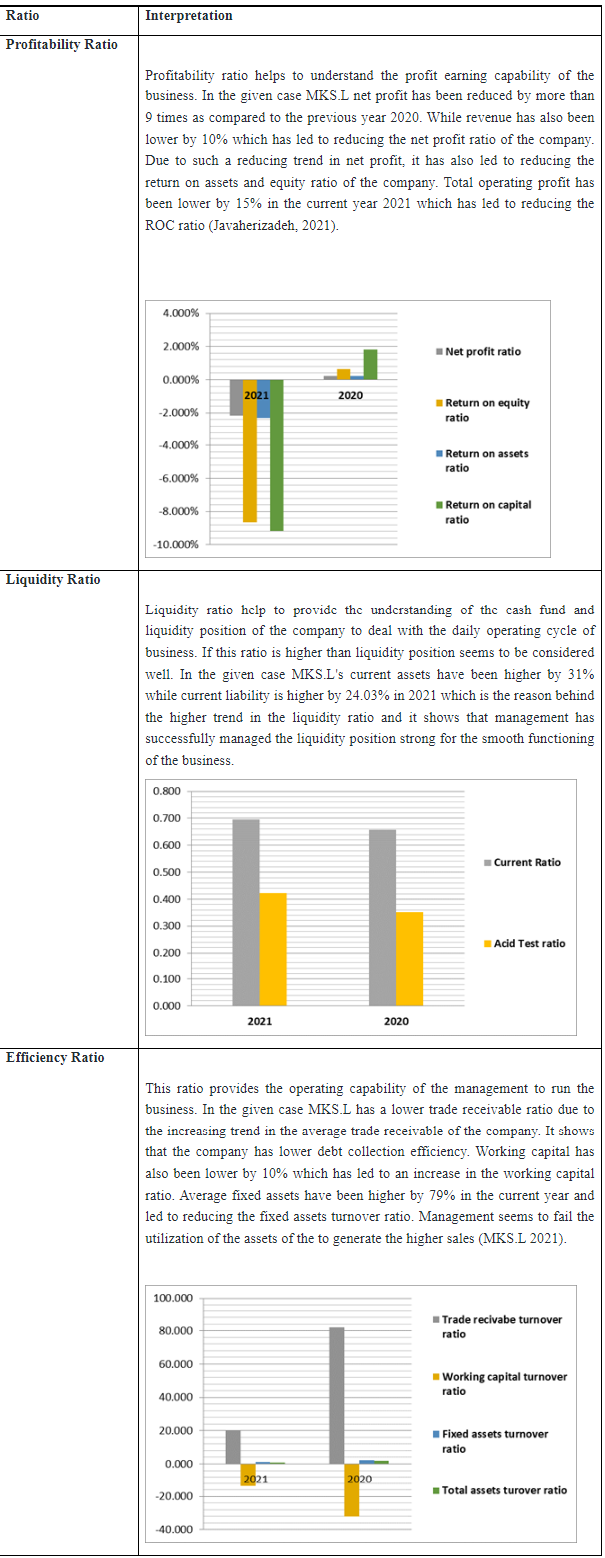
Narratives
Hence it can be observed that MKS.L company has not performed well in the current year 2021. It needs to improve the performance by considering the cost control factor so that profitability gets positive in next upcoming years. The company needs to improve the efficiency ratio too so that operating capability can be increased and businesses will get benefit from it. The company should focus on the long-term goal and cost control should also be done by incorporating the new policy (Easton,& Zhang, 2018).
Future Prospectus
Marks and Spencer Group Plc. is a British based multinational company that runs its business in the retail sector and the headquarters of the company is located in London. The company has different lines of business which includes retail stores of clothes, food stores, and home products. The company had its presence in the industry for a long. But, in 2018 a radical plan was issued by the company where it stated that the company will be closing its 100 stores worldwide by 2022 (MKS.L 2021).
During the pandemic, the company has cut down more than 7,000 jobs, because the stores were closed and the expenses of the company were exceeding the income that the company was earning from running the stores. Moreover, again in 2021, the company has announced that other than 100, it will be closing 30 more stores, in the next 10 years, as a part of its turnaround plan. Based on the financial analysis conducted above, it can be said, that in some areas the company has been able to maintain its stance, such as the liquidity of the company is strong in 2021 in comparison to 2020. On the other hand, the efficiency ratios of the company have declined which states that the company has not been utilizing its assets to earn income for the shareholders (MKS.L 2021).
Core Analysis
In the past few years, the company is facing several issues, due to which the company had to come up with different turnaround plans, where they are deciding to close the stores. The policy of the company has always been clear, where they want to satisfy the customers by providing them valuable products. As a part of its future, the company has decided that they want to come up with stores that fit the future and will help the company to achieve its transformation goals. The strategy that a company can use is to open the right stores, at the right locations. This can be done by conducting market analysis, which will help the company to identify the central locations, where the company should open its stores. It will also help the company to close the stores in the location which is not yielding results for the company (Joshi, et al., 2021).
To achieve the future that the management has seen the company will require to indulge in some investing and renewing the new stores to target the new markets that the company is viewing. This can be done by redeveloping the existing space that is available with the company. There are several risks and issues that the company is facing, which is stopping the company from moving forward.
One such issue has been exiting of UK from EU. This has initiated the Brexit contract among, which the trade between UK and EU countries have been limited. Hence, the company has to work on its importance and make strong its third-party relationships. The company plans to do this, by focusing on customer loyalty and improving the brand experience provided to customers.
External fact analysis
Apart from this, there are several regulatory changes in SOX that are impacting the business of the company. As the regulations are changing, the risks of the company coming under scrutiny have increased and the future reporting requirements of the company has also increased. However, in the past two years, the performance of the company has declined in several aspects because of the emergence of the pandemic but, it has also helped the company to learn new things. Such as it has helped the company to understand how it can respond to the customers quickly and how important it is to maintain touch with the customers. As a result, the company immediately decided to improve their website, so that customers who cannot go to retail stores can order goods online. This involved refocusing the strategy of the company, and instead of maintaining retail stores, the company should try to shift its focus to online stores (Schleper, et al., 2021).
In the future, the company wishes to accelerate its stores, and improve the experience of customers. Also, the main issue or challenge that the company is facing is regarding its property portfolio which is aged, due to which the company is not able to focus on its earning from investment in property. Hence, the company plans to upgrade its property portfolio, which has been negatively impacted due to pandemic.
Hence, if the company implements what they have decided while keeping the sustainability aspect in mind, the company will have a bright future.
Governance practice:
The responsibilities that are borne by the board of directors of the company are very important. They are basically the agents of shareholders, who are the owners of the company. The duty of the board of directors is to manage the business effectively and formulate operating and financial strategies to ensure that the practices of the company are helping the business to grow (Zopounidis, and Passas, 2020).
Over the years, the focus has been put on the board of directors, whereas part of the regulation, it is compulsory for every company to have non-executive directors on their board. Along, with this, it is important that at least one of the non-executive directors is a person with skills and competence in accounting, finance, etc. Hence, here the importance of board diversity is dictated. When there is diversification in board, it leads to effective decision-making, it helps in better utilization of talent, and it increases the level of relationship that company has with the shareholders of the company (Dicuonzo and Dell’Atti, 2022).
Diverse board of directors
The governance of Marks and Spencer is also diversified. Over the years, there are several changes that the company has made in its board of directors, were not long back company has introduced two more non-executive directors, and the same was done by the company to ensure that their board of directors are balanced. This is done because of the uncertainties that are prevailing in the market amid pandemic and Brexit (Yukhno, 2022).
The board of directors of the company is diversified and it helps them to enhance their decision making. Some directors of the company are proficient in law and help the company to ensure that they are abiding by the legal laws. Other directors of the company are proficient in finance and help the company to take decisions amid pandemic, and how the situation can be controlled.
Recommendation
Hence, for every company in the business, it is advisable that the board of directors of the company are diversified, as it will help them to improve their choices, and will lead to better decision making. When the board of directors of the company are not diversified it leads to bad decision making, because the choices are limited, and there are no educated people who will question a decision, or who will put their opinion in front.
Conclusion:
From the above, it can be concluded that Marks and Spencer have been in the retail business for a long now, as the company had been able to make its name in the industry. However, for the past few years, the company is facing issues, due to which they have taken the decision of closing some of the stores. As a result, the company is thinking of renovating the strategies that they have currently employed, which included new stores, and diversifying the board of directors of the company.
Reference:
Aigbedo, H. 2021. An empirical analysis of the effect of financial performance on environmental performance of companies in global supply chains. Journal of Cleaner Production, 278, 121741.https://www.sciencedirect.com/science/article/pii/S0959652620317881
Annual report of the Marks and Spencer has been retrieved from https://corporate.marksandspencer.com/annualreport
Dicuonzo, G., Donofrio, F., Iannuzzi, A.P. and Dell’Atti, V., 2022. The integration of sustainability in corporate governance systems: an innovative framework applied to the European systematically important banks. International Journal of Disclosure and Governance, pp.1-15. https://link.springer.com/article/10.1057/s41310-021-00140-2
Easton, P.D., McAnally, M.L., Sommers, G.A. and Zhang, X.J., 2018. Financial statement analysis & valuation. Boston, MA: Cambridge Business Publishers. https://www.fau.edu/graduate/faculty-and-staff/programs-committee/docs/02202019/NCP-ACG5176.pdf
Javaherizadeh, E. 2021. An empirical study on the impact of female leaders and intellectual capital on the financial performance of FTSE 350 companies (Doctoral dissertation, University of West London).http://repository.uwl.ac.uk/id/eprint/8511/
Joshi, N., Gabhane, D., Devi, B. P., & Somashekhar, I. C. 2021. How social media marketing is helping in customer retention and customer engagement: A case of Marks and Spencer. SPAST Abstracts, 1(01).https://spast.org/techrep/article/view/3561
Ramzan, M., Amin, M., & Abbas, M. 2021. How does corporate social responsibility affect financial performance, financial stability, and financial inclusion in the banking sector? Evidence from Pakistan. Research in International Business and Finance, 55, 101314.https://www.sciencedirect.com/science/article/pii/S0275531919301199
Schleper, M. C., Gold, S., Trautrims, A., & Baldock, D. 2021. Pandemic-induced knowledge gaps in operations and supply chain management: COVID-19’s impacts on retailing. International Journal of Operations & Production Management.https://www.emerald.com/insight/content/doi/10.1108/IJOPM-12-2020-0837/full/html?utm_source=rss&utm_medium=feed&utm_campaign=rss_journalLatest
Zopounidis, C., Garefalakis, A., Lemonakis, C. and Passas, I., 2020. Environmental, social and corporate governance framework for corporate disclosure: a multicriteria dimension analysis approach. Management Decision. https://www.researchgate.net/profile/Alexandros-Garefalakis/publication/346060596_Environmental_social_and_corporate_governance_framework_for_corporate_disclosure_a_multicriteria_dimension_analysis_approach/links/5fbb452d299bf104cf6cf32e/Environmental-social-and-corporate-governance-framework-for-corporate-disclosure-a-multicriteria-dimension-analysis-approach.pdf
Assignment
FINC20023 International Financial Management Assignment Sample
Question and Answer for assignment help
Suppose you are advising an Australian MNE. The company wishes to purchase a device that costs ¥ .
The company is planning to finance this investment in either of the two ways:
Choice 1
Borrow ¥ from a Japanese bank at an interest rate of p.a. for one-year to purchase the device. At the time of repaying the loan, the company will need some Australian dollar cash outlay to convert to the required Japanese yen repayment inclusive of interest.
Choice 2
Borrow A$ from an Australian bank at an interest rate of p.a. for one-year, and then convert the Australian dollar to Japanese yen at the current cross rate of ¥100.00/A$ to purchase the device.
Thus, at the time of repaying this loan also, the company will need some Australian dollar cash outlay.
Assume, the inflation rate in Australia and Japan are, respectively, and 0.95%, and the purchasing power parity (PPP) holds.
i. Which loan option will you advise the company to choose if the choice is solely based on the required Australian dollar cash outlay after 1 year?
ii. What other factors do you think the company will also need to consider concerning this financing decision?
Solution
Answer 1:
The Australian MNE is Planning to buy a device that costs ‘X’ Yens. There are two choices for the Australian MNE. As per the first choice, the company can borrow yen from a Japanese bank at interest. At the time of repayment, the company will need some Australian Dollar cash outlay to convert the Japanese Yen repayment amount along with interest. Hence in this cash outlay, there will be an inflation effect. Hence for conversion also, more Australian dollars will be needed since the conversion will be at the end of year 1.
However, in choice 2, the company shall borrow the dollars from an Australian bank at the current date, and convert the same into yen at the current cross rate and then buy the machine. Here we see that the local inflation shall hold well only since the yen was borrowed at the beginning and hence there is a fixed amount including the interest to be repaid to the Australian bank. The YEN payment is already done at the beginning of the year. Hence, going by the situation, we infer the following with regards to:
Option 1:
The double effect of inflation- since first borrows yen from a Japanese bank, and repay at the end of the year. Due to Japanese inflation, cash outlay will be extra. Also, the company will have to face local inflation and hence, there will be more cash outlay (Marsh 2013).
Option 2:
Single effect of inflation- borrows Australian dollars at interest now, convert into yen and purchase the machine now. There will not be any effect of Japanese inflation. Hence, the cash outlay will be less.
Solely based on the outflow of Australian dollars at the end of year 1, it is advisable to go for option 2 of loan procurement.
Answer 2:
Since there is limited information in the given case, we are trying to judge the situation as per the conditions mentioned in the case.
The given crossover currency rate is yen 100/A$ where A$ stands for Australian Dollar. Since the inflation rate is 0.95% for Yen, it can be assumed that at the end of the year, the rate will be Yen 95/A$. Since there is purchasing power parity, the inflation will be proportional to their exchange rates. However, the interest rate for both Japanese banks as well as the Australian bank has to be considered to ensure which option is best suited. Since purchasing power parity holds well, one certain thing is that the cost of the device, whether purchased in Australia or from Japan, the cost will be similar in net values. Therefore, the cost of the device in either country is not a matter of concern.
What is to be a matter of concern here is the inflation effect on the choice of finance which the company opts for, which has been already discussed in the previous answer. But, the interest rates may vary and that is something we must watch out for since that is a major effect in taking the financing decision (Gunn 2013). Since in choice 2, interest cost is saved, we can consider that to be the most effective cost decision since interest cost will be saved.
References
Gunn, N. (2013). PART 08: Investment planning - chapter 8.4: Risk profiling. London: Kogan Page Ltd. Retrieved from https://search.proquest.com/books/part-08-investment-planning-chapter-8-4-risk/docview/1810512948/se-2?accountid=30552
Marsh, C. (2013). Chapter 01: Stages In The Development Of A Business And Financial Model. London: Kogan Page Ltd. Retrieved from https://search.proquest.com/books/chapter-01-stages-development-business-financial/docview/1810265107/se-2?accountid=30552
Coursework
Finance Coursework Assignment Sample
Important note: Coursework is marked on the understanding that it is the student’s own work on the module and that it has not, in whole or part, been presented elsewhere for assessment. Where material has been used from other sources, this must be properly acknowledged in accordance with the University’s Regulations regarding Academic Misconduct.
COMPANY ANALYSIS - (100% OF OVERALL COURSE GRADE)
A company of interest must be chosen, relevant company-level data collected from Orbis, an analysis made by using quantitative (with Microsoft Excel) and qualitative techniques, interpret the results and discuss these with reference to economic concepts and theories covered in the course, and in relation to recent business and financial economic events that have affected the company you have chosen. In-text references should be included throughout the coursework, and, at the end of your coursework, a bibliography section with full references must be presented. Both in-text and full references must follow the Harvard Referencing Style as per University referencing guidelines.
Company Analysis
The goal of this assessment is to look at the different specified financial aspects related to a UK firm you have chosen, and which should be listed on the London Stock Exchange (LSE). Most of the firms listed on the LSE operate both in the UK and abroad. Therefore, they are international in the way they operate their business. An understanding of the financial side of this firm is very important as stakeholders and potential investors constantly scrutinize listed firms in order to assess if management is running the business properly. To cover the main financial aspects of this firm you should address each part as indicated below by using articles, textbooks, databases and any other reliable source of information for assignment help.
Part 1 – (1,400 words). The goal of this part is to provide a summary of the company you have chosen. Resources you need for this task include: Textbooks, Orbis database, website Yahoo finance, company’s annual reports, and any other relevant resources you may find.
- Select a firm listed on the London Stock Exchange (you must use the Excel containing companies listed on the Board of the London Stock Exchange that I uploaded on Moodle, named ‘Companies on London Stock Exchange’ to find a firm you are interested in) and highlight any specific reasons for selecting this particular company.
- Look at the Annual reports of this firm and describe the company's activities;
- Find the revenues of this firm over the last 5 years (i.e. 2016-2020) and report these revenues in a table. Comment on whether revenues either increased or decreased.
Identify any relevant elements that could have had an impact on the firm’s revenue (i.e. either an external shock such as a financial crisis or an internal impact such as the mismanagement of the company).
- What sector does the company you have chosen belong to? Identify the sector and by using the database Orbis address the following points:
Who are the main competitors of the company you have chosen?
By looking at the revenues of your company as well as the revenues of its main competitors during the year 2020, identify the market share of your company as well as the market share of each of your company’s main competitors. Either tabulate the market share of each or put it a pie chart form. Comment on the market share of your company as well as the market shares of its main competitors.
- By using either the Orbis database or the internet website Yahoo finance compile a table where you report on the year-end stock price of your company from 2016 to 2020. Did management maximize the price of this common stock throughout this period? If this has not happened, try to find out the reasons for this (i.e. look atpossible external or internal factors).
- Has your chosen company made any long-term investment decisions over the last five years? (tips: look at the annual reports produced by your chosen company during years 2016, 2017, 2018, 2019, and 2020).
- Did your company generate revenue from foreign markets over the last five years? (Tips: look at the annual reports of the year, 2016, 2017, 2018, 2019, and 2020, and try to find the breakdown of revenue in terms of domestic and foreign markets) Report your finding in a table and comment the trend of foreign revenues over the last five years.
- By using the Orbis database or other relevant sources of information, look at the composition of the Board of Directors in your firm of interest. Is there an equal distribution of gender of people on the Board? Is there any scientific evidence that gender has an effect on decisions made by Boards of Directors of public-listed companies? Address this last question by using 3-5 relevant academic articles.
Part 2 –The objective of this part is to identify how well your company did financially over the last five years (i.e., 2016, 2017, 2018, 2019, and 2020). Resources you need for this task include: Textbooks, Orbis database, Yahoo finance website, the company’s annual reports and any other resources you may find. In particular you should address the following points:
- Look at the Balance sheet of your firm and report in separate tables the following information:
Current and Fixed assets over the last five years (i.e. 2016, 2017, 2018, 2019, and 2020) and write a short comment related to their trend. Look at the annual report of your company for the last year of your analysis looking for keywords such as ‘current assets’ and ‘fixed assets’. What do you learn about the company from its annual report in relation to the two afore mentioned aspects (i.e. current assets and fixed assets)?
Non-current liabilities and current liabilities over the last five years (i.e. 2016, 2017, 2018, 2019, and 2020) and write a short comment related to their trends. Look at the annual report of your company for the last year of your analysis looking for keywords such as ‘non-current liabilities’ and ‘current liabilities’. What do you learn about the company from its annual report in relation to the two afore mentioned terms?
Working capital over the last five years (i.e. 2016, 2017, 2018, 2019, and 2020) and write a short comment related to their trends. Look at the annual report of your company for the last year of your analysis looking for keywords such as ‘working capital’. What do you learn about the company from its annual report in relation to this item?
Calculate the debt-to-asset ratio of your company over the last five years (i.e. 2016, 2017, 2018, 2019, and 2020) and comment on the extent to which your company’s total assets have been financed with debt and write a short comment related to its trend. Look at the annual report of your company for the last year of your analysis looking for keywords such as ‘debt-ratio’. What do you learn about the company from its annual report in relation to this term?
Calculate the working capital turnover ratio of your company over the last five years (i.e. 2016, 2017, 2018, 2019, and 2020) and comment on the extent to which your company has efficiently used its working capital to generate revenues and write a short comment related to its trend. Look at the annual report of your company for the last year of your analysis looking for keywords such as ‘working capital turnover ratio’. What do you learn about the company from its annual report in relation to this term?
Calculate the return on equity (i.e. ROE) of your company over the last five years (i.e. 2016, 2017, 2018, 2019, and 2020) and comment on the extent to which your company has been profitable in using its owners capital and write a short comment related to its trend. Look at the annual report of your company for the last year of your analysis looking for keywords such as ‘ROE’. What do you learn about the company from its annual report in relation to this term?
- Look at the profit and loss account of your firm and report the following information in separate tables:
Operating revenue, costs of goods sold and gross profits over the last five years (i.e. 2016, 2017, 2018, 2019 and 2020) and write a short comment related to the trend for each of those aspects. Look at the annual report of your company for the last year of your analysis looking for keyword such as ‘Operating revenue’, ‘costs of goods sold’, and ‘gross profits’. What do you learn about the company from its annual report in relation to these terms?
Net Profit over the last five years (i.e. 2016, 2017, 2018, 2019 and 2020) and write a short comment related to the trend of this item. Look at the annual report of your company for the last year of your analysis looking for keywords such as ‘Net Profit’. What do you learn about the company from its annual report in relation to this term?
Calculate the Net Profit Margin ratio of your company over the last five years (i.e. 2016, 2017, 2018, 2019, and 2020) and comment on the extent to which your company’s revenues have generated profits and write a short comment related to this trend. Look at the annual report of your company for the last year of your analysis looking for keywords such as ‘Net Profit Margin’. What do you learn about the company from its annual report in relation to this term?
Part 3 – (200 words)
- Describe how you went about selecting a specific company, collecting and analyzing relevant data. Giving your own personal assessment as to how effectively you went about completing this task. Please note that in evaluating the coursework, attention will be placed on your ability to incorporate finance and business concepts and theories covered in class in the various parts of the assessment. The use of appropriate financial and business terminology, the ability to clearly and concisely explain these aspects and the use of referencing (according to Harvard referencing style) will also form part of the evaluation, as well as your ability to stay within the topic parameters and exhaustively answer the question within the set word limits. Note that tables, figures, and references are not included in the word count. In preparing your assignment, you must follow the order of tasks as listed in Part 1, Part 2, and Part 3. Do not include in any Part, answers that are related to other parts as this will make your assignment less readworthy and create confusion. You must include a Word Count at the end of your coursework (Tables, Graphs/Figures, and Bibliography section does not count towards the overall word count). Make sure each Table / Graph you provide in your coursework has a progressive number and a title. Finally, you must write your coursework using Microsoft Word editor, whereas for Graphs you are advised to use Microsoft Excel. You cannot provide handwritten answers that are scanned, these will not be accepted. Please do not copy and paste images / graphs from annual reports.
Important note: Coursework is marked on the understanding that it is the student’s own work on the module and that it has not, in whole or part, been presented elsewhere for assessment. Where material has been used from other sources, this must be properly acknowledged in accordance with the University’s Regulations regarding Academic Misconduct.
Solution
Introduction
Financial assessment is one of the significant concepts in the current environment that directly linked with the performance evaluation of the firm. With the help of the financial; assessment, current stability and working capital management of an organization can be identify more effectively. Purpose of this assignment is to measure the financial performance of a LSE listed UK based company for over 5 years in order to determine the financial performance trends. This report has divided in three parts where in first part a summary of the selected company has been described. In the second part, financial performance trends for five years have been recognized and third part discuss about selection process of company data.
Part 1: Summarization of the selected organization
Organizational background
Barclays Plc has been taken under consideration in this report as the sleeted organization to analyses the financial performance of the company over last five years. Current stability of the business and operational efficiency of the firm can be evaluated through the financial assessment of Barclays Plc more significantly. Barclays Plc has been selected in this report because it is a LSE listed company and comes under the FTSE 100 components (Home.barclays, 2021). Additionally, the company operates internationally which provide an upper hand to select this organization to measure the financial trends. During the Covid19, financial effect can be seen in the operational process of the financial institution. Because Barclays a financial institution, it is effective to determine the current financial trends of the business more effectively. Due to this reason, Barclays Plc has been selected for the financial analyses in this report.
Barclays Plc is a UK based multinational bank that operates as two divisions such as Barclays International and Barclays UK. It is one of the oldest banks in the UK which was established in 1690 and headquarter situated in London, UK. Service range of the business are including retail banking, commercial banking, investment banking, wealth management, financial service, private banking and wholesale banking (Home.barclays, 2021). As per the annual report of 2021, current numbers of employee in the organizational operation is 83500. It is a public limited company that operates in financial service and banking industries.
Organizational activity
Barclays Plc currently linked with different business units and activity which directly impact on the performance parameter of the business. According to the report of the 2011, Barclays was the most powerful transactional corporation from the perspective of the ownership that directly impact on the financial stability of the business. Barclays has different business division which actively worked in international financial market and banking sector. Barclays UK, Barclays Corporate bank, Barclay’s payment, Barclays Private bank, Barclays US consumer Bank and Barclays Investment bank are the major division that operates by the group of the company (Home.barclays, 2020). The company has seven activity units in the operational process that assist in the growth of the business operation. As per the annual report 2020, Barclays established with one business unit as corporate bank in 1690. Hence, in the current environment, the company used to increase its numbers of activity unit and enhanced the profitability. Current activity units of Barclays are including Retail Banking Activity, Corporate banking Activity, Insurance banking Activity, Investment banking Activity, Wealth management, Wholesale banking Activity and Financial Service activity. The company used to generate highest percentage of revenue from the Investment banking Activity where Wholesale banking activity unit provides lower revenue consultation in the organizational operation.
Revenue trends over five years
Performance of the highly depends on the revenue generating capability of the business in the current environment. Considering the financial assessment it can be identified that Total income of the business has increased over the year for Barclays Plc. In the following section, a table has been made in order to show the trends of the revenue for Barclays Plc over last five years.
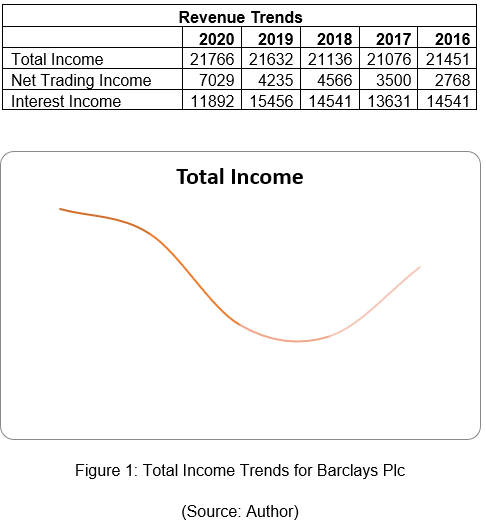
Considering the financial trends of the business revenue, it is identified that the revenue of Barclays has increased in last four years due to increase in trading income (Home.barclays, 2017). Higher growth in the financial market over last five years has positively impact on the trading income of Barclays Plc which has directly effect on the profitability of the business. However, reduction in the interest rate in the UK market has negatively impact on the total income of the business which reduces the growth of the revenue for Barclays.
Sector and competitive analyses
Barclays Plc belongs to Banking and financial service sector in the current environment. The company provides banking and financial services to the consumer of the UK and international market. The company used to provides investment opportunity to entrepreneurs and assist them to develop their business more effectively. In the financial performance analyses, competitive environment analyses are important that allow recognizing the current performance trends of the firm more effectively. Key competitors of Barclays Plc are including HSBC bank, National Westminster bank and Deutsche bank.
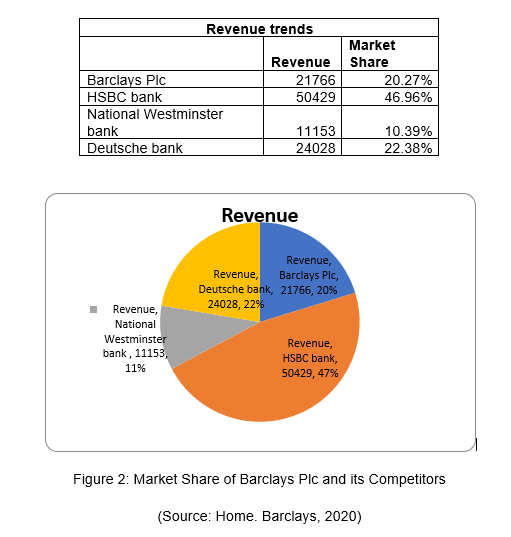
Considering the revenue generation in 2020, it can be identified that Barclays Plc posses 20% of the market share from the perspective of the revenue. On the other hand, following the revenue, it is identified that HSBC Bank possesses highest numbers of market share in the current environment from the perspective of revenue with 47% of market share (Orbis, 2021). Other competitors of Barclays Plc are including Deutsche Bank have 22% of market share and National Westminster bank have 11% of market share in the current environment (Home.barclays, 2020). This data indicates that market base is higher for the HSBC bank in the current banking industry where it is lower for National Westminster bank in banking sector. Based on the data, it can also stated that Barclays Plc current holds a good position in the banking industry from the perspective of revenue to enhanced its profitability and grow in future.
Stock price management
Historical data for Barclays Plc has been used in this section in order to determine the year end stock price for the business over last five years. Growth of the share price can be evaluate through the identification of the historical share price for the Barclay Plc. Following table has been used to show the closing price of share for each year over last five years for Barclay Plc.
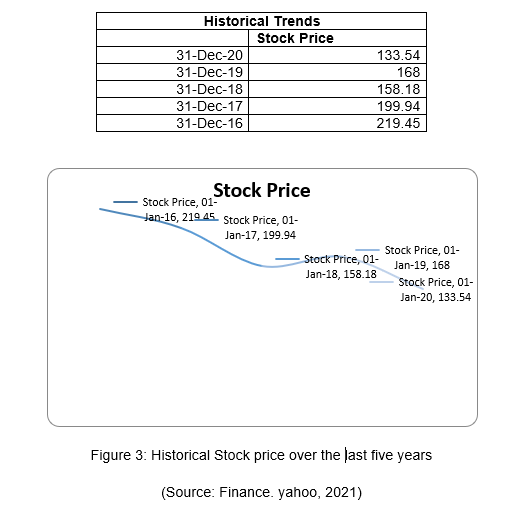
Considering the data it can be identified that there has reducing trends in the historical stock price for Barclay Plc in the current environment. It is identified that the stock price of the share was 219.45 in December 2016 and reduced to 133.54 in December 2020. Here, continues reduction in the share price can be identified for Barclays Plc in the current environment (Finance.yahoo, 2021). Changes in the interest rates and management strategy towards the activity reduction can be the reason behind this decrease. Covid19 has massively impact on the economic stability of the country and reduce the GDP rate of the UK. Due to government fiscal policy and unstable economic situation, share price has reduced dramatically in 2020 compared to 2019.
The company has taken the long term investment decision in 2020 for the sustainable development strategy. As the long term investment decision, the company used to make a vision for net zero bank within 2050 and align with the franchise activity to meet the goal of Paris Climate Agreement (Home.barclays, 2020). The company also strategy to tacking the climate changes through the acceleration of the changes in low carbon economy.
Barclays used to operate in the foreign market which makes it Multination Corporation. The company has generated large volume of revenue from the foreign market. Considering the annual report of the business, it is identified that the company generate 31.71% of the total revenue from the domestic market in 2020 (Home.barclays, 2020). This data indicates that the company generates large volume of revenue from foreign market.
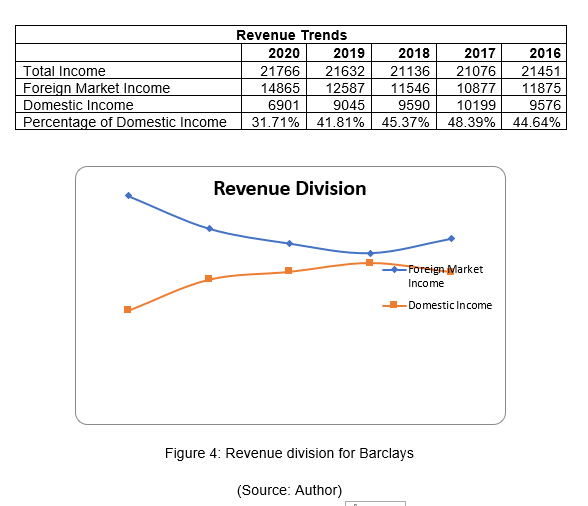
Considering the trends analyses, it is identified that there has an increasing trends for foreign revenue. The company able to increased its foreign revenue in the business operation over last five years.
Composition of Board of director
Considering Board Composition of the annual report of Barclays Plc, it is identified that numbers of non-executive director is 9, Chairman is 1 and Executive director is 2. Following the gender balance it is seen that Numbers of male director is 9 and Female director is 3. Here, 3:1 ratio can be seen in the gender distribution on the board of director for Barclays Plc in 2020 (Home.barclays, 2020). According to Abad et al. (2017), gender has no impact on the decision making process in board of director of public listed company that the decision making skills are same for both gender. Argue with the above statement, Martinez-Jimenez et al. (2020) stated that Leadership capability and critical thinking perspective is higher among the male director than female director which allow to get effective judgment in the decision making process. In accordance with the above statement, Nielsen and Huse (2010) told that board decision making depends on the professional experience rather than gender diversity.
Part 2: Financial performance for the company over last five years
Current assets and fixed assets
Current assets and fixed assets are the two different elements of total assets for an organization. Current assets consider as the short term assets that the company planned to sold within 1 years of period (Rafay et al. 2019). Fixed assets are considered as the long term assets that the company purchased for the production and service operation.
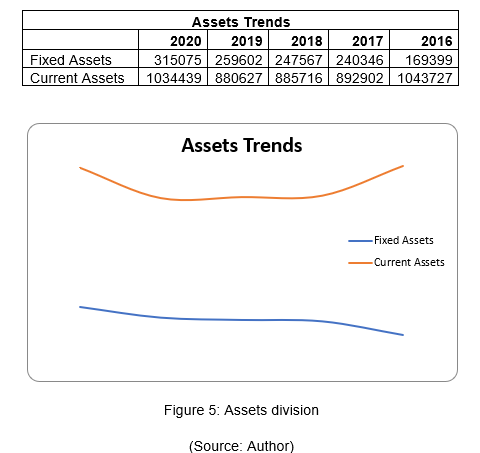
Based on the assets trends it can be identified that total assets of Barclays Plc have increased in 2020 compared to 2019 due to additional investment. Trend analyses shows that current assets of the company have increased effectively in 2020 compared to 2019 and 2018. On the other hand, fixed assets of the company have increased in 2020 compared to 2019 and 2018 for Barclays Plc. As it is a banking corporation, current assets are higher than the fixed assets of the business. This data indicates towards the large volume of regular transaction for the firm.
Total liability of an organization can be identified through the identification of the non-current liability value and current liability value (Laurens and Tampang, 2018). Current liability defines as the debt of the business that the company must pay within one year time period. On the other hand, non-current liability define as the long term liability that the company taken for the benefit of the business.
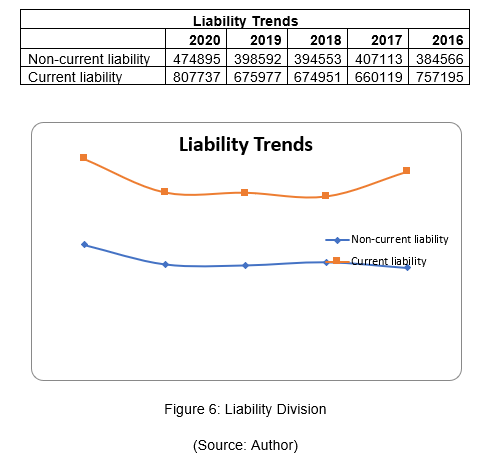
Based on the financial trends analyses it is identified that current liability of Barclays Plc has increased in 2020 compared to 2019 and 2018. On the other hand, Non-current liability of the business has increased over last five years for the business. Trend analyses showed that non-current liability of the company has increased due to increase in customers’ accounts in the business operation.
Working capital trends
Working capital management is necessary for the business in order to improve the overall operational efficiency of the firm more effectively (Boisjoly et al. 2020). Working capital management directly indicates towards the financial stability of the business in the current environment. In order to detect the working capital of an organization, it is necessary to deduct the current liability from the current assets of the business. Working capital trends for Barclays Plc has been identified in the following section of the report.
Working capital = Current Assets – Current liability
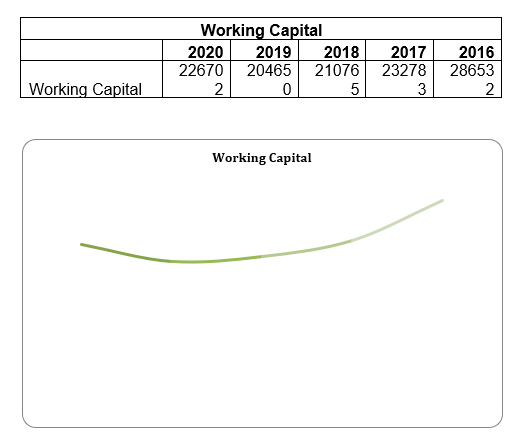
Figure 7: Working Capital Trends for Barclays Plc
(Source: Author)
Based on the above trend analyses, it is identified that working capital of the company has reduced in 2020 compared to 2016. Reducing trends can be seen in the working capital management of the business which indicates that current liability of the business has increased compared to current assets of the business over last five years. This data also indicates that the company reduced its cash conversion cycle over last five years in the business operation.
Calculation of debt to assets ratio
Debt to assets ratio is the financial assessment that assists to determine the financial risk in the business operation. Debt to assets ratio can be used to measure the use of the company’s assets that are financed by the debt rather than the equity of the business (McLaney and Atrill, 2016). In order to calculate the debt to assets ratio, it is necessary to divide the total assets from the long term debt of the business.
Debt to assets ratio = Long term debt / Total Assets
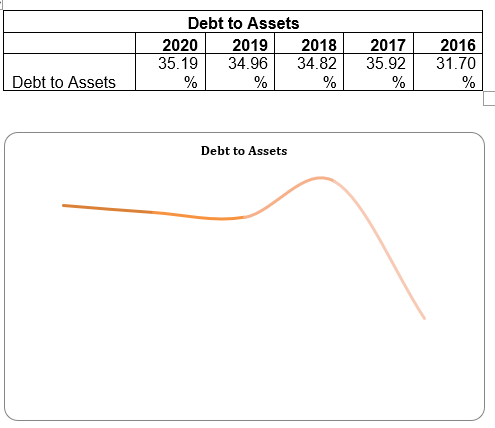
Figure 8: Debt to Assets ratio
(Source: Author)
Based on the above calculation it is identified that debt to assets ratio has increased for Barclays over last 5 years. This data indicates towards the increasing trends in the current environment. Increase in debt to assets ratio indicates that the company able to increase the investment in the assets through utilizing the debt in the current environment. Higher financial risk can be seen in this operation for the Barclays Plc.
Working capital turnover ratio
Working capital turnover ratio defines as the financial performance measurement that identifies the capability of the company to utilize its working capital for sales growth (Kalaivani and Jothi, 2017). Working capital management for the development of sales revenue can be identifying through the measure of the working capital turnover ratio for Barclays Plc.
Working capital turnover ratio = sales / Working capital
As the Barclays Plc is the service based organization, total income of the business operation consider as the sales revenue for the business over five years.
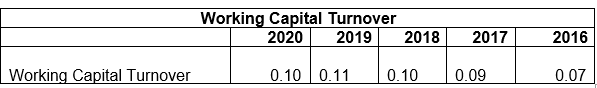
Based on the above table it is seen that working capital turnover for Barclays has increased in 2020 compared to 2016. This data indicates that the company has good working capital management to support the growth of the revenue over last five years.
Return on Equity
Return on equity (ROE) is the financial performance measurement that assists to determine the profitability of the firm in relation with the equity of the business (Amelia and Sunarsi, 2020). ROE has been used by the investors to determine the financial health of the business from the investment perspective.
Return on equity = Net Income / Shareholders Equity
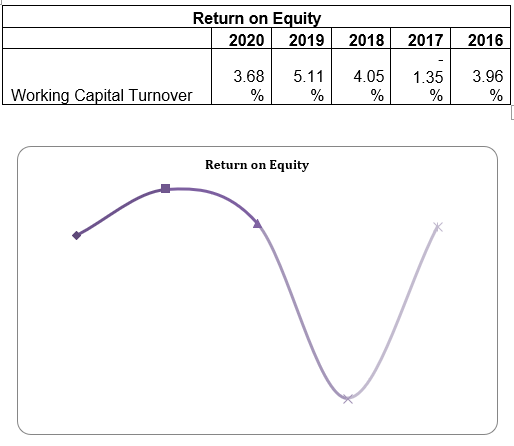
Figure 9: Return on Equity
(Source: Author)
Following the trend analyses of ROE it can be identified that ROE of the company has improved in 2020 compared to 2016. Due to Covid19, ROE of the company has reduced in 2020 compared to 2019 which indicates towards the ineffective investor’s interest towards the business.
Operating revenue and Gross profit
Operating revenue define as the revenue that an organization generate from the primary activity of the firm (Jati, 2021). Cost of goods sold is the measurement of cost of the product or services that the business sold. Gross profit is the valuation of primary profit from the business operation after deducting cost of goods sold from revenue of the business.
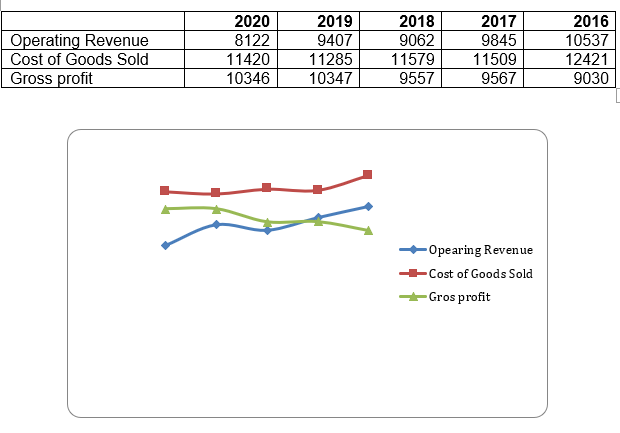
Figure 10: Trends in Gross profit
(Source: Author)
Based on the income statement of Barclays Plc it is seen that that has reducing trends for operating income and COGS. Hence, the increasing trends are there for Gross profit of the business which indicates that the company able to improve its primary profitability more effectively.
Net profit trends
Net profits define as the financial measurement that used to identify the net income of the business operation.
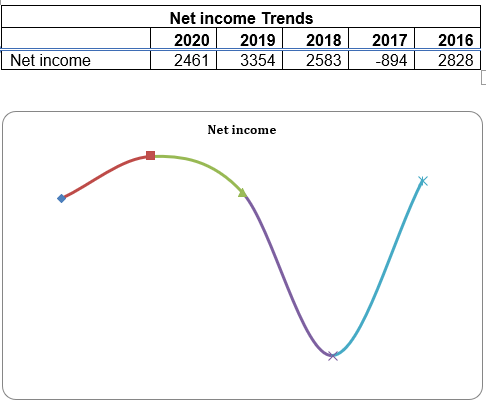
Figure 11: Net income Trends
(Source: Author)
Above graph indicates that positive trends can be seen in the net profitability of the business. In 2017, the company had faced a los due to lack of strategic development (Orbis, 2021).
Net profit margin ratio
Net profit margin ratio is the profitability ratio used to identify the percentage of profitability on the total sales of the business.
Net profit margin = Net profit / Total sales
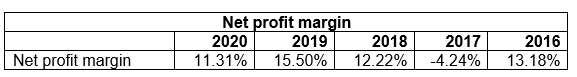
A reducing trend is there in the net profit margin of Barclays Plc in 2020. It is estimated that Covid19 has negatively impact on the net profit margin of the company in 2020.
Part 3: Selection and collection of company data
In order to complete the task, I have selected the organization from the website which listed the entire LSE listed corporation. Barclays Plc has been selected due to its financial growth and market value in the current environment. In order to collect the financial information of Barclays Plc, Yahoo Finance and annual report of the company used for last five years. I have collected data regarding Barclays Plc from the annual report of the company for last five years. Total value of assets, liability, and equity and income statement has been used to collect the relevant data regarding the company. Orbis websites has also used for the competitive analyses of the company. In order to collect information related to literature, relevant journal articles and text books has been used in this report more appropriately. Financial trend analyses for Barclays Plc have been replicated through using ratio analyses methods in this report more significantly. In order to analyzed the data, excel sheet has been used that assist to present the trends in graphical way.
Reference
Abad, D., Lucas-Pérez, M.E., Minguez-Vera, A. and Yagüe, J., 2017. Does gender diversity on corporate boards reduce information asymmetry in equity markets?. BRQ Business Research Quarterly, 20(3), pp.192-205. https://journals.sagepub.com/doi/pdf/10.1016/j.brq.2017.04.001
Amelia, R.W. and Sunarsi, D., 2020. Pengaruh Return On Asset Dan Return On Equity Terhadap Debt To Equity Ratio Pada PT. Kalbe Farma, TBK. Ad-Deenar: Jurnal Ekonomi dan Bisnis Islam, 4(01), pp.105-114. https://jurnal.staialhidayahbogor.ac.id/index.php/ad/article/download/738/523
Boisjoly, R.P., Conine Jr, T.E. and McDonald IV, M.B., 2020. Working capital management: Financial and valuation impacts. Journal of Business Research, 108, pp.1-8. https://e-tarjome.com/storage/panel/fileuploads/2019-12-09/1575883858_gh42.pdf
Finance.yahoo, 2021. Barclays PLC (BARC.L). [online] Finance.yahoo.com. Available at: https://finance.yahoo.com/quote/BARC.L/history?p=BARC.L [Accessed 29 December 2021].
Home.barclays, 2017. Annual Report 2017. [online] Home.barclays. Available at: https://home.barclays/content/dam/home-barclays/documents/investor-relations/reports-and-events/annual-reports/2017/Barclays-PLC-Annual-Report-2017.pdf [Accessed 29 December 2021].
Home.barclays, 2020. Annual Report 2020. [online] Home.barclays. Available at: https://home.barclays/content/dam/home-barclays/documents/investor-relations/reports-and-events/annual-reports/2020/Barclays-PLC-Annual-Report-2020.pdf [Accessed 29 December 2021].
Home.barclays, 2021. Barclays Our Story and History | Barclays. [online] Home.barclays. Available at: https://home.barclays/who-we-are/our-history/ [Accessed 29 December 2021].
Jati, W., 2021. Influence of Operational Costs on Operating Revenue and Loan to Deposit Ratio against Return on Asset at PT. Bank Negara Indonesia, Tbk Year 2009-2019. Kontigensi: Jurnal Ilmiah Manajemen, 9(1), pp.1-9. https://jurnal.dim-unpas.web.id/index.php/JIMK/article/download/88/131
Kalaivani, P. and Jothi, K., 2017. Impact of working capital management on profitability of the select car manufacturing companies in India. International Journal of Pure and Applied Mathematics, 116(24), pp.13-21. http://www.acadpubl.eu/jsi/2017-116-23-24/articles/24/2.pdf
Laurens, R. and Tampang, Y., 2018. Long-Term Liabilities. Available at SSRN 3210082. https://papers.ssrn.com/sol3/papers.cfm?abstract_id=3210082
Martinez-Jimenez, R., Hernández-Ortiz, M.J. and Fernández, A.I.C., 2020. Gender diversity influence on board effectiveness and business performance. Corporate Governance: The international journal of business in society. https://www.semanticscholar.org/paper/Gender-diversity-influence-on-board-effectiveness-Mart%C3%ADnez-Jim%C3%A9nez-Hern%C3%A1ndez-Ortiz/4d7412b4b67684d98f6d6f52158787d9c47792f9
McLaney, E. and Atrill, P., 2016. Accounting and finance: an introduction. Prentice Hill. http://103.227.140.9/handle/123456789/15358
Nielsen, S. and Huse, M., 2010. Women directors' contribution to board decision?making and strategic involvement: The role of equality perception. European Management Review, 7(1), pp.16-29. https://womanforward.org/wp-content/uploads/2020/06/Women-directors-contribution-to-board.pdf
Orbis, 2021. Orbis | Compare Private Company Data | Bureau van Dijk. [online] bvd. Available at: https://www.bvdinfo.com/en-gb/our-products/data/international/orbis [Accessed 30 December 2021].
Rafay, A., Yasser, F. and Khalid, Z., 2019. Revaluation of non-current assets under IAS-16: possibility of any managerial inducement: evidence from a South Asian economy. Rafay, A., Yasser, F., & Khalid, (2019), pp.93-105. https://www.researchgate.net/profile/Abdul-Rafay-3/publication/348680681_Revaluation_of_Non-Current_Assets_under_IAS-16_Possibility_of_any_Managerial_inducement_-_Evidence_from_a_South_Asian_Economy/links/6034bba3a6fdcc37a846881f/Revaluation-of-Non-Current-Assets-under-IAS-16-Possibility-of-any-Managerial-inducement-Evidence-from-a-South-Asian-Economy.pdf
Case Study
SBM1203 Business Finance Assignment Sample
Assessment Brief
Due date: Week 11
Group/individual: Individual
Word count/Time provided: 2500 to 3000 words
Weighting: 30%
Unit Learning Outcomes: ULO1; ULO2; ULO3; ULO4
Assessment 3 Detail
Context
As an project manager you will need funding to complete your project/venture. A corporate decisionhas been made that all funding is internal. You may, however, argue that alternate sources may beappropriate (i.e. banks, angel investors, micro-finance organisations, crowd funding, etc.).You will need to present you rideasin a succinct, coherent and persuasive report, to assess the viabilityof your project. This assessment simulates this professional practice, where you present the key analysis to persuade your potential key stakeholders to invest in your project in a safe environment.
You should consider the following and write case study for me .
• Identify the stakeholders you are presenting to in this assessment. In this case assume that the lecturer is the manager of the company.
• Introduce the project idea. Include what the idea is and why it matters to the business. You are free to make any assumptions about the business as needed – provided they are logical.
• Provide details of your financial analysis and assessment of the project viability. Ensure that you consider the key risks and the results of sensitivity analyses.
• Close the deal. Why should the manager approve the project. Be persuasive.
Solution
Introduction
A business organization needs to have certain funds to complete their projects and also to achieve organisational success. Hence the first duty of the board management is to fix the goal of their organisation. After fixing their goal they have to create the financial budget to complete the goal. If they can create the budget for their organisation, then they can understand how much funds be needed to assess the scale of operation. After fixing the quantity of fund needed to finance the project, they have to choose the right sources through which they can collect all the amount. There are two different sources the internal and external sources. Both the sources have their different advantages and disadvantages. Hence, they have to fix their source of funds practically that will reduce the level of risk.
In this particular case, the management has decided to introduce a project venture through which they will utilise flower wastage and will produce lather from it. The business idea indicates that there will be diverse stakeholder group starting from supplier of flower wastage, logistic department, who will collect those wastages and will bring to the production centre, the labours working at the production centre as well as the management itself. Hence, a succinct stakeholder management plan is also essential. This study will provide detailed stakeholder management plan, the financial aspect of this project that includes source of funds, viability of the project etc.
Stakeholders Analysis
The stakeholders are those who have a large interest in the organisation and who have affected or be affected by the organization’s operation and performance. There are two types of stakeholders in any company, which are internal and external. The internal stakeholders directly related to the company’s performance and operation the example of these are, employees, management, investors or owners of the company. Since, the project is to produce leather from flower wastage, the role of internal stakeholder, specially the logistic and supply chain management people are key to attain the success. This specific stakeholder group needs to work efficiently to maintain the flow of flower wastage. The external stakeholders are those who have less affected by the business operation, such as the Government, regulatory authority, customers and suppliers of the company. Here, the project required permission from regulatory authority as they business will utilise wastages and will produce leather from it. For successfully running a business for a longer period any company must understand its stakeholders. As the stakeholders of the company indirectly played a significant role in the business decision. The main problem arises in the stakeholders is that company has various stakeholders and the interest of each stakeholder are different. Hence,sometimes it is not possible to meet all stakeholder’s interests at a time (Bottenberg, Tuschke&Flickinger, 2017). As an example, this difference can be understood. The primary goal of the company to profit maximisation to increase the value of its shareholders. Therefore, it controls its costs including employee’s salaries and wages of the workers. Moreover, the interest of these two stakeholders is to earn more from the company. Here, the interest of the employees and workers directly conflicts with the investor's interests. This type of issue in the company is very common but the efficient management of the companies can manage all the interests of all stakeholders (Heikkinen, 2017).
All through the word, stakeholders and shareholders seem similar but there are large differences that shareholders are also stakeholders of the company. The interest of shareholder sislimited they have only financialinterests whereas the stakeholders have vested inters in the company for a long period (Schneider & Sachs, 2017).
External sources of capital
Similar to the internal sources of capital there are several sources through which a company can maintain their capital. In the case of an external source, a company must have to take high risk as the capital needs to pay a higher amount of interest. Rhus. It is too much risky. However, there are several advantages also available of this source. Hence before fixing the right sources of capital, they have to understand the level of risk.
Family and friends
A business organisation can get their required amount of capital from their family and friends. This type of loan is generally taken based on vocal consideration and sometimes in a written measure. The amount of loan must be given back to the party after some time. Hence the percentage of risk in this type of loan is zero.
Overdrafts
This is also a type of external source of capital through which a business organisation gets their loan amount or the amount of capital. Here the person can take the amount of capital greater than the deposited amount. Here the company or the business houses must have to pay some interest to the excess amount of capital withdrawn from the bank (Belanova, 2018). This type of capital source has a little level of risk. Banks have charged a very less amount of interest for the overdrawn. Thus, it can be a reliable source.
Venture capital and the business angles
Venture capital is the source of capital. This type of capital is generally external. Different companies want to invest in different new companies and existing companies. They provide the loan based on the percentage of profit to be given to them at the end of the year. They used to keep an eye on the business component and the business prospects of the company where they have invested. This type of loan is also risky but the level of risk is comparatively low (Damanpour, Sanchez?Henriquez & Chiu, 2018).
Share issue
This is also a type of external source of capital. This type of capital can be earned by the company by selling some of the percentages of shares. The buyer if the share is generally getting some percentage of the ownership of the company. At the end of the year, the company must have to give some of the percentages of profits as dividend to those shareholders. This is the popular method of capital acquisition. Sometimes companies do not prefer this type of capital as they have the ownership of the company and also the voting right. Hence the companies like to use debenture capital as the preferred one. This type of loan holder has not any right of voting as they are not the owner of their company.
Issue of debenture
This is also a very popular source of capital. This is the long-term capital source. Here the company issues the legal stamp paper of the company that generally uses some of the assets as underlying for the sake of the registered and sealed paper of the company. Using this type of lean paper, they can get a higher amount of loan or capital for long-term use. The company has to pay some fixed rate of interest in the borrowed capital. This type of capital is too risky. As the owners, if the bondholder has the right to take the assets of the company if the company cannot pay the amount of interest on the debt capital. However, there is an advantage of using this type of capital, the amount of the interest taken as the expenses of the company. Therefore, the company get a deduction at the time of paying the tax to the government.
New partners
Supposed if an individual is trying to enter a business but they can face the risk of low capital. Here they can take any individual and any other company as a partner of their company. They are taken as a partner to the company for some percentage of the state and they also have to pay some amount of capital. They will agree on themselves to share the profit within them in an agreed percentage. All the responsibilities are also to be discussed at the time of joining any other persons in the partnership. This is also a very popular method for getting the amount of capital for a company (Vinczeova&Kascakova, 2017).
Leasing
It is also an external source of capital. Here the company can lease one of the other assets to a company or a party who needs the machine or the services very much. Here the company that has taken the services or the product must have to pay a semi-monthly instalment to the assets and services. This is how the company can maintain liquid capital.
Government grant
This is not that popular tool for capital sourcing. Governments generally give some amount of capital to the company for completing some of the criteria. This too if capital is not refundable and also the company does not have to pay any kind of interest. Instead, they have to fill the employment gap. If they can provide higher employment opportunities then the government can pay some of the capital as a subsidy. Thus, companies can avail this type of source by providing higher job opportunities to society (Anebo, 2019).
Hire purchase
This is also an external source of capital. This type of capital is the capital source. Here a company is thinking to purchase any machinery or equipment from a company then by paying some of the instalment the company can use the machinery or the equipment for business. However, at the time the company has paid their final instalment for the machinery, they will get the ownership of the machinery. Therefore, it is a kind of financial benefit that is given by the owner company to the purchasing company.
The internal funding for a company
The funding is the collection of money for capital. There are two types of funding available to any company one is internal funding another is external funding. Internal funding is the company’s seed money means the money that company-owned is called internal funding. Here the company needs to funding a project and now discussing if the internal funding will be worth it to the company or not. As the internal fund is raising within the firm hence the funds came from the net profit after adjusting the interest and taxes and the reserves that available to the company (Fikasari&Bernawati, 2021).
The advantages of internal funding
1. Allows full control to the project:
The internal financing is free from any repayment and time-bound of the project, therefore the management has full control over the project and they can set the strategy and set the time of completion of the project. This type of financing also free from any external tern ad condition of the financer.
2. It improves the process of planning:
Companies tend to be more concerned and careful when financing any project internally compare to external financing. The company used the excess profit in the project financing thatis assured of extra income than the current income amount. Therefore, t can say that internal financing is increasing the level of planning (Madra-Sawicka, 2018).
3. Decreases the cost of the projects:
The internal financing is free from the external borrowing cost such as the cost of the interest and the processing cost of borrowing. Therefore, the cost of the projects will be less than the externally funded projects.
4. Maintain capital structure and risk of financing:
The increasing debt in a company is a bad sign for its investors as the cost of the debt financing is effected the profit of the company and also affected the capital structure of the certain company. Too much debt on the balance sheet indicates the risk associated with the company in the long term if the debt is too high then it is considered as a high risk of financing. To maintain a stable market performance and ensures the interest of the shareholders the company needs to avoid external financing (He, Chen & Hu, 2019).
5. It limits the external influence:
Debt financing or external financing is influenced by macroeconomic factors such as inflation, exchange rate, interest rate and market risk. However, internal financing does not influence these. Therefore, it can say that internal funding limits the external influence.
The disadvantage s of the internal funding
Although there are several advantages of internal funding alongit, some disadvantage s also exist. The disadvantages of internal financing discussed below:
1. Low cash availability:
As the money is taken from the internal source of the company. Therefore, the company can see low cash within it. If the expense of the project is huge then the company can be out of cash and the financing affected the working capital of the company. Sometimes the internal financing affected the operation of the company (Bellavitis et al., 2017).
2. Required accurate estimation:
When the project is financing from the internal funds then the management needs to estimate the accurate cost of the projects as the cost is incurred from the company’s capital there for any excess cost in the future will impact the operation of the company. Any mistake in the estimation can harm the interest of the company (Baker, Kumar & Rao, 2020).
3. It requires control over the spending:
As this type of financing reduced the working capital of the company, hence the management needs more control over the spending of the company to avoid the out-of-cash situation and short-term insolvency. In addition, the company needs to control the spending of the project as these also impact the company’s operation (Mashayekh&Morshedi, 2020).
4. It takes more time to complete:
In this type of financing, the project has not any time-binding. The external sources of funding have time commitments involves and for avoiding the extra cost of interest they started as soon as possible but the internal source company has not faced any time issue that slowed the completion time of the project(De Massis etal., 2018).
Risk included in the funding
Whether the source of financing is internal or external the risk of funding is in both cases. The risk associated with the founding is major as it can dissolute the business. The main concern in the funding is the project completion. This means if the project will be completed or not that is not sure as the external factor matter. The risk of internal sourcing is mainly capital-related as it influences the cash flow and the working capital of the company also this funding affected the position of the company. On the other hand, external financing hasa larger risk as it is influenced by macroeconomic factors. Any changes in the economy impacted the project costing and also the cost of the funding. Therefore, the risk of uncertainty is associated with external sources of funding (St?Pierre &Lacoursière, 2017).
The debt financing from the project increases the risk of the company in the longer period as it changes the capital structure of the company. High debt in the capital structure means high interest or finance cost in the income statement which is decreased the income of the company. In the end, it can say that internal financing impacts the operation management of the company but external debt impact both operational management and in profit of the company (Goldstein & Kearney, 2020).
Evaluation of funding and judging the economic viability
The following table is showing the economic viability of the chosen project return that has undertaken by the company management. NPV (Net present Value) analysis is the capital budgeting tool that is generally used by the different business analyst to check the financial viability of any investment project (Setiawan&Fahrurrozi, 2017).
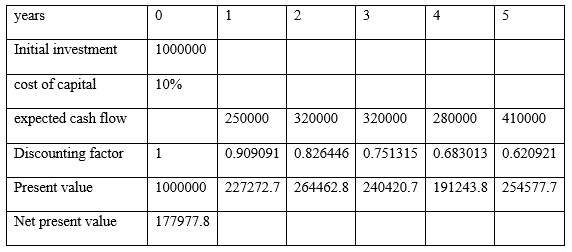
Here are some assumptions has taken. It is assumed that the company has an initial investment of 1000000 and they’re investing in the project for the next 5 years. This initial investment includes, purchase of machinery to produce leather from flower wastage, installation, site preparation etc. Also, the cost of capital is 10%. After the calculation of the NPV, it can be seen that the company has a net present value of 177977.8. As the initial investment is giving a positive net present value then it can be understood that the project investment will be done and the project will be accepted as per the economic viability.
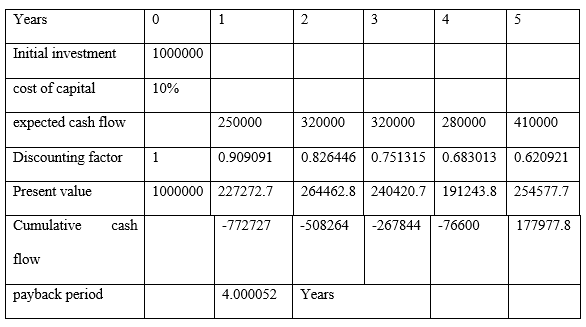
The payback period is also a capital budgeting that is used to find the viability of the return (Shaban, Al-Zubi& Abdallah, 2017). Keeping all the assumption the same as above, the value of the payback period is 4.000052 years, which is less than the life time of this project. Then it can be said that the project will be accepted.
Conclusion
From the above discussion and analysing here it can be concluded very easily the best financing sources for the projects. The project as discussed above has some benefits towards the society by removing flower wastage and converting it into leather which can be used any several ways. Not only has that the solution indicates that the project would be a financially beneficial project. Hence, the chosen project must be funded. The discussion on source of funding indicates that in this specific case, the internal financing option would be beneficial.From the advantages of internal financing, it is found that internal funding has more leverage in project financing than finance from external sources. Also, the risk of the financing represents that the external funding has a larger risk area as these are influenced by external factors such as inflation, interest and government policies. After critically analysing the advantages and disadvantages of internal-external resources of financing it can conclude that the internal sources of financing are the best option to choose.
Reference list
Anebo, L.N., (2019). Debenture as Alternate Scheme of Raising Investment Fund and Its Prospects under Ethiopian Company Law. Mizan Law Review, vol. 13 no. 3, pp.333-362.
Baker, H.K., Kumar, S. & Rao, P., (2020). Financing preferences and practices of Indian SMEs. Global finance journal, vol. 43, p.100388.
Belanova, K., (2018). AVAILABILITY OF EXTERNAL SOURCES OF FINANCE FOR SMALL AND MEDIUM-SIZED ENTERPRISES IN THE SLOVAK REPUBLIC. In 5th International Multidisciplinary Scientific Conference on social sciences and arts SGEM 2018 (pp. 421-428).
Bellavitis, C., Filatotchev, I., Kamuriwo, D.S. &Vanacker, T., (2017). Entrepreneurial finance: new frontiers of research and practice: Editorial for the special issue Embracing entrepreneurial funding innovations.
Bottenberg, K., Tuschke, A. &Flickinger, M., (2017). Corporate governance between shareholder and stakeholder orientation: Lessons from Germany. Journal of Management Inquiry, vol. 26 no. 2, pp.165-180.
Damanpour, F., Sanchez?Henriquez, F. & Chiu, H.H., (2018). Internal and external sources and the adoption of innovations in organizations. British Journal of Management, vol. 29 no. 4, pp.712-730
De Massis, A., Audretsch, D., Uhlaner, L. &Kammerlander, N., (2018). Innovation with Limited Resources: Management Lessons from the German Mittelstadt.
Fikasari, R. &Bernawati, Y., (2021). Internal or External Financing: New Evidence on Investor Reaction in Indonesian Manufacturing Firms. Journal of Accounting and Investment, vol. 22 no.2, pp.242-253.
Goldstein, A.P. & Kearney, M., (2020). Know when to fold ‘em: An empirical description of risk management in public research funding. Research Policy, vol. 49 no.1, p.103873.
He, Y., Chen, C. & Hu, Y., (2019). Managerial overconfidence, internal financing, and investment efficiency: Evidence from China. Research in International Business and Finance, vol. 47, pp.501-510.
Heikkinen, A., (2017). Business climate change engagement: Stakeholder collaboration in multi-stakeholder networks. In Stakeholder engagement: Clinical research cases (pp. 231-253). Springer, Cham.
Madra-Sawicka, M., (2018). The key role of internal financing among enterprises from the food industry–case of Poland, Latvia and Lithuania. ECONOMIC SCIENCE FOR RURAL DEVELOPMENT 2018, p.138.
Mashayekh, S. &Morshedi, F., (2020). Managerial overconfidence, internal financing and investment. Iranian Journal of Finance, vol. 4 no. 4, pp.102-125.
Schneider, T. & Sachs, S., (2017). The impact of stakeholder identities on value creation in issue-based stakeholder networks. Journal of Business Ethics, vol. 144 no.1, pp.41-57.
Setiawan, D. &Fahrurrozi, N.R., (2017), November. Feasibility analysis with capital budgeting backbone network fibre optic cable west palapa ring. In 2017 International Conference on Broadband Communication, Wireless Sensors and Powering (BCWSP) (pp. 1-4). IEEE
Shaban, O.S., Al-Zubi, Z. & Abdallah, A.A., (2017). The extent of using capital budgeting techniques in evaluating manager’s investments projects decisions (a case study on Jordanian industrial companies). International Journal of Economics and Finance, vol. 9 no.12, pp.175-179.
St?Pierre, J. &Lacoursière, R., (2017). Proactive Management of Operating Risks: A Lever to Improve External Funding for SMEs?. Risk Management: Lever for SME Development and Stakeholder Value Creation, pp.85-106.
Vinczeova, M. &Kascakova, A., (2017). How do Slovak small and medium-sized enterprises decide on sources of finance? Ekonomicko-manazerske spektrum, vol. 11 no.2, pp.111-121.
Assignment
ACCM4300 Financial Reporting Assignment Sample
Assignment Brief
Weighting - 20% of the overall assessment
Submission Via Turnitin-written Memo
Due Date Monday of Week 10 at 19:55 AEST
Assessment information
Work individually as this is not a group assignment. Any work which has been copied or shared between students will result in a Fail grade for all students concerned. So please make sure that the answer to this individual assignment is your own work and not copied from any source.
Required:
Part (A) – Write a memorandum to the Board of Directors (the members of the Board have varying degrees of accounting knowledge or understanding) as noted in the assignment details. The memo should be no more than 1000 words.
Assignment Components
Part A: Technical Component (15%)
This mark covers the technical content of your advice and the explanation on each of the issues, the calculations and the sources and references used and the format of the memo
Details of the Assignment for assignment help
Select Company:
You will select a set of Financial Report of an ASX Listed Company and obtain approval from your lecturer for the Group of Companies that you have selected. Please note that no two individuals may work on the same Group of Companies, so if another individual has already registered their interest in a particular Group of Companies, you will be advised to select a different Group of Companies.
Read the Annual Report including the financial statements of the Group and write a Memorandum to the Board of Directors clearly explaining some of the technical aspects of consolidation. Make sure you draw on the company’s specific details to explain the intricacies of consolidation to the Board and as much as possible avoid answering in general terms.
Please make sure that your assignment is in a MEMO Format – A Report format will not be marked. The assignment must include appropriate references to Accounting standards and other regulatory bodies.
Some of the aspects that you need to cover in your assignment are (but not restricted to):
1. Why did the parent entity have to prepare consolidated financial statements when the subsidiary company is a separate legal entity in its own right?
2. Does the published set of group financial statements reveal the company’s policy on corporate governance, Audit committees, Sustainability, Solvency? Does it reveal these issues and if so where and why?
3. Has there been any goodwill on the acquisition? Or any gain on bargain purchase? Where would you find it in the financial statements and what does it mean? Any impairment?
4. Any other relevant matter that you may wish the Board of Directors to make note of in respect of some transaction or event, the balance of account or disclosure that will assist them in understanding the financial statements of the group.
Solution
Memo to the Board of Directors
Date:
Subject: Technical Aspects of Consolidation for Commonwealth Bank of Australia
Reasons for Consolidation:
Parent companies as well as the subsidiary companies under them are necessarily required to merge and produce the relevant financial information of both the companies under one statement, which is basically called the consolidated financial statements. The parent company needs to present all the financial information in the statement of income and expenses as well as the balance sheet and the cash flow statement of its own company as well as the relevant information of its subsidiaries in the consolidated income statement as well as the balance sheet and the statement of cash flows (Santis, Grossi and Bisogno, 2019). As far as the Commonwealth Bank of Australia is concerned, there are three main subsidiaries under the parent company, which are the Commonwealth Securities, The colonial First State as well as the Bankwest. As per the Australian Accounting Standards Board or AASB 10 as well as AASB 3, the parent company as well as the subsidiary company needs to show the relevant information in the consolidated financial statements as well as the vital adjusted financial statements and at the same time, include the points in the notes to the financial statements in the annual report of the financial statement (AASB, 2021). The annual report of Commonwealth Bank of Australia shows all the information of the main company as well as the information of its three subsidiaries and at the same time, all the relevant information about the joint ventures of the company with other companies and business organizations. This is very crucial as the adjustment of the fair values of all the accounts will then be possible and will reflect a true and fair image of the consolidation (AASB, 2016). A consolidation worksheet is a tool that includes making adjustments in attempt to recognize goodwill. Fundamentally, the parent company would be in the greatest position to gather all the information and offer an integrated look at the financial reports by excluding all intra-group transactions in order to measure the overall performance and wealth of an entire corporation. The parent firm can use the consolidated reports to assess its control over its subsidiaries and plan forward for the next aim the group intends to attain (Sánchez-Serrano et al., 2020).
Disclosures made by the Commonwealth Bank of Australia
As per the Board of Directors of the bank, a good corporate governance is the foundation of the success of all business companies and so, it is crucial for the all the companies to assess the risk and then attempt to implement strategies so that they are able to meet the objectives of the company. For this reason, the Board of Directors of the CBA has effectively adopted the comprehensive rules and regulations of Corporate Governance Guidelines, which is also in compliance with the “Corporate Governance Principles and Recommendations” that has been released by the ASX Corporate Governance Council (Chan, Watson and Woodliff, 2014). As far as the audit committee is concerned, the audit committee of the bank consists of three independent directors who have a good expertise in the field of accountancy and finance. The responsibilities of all the audit committee is duly fulfilled by all the members of the audit committee and the relevant disclosure have been made in the annual report of both the parent company as well as the subsidiary companies. Solvency refers to a company's capacity to satisfy its long-term financial obligations. The interest coverage ratio, which divides operational income by interest costs to illustrate a company's ability to pay interest on its debt, can be used to assess its solvency. A larger value indicates better solvency (Coulon, 2020). As far as the CBA is concerned, there is no disclosure as such which has been made in the annual report of both the companies, but the solvency situation can easily be analyzed using the financial metrics like the calculation and the interpretation of the solvency ratios, which will give a better idea about the debt liability position of the bank. As per the sustainability report of the Commonwealth Bank of Australia, the business organization aims at believing that the success of a business is dependent on the actions as well as the customer profile and satisfaction along with the great interests of the stakeholders and the community, and this is the sustainability goal of the bank as well (CBA, 2021). There are several disclosures that have been made by the sustainability report of the bank, which mainly consists of the:
1. Responsible Financial operations
2. Sustainable business practices
3. Community contribution and action
4. Engagement of talent in the company
5. Environmental Stewardship
Goodwill
As far as the goodwill is concerned, it is clearly evident from the fact that the bank is involved with a number of other financial institutions regarding funds management as well as brokerage and investment securities. The goodwill was definitely purchased upon the acquisition of the Aussie home loans, where there was a decrease in the overall value of the acquired goodwill by approximately $72 million as a matter of fact after the adoption of the AASB 15 by the bank (CBA, 2021). The goodwill will be mentioned in the notes to accounts sections of the financial statements of the annual report where the section of goodwill will be comprised under the Intangible Section and the amount which will be recorded will be the amount at which the goodwill is purchased as well as the closing amount. No impairment of the goodwill will be recorded in the financial statements of the parent company or the subsidiary company (Carlin, Finch and Ford, 2007).
Intra Group Transactions
These transactions are those transactions that takes place between the entities under the parent group of the company. These might include all the different transactions of the profit or loss that has been realized between the parent company and the subsidiary company. As far as the Commonwealth Bank of Australia is concerned, the intra group transactions also contains the different borrowed funds by the parent company to the subsidiary company and this way, the Board of Directors can easily get a fair and true picture of the financial status of the subsidiaries as well as the Bank after a thorough analysis of the intra group transactions (Pane and Dodds, 2020). This will be very helpful for an overall observation.
References
AASB. 2021. Compiled AASB Standard AASB 10 Consolidated Financial Statements. Retrieved 18 May 2021, from https://www.aasb.gov.au/admin/file/content105/c9/AASB10_07-15_COMPdec17_01-18.pdf
Almagtome, A., Khaghaany, M., &Önce, S., 2020. Corporate Governance Quality, Stakeholders’ Pressure, and Sustainable Development: An Integrated Approach. International Journal of Mathematical, Engineering and Management Sciences, Vol 5 No 6, pp. 1077-1090.
CBA, 2021. 2020 Annual Report - CommBank. [online] Commbank.com.au. Available at: <https://www.commbank.com.au/about-us/investors/annual-reports/annual-report-2020.html> [Accessed 19 May 2021].
Coulon, Y., 2020. Key Liquidity and Solvency Ratios. In Rational Investing with Ratios (pp. 47-62). Palgrave Pivot, Cham.
Kabir, H., Su, L., & Rahman, A., 2020. Firm life cycle and the disclosure of estimates and judgments in goodwill impairment tests: Evidence from Australia. Journal of Contemporary Accounting & Economics, Vol 16 No 3, pp. 100207.
Pane, T. and Dodds, N., 2020. Icing, spreads and tax avoidance purposes. Taxation in Australia, 54(11), pp.619-623.
Sánchez-Serrano, J.R., Alaminos, D., García-Lagos, F. and Callejón-Gil, A.M., 2020. Predicting Audit Opinion in Consolidated Financial Statements with Artificial Neural Networks. Mathematics, Vol 8 No. 8, p.1288.
Santis, S., Grossi, G. and Bisogno, M., 2019. Drivers for the voluntary adoption of consolidated financial statements in local governments. Public Money & Management, Vol 39 No 8, pp.534-543.
Coursework
BMG704 International Finance Assignment Sample
Assignment Brief
Aim & Learning Outcomes
Module Rationale
Businesses now operate in a highly globalized and competitive market where access to, and control of, finances are necessary for survival. This module focuses on the international financial management techniques essential throughout the business life cycle. The module provides a broad overview of international financial management theory and practices which are imperative to creating and sustaining a successful international business venture. The module probes the financial landscape in which modern day international businesses operate.
Overall Aim of the Module
The module provides students with and introduction to financial management theory and techniques required for entrepreneurship and managerial decision-making within an international business context.
Learning Outcomes
Successful participants will be able to:
Learning Outcome 1
Demonstrate a comprehensive knowledge and critical appreciation of the key concepts and topical issues of International Finance.
Learning Outcome 2
Act autonomously in the analysis of new and/or abstract data using a range of techniques appropriate to the discipline of International Finance, synthesizing evidence and critically evaluating complex problems in International Finance.
Learning Outcome 3
Be proactive in leadership, work effectively within a team or group as appropriate, make and sustain arguments/alternative points of view related to the discipline of International Finance.
Learning Outcome 4
Demonstrate confidence and flexibility in critically evaluating complex problems and the application of appropriate knowledge, tools or methods to their solutions in the context of International Finance. Be confident in the application of their own judgement.
Coursework 1
Assessment Task
Choose a Multinational Enterprise (MNE) listed on an internationally recognized Stock Exchange (including for example, London, Dublin, New York or Paris).
You are required to:
a. Critically discuss two recent developments in the international financial environment which appear to have impacted on your chosen company’s recent performance and development. Analyze how these two developments are likely to impact on the company in the near future. (14 marks)
b. Discuss the following key elements of the MNE’s international financial and/or risk management strategy (and how they appear to have affected the financial performance of your chosen company):
• Sources of finance
• Dividend policy (14 marks)
c. With reference to your chosen Multinational Enterprise (and using the most recent annual report published), analyses the financial performance (in terms of profitability, liquidity, efficiency and investment) of the company in the two most recent consecutive financial periods (e.g. 2018/19 or 2019/20,) using 8 different accounting ratios (prior year comparative figures will be available in the annual report).
Notes:
(i) You must advise your tutor of your chosen multinational enterprise to ensure suitability for use and avoid duplication;
What you need to do to demonstrate achievement of learning.
(ii) It is advisable to choose your multinational enterprise and download the most recent annual report by the end of week 1 – this will facilitate your preparation and allow you to effectively participate in weekly class activities;
Assessment Guidelines
1) Detailed guidance will be given in the tutorials in weeks 1 and 6 to explore the factors for your chosen case study and provide advice on the use of mediums/technologies for this assessment exercise.
2) This element of coursework accounts for 60% of the overall assessment. Students should refer to the marking criteria attached to provide them with fuller details of marking criteria a for each classification band.
3) Completed assignments must be submitted via Turnitin by 12.00 noon on Sunday of week 9 in semester 1. This date and time is final, and a late submission will be penalized by the deduction of marks.
4) All submitted assignments should have the file name:
BMG704 (86968) Student B00xxxxxx
6) View additional ‘Standard Assessment Guidance,’ for further guidance applicable to all
coursework elements.
Coursework 1 FEEDBACK for assignment help
Feedback on the assessment will be provided via Blackboard within three weeks of the submission date.
Solution
Introduction
Woolworths is a multinational supermarket and grocery stores having headquarters in New South Wales, Australia. Company is specialised in selling groceries such as packaged foods, meat, vegetables and fruit and also sell beauty products, stationery, magazines, DVD’s, baby supplies and health products. Company is listed on Australia stock exchange currently trading at the rate of $39.20AUD. Company generated revenue of $42.151 billion in 2020. This report aims to discuss the recent development and risk management strategy in the international financial environment and its impact on Woolworths. Furthermore, the report will also conduct an analysis of financial performance with the help of accounting ratios for the most recent consecutive years (2019/2020).
Two recent financial developments of Woolworths
According to annual report of the Woolworths (2020), Company has issued Australian Medium term notes amounted to $1.0 billion which include tranche of $400 million maturing in May, 2025 and other tranche of $600 million maturing in the month of May, 2030 (Woolworths Group, 2020). The purpose of issuing medium term notes is to refinance the group senior US notes which were maturing in month of September, 2020 and also for European medium term notes maturing in November, 2020. The aim of the Company is to lower the effective interest rates and lengthening the weighted average maturity of the period of the notes.
According to annual report of Woolworths (2020), Woolworths launched 131 products in the range of fresh made easy range, to offer more comfortable alternatives to shelves as more customers are demanding for delicious and fresh meals. Company also opened new distribution centres to increase its supply chain network and provide a semi-automated national distribution for growth and increasing efficiencies and deliver better experiences to customers.
Impact of financial developments on Woolworths
The debt refinancing is a decision of Companies to retire their existing debts, reduce coupon rate reflecting the market rate of interest and is a part of renegotiation of debt obligations. Debt refinancing will create a cash inflow and enhance credit rating of Woolworths (Woolworths Group, 2020). However, if a Woolworths get the best rate on the refinancing of medium term notes then it will increase the cash flow which can be reinvested in equipment, new locations, inventory, and meeting other monthly payments to especially fight with this pandemic condition which will further help in maintaining better performance and increasing profitability (Robinson, 2020). Refinancing debt may dissuade the potential investors and also acquirers.
The second financial development is increase in product range and supply chain network which will increase sale and thus the profitability of the Company. Opening of new distribution centres will increase the cash flow for the Company and improve the liquidity. There will be increment in the stock options and Company could meet the excessive demand of customers through better supply chain. There will be increase in competitiveness in the market which will further increase the value of share in the market. However, Woolworths will suffer shortage of cash at initial stage which may also lead to need of borrowing more cash from the market (Moyer, et al. 2014). There will be need of more workforce, more equipment and facilities and therefore, more capital needs. Company will have to manage the cost of business and finance in such a way that it can retained some profits for future uncertainties such as pandemic situation, expansion of business or setting off debts also distribute some profits to shareholders which can appear as finance distress for Company in future.
Source of finance and dividend as key elements of international finance and/or risk management strategy
Multinational Companies arrange finance mostly from raising from issue of shares, debentures or bonds or approaching to banks, retained earnings and financial institution to meet its long term obligations. Short term source of finance is obtained through commercial banks as working capital, trade credit and receiving of advance. When capital is altered then there is impact on net income of the Company, cost of capital, leverage ratio and also the liabilities. Equity financing dilutes the existing shareholding. However, Company’s cash flow from financing activity becomes positive due to increase in funds with the Company from issue of shares or bonds (Jacque, 2014). Debt financing of the Company increases the liabilities of Company and also cash flow from financing activity. Debt financing increase the finance cost as Company is required to pay regular interest and repay the principal amount on future date to bondholder or lender. However, debt financing does not dilute the ownership. There is decrease in net income for shareholders and debt holders hold senior position at the time liquidation of Company. Company gets tax benefit through lower rate of tax.
During the financial year 2020, the unprecedented pandemic due to Coronavirus has impacted Woolworths both positively and negatively. Company dedicated to invest in safety and addressed risks out of pandemic. Company increased its distribution centres to meet the demand of daily needs by customer, employed many new workers to response to the changing customer behaviour (Lumby and Jones, 2015). For the purpose of above initiatives, Company raised borrowings which are doubled from prior year and increased cash flow. Company has refinanced its existing loan and also paying $700 as interest on lease which is a regular financial burden on Company.
Woolworths Company might face liquidity problems due to constant receiving of capital from borrowings in order to pay debts and invest in operations. Company is required to be more cautious for its excessive debts at constant rate which is giving profits in short run but can create great financial trouble in long run. Company has incurred another long term obligation by Dividend policy.
Dividend is the distribution of proportion of profits to shareholders after tax from surplus remained. Company either choose to use the profits to reinvest in the business or disseminate to shareholders in form of dividend. Dividend policy of any Company creates positive impact on performance of Company (Moyer, et al. 2014). There is improvement in return on equity and also enhance the corporate image in the market. Woolworths have been constantly paying dividend to its shareholders. In the year 2020, Company declared the dividend of 48 cents per share which is around $606 million (Woolworths Group, 2020). Company also give option to shareholders to convert their dividend into shares under dividend reinvestment plan which will provide better rate of return to shareholders and increased the number of outstanding shares for Company. The payment of dividend has decreased the retained earnings of the Company and resulted in negative cash flow from financing activities and the cash decreased from hands of Company.
Woolworths might approach for no dividend payment policy for one year to manage its liquidity positions which seems to be delicate and can invest that amount in widening its range of products, renew of its existing process of supply of goods or repay its long term obligations (Hill, 2017). This will automatically improve the profitability, leverage position and shareholder value of the Company.
Analysis of financial performance of Woolworths
Liquidity Ratio
Liquidity ratio is financial metrics which help in ascertaining to pay current debts without going for external capital. Current and quick ratio gives an idea on ability of Company to meet its short term liabilities which fall due in coming 12 months from its short term assets (Palepu et al. 2020). The ideal current ratio is 2:1 and quick ratio is 1:1.
Current ratio
Current ratio = Current assets/Current liabilities
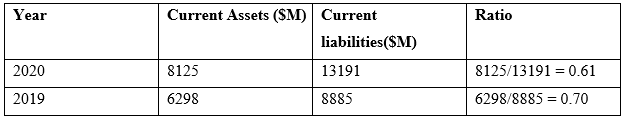
Quick ratio
Quick ratio = Quick assets/current liabilities
Quick Assets = Current Assets-Inventory
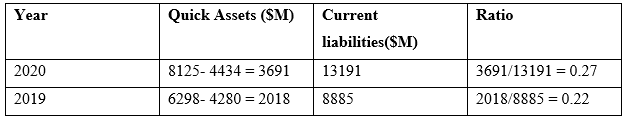
Analysis
The current ratio of Woolworths is less than 2 in 2019 and 2020 which is reflecting that Company might face difficulty to set off its current obligations when it will become due. Quick assets are highly liquid assets excluding inventory (Easton, et al. 2018). The quick ratio of Company from previous year is implying that Company is short of liquid assets to pay current liabilities and also current assets are dependent on inventories. Moreover, current ratio also gives a sign of effective operating cycle of Company to convert its product into cash. It is ascertain that Woolworths have trouble in receiving its debtor payment timely which can result in liquidity problems.
Profitability Ratio
Profitability ratio ascertains the ability of a Company to earn profit out of operational costs and revenue and also related to shareholder equity and balance sheet assets.
Return on Assets
Return on Assets = Net income/Average total assets
Total assets for 2020= $38472m
Total assets for 2019= $23916m
Total assets for 2018= $23391m
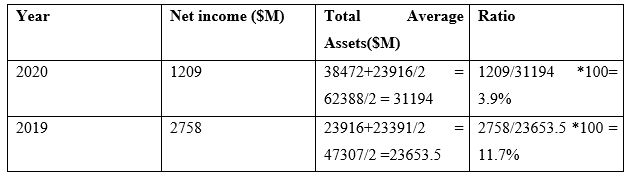
Analysis
Return on assets ratio present the Company’s earning of Company on asset. Higher return on assets will signify that the Company is efficiently using its assets. Company return on assets has been decreasing from prior year which is depicting the inefficient of management of Woolworths to manage its assets and generate earnings from its assets on balance sheet (Alexander and Britton, 2017). In other words, Company is unable to generate more profits per dollar of its assets in 2020.
Return on Equity
Return on Equity = Net income/ Shareholder Equity (Total Equity)
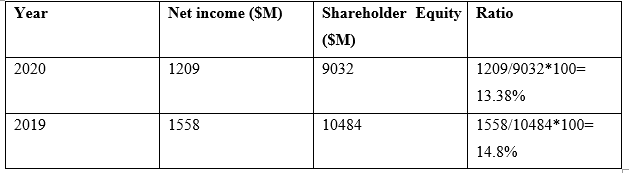
Analysis
Return on equity is a generation of return on the money invested by shareholders. High return on equity denotes the ability of management to utilise the capital invested by shareholders in an efficient manner (Easton et al. 2018). Return on equity of Woolworths is decreased from the previous year which is signifying that management is not utilising the equity finance efficiently.
Gross Profit Margin
= Revenue-Cost of goods sold/Revenue
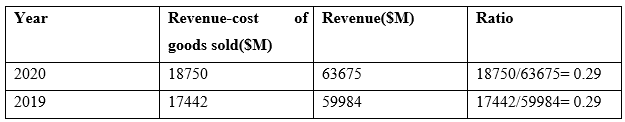
Analysis
Gross profit margin is to measure the profitability and financial health of Company by calculating the left over money from sale of product after deducting cost. The gross profit margin of Woolworths has been stable which is implying that Company needs to be more efficient in generating profit by considering the costs involved in selling goods.
Debt to Equity
= Total liabilities (Current liabilities + long term liabilities)/Total Shareholders’ equity
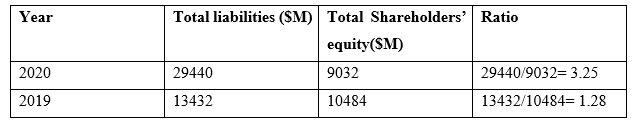
Analysis
Debt to equity evaluates the financial leverage of Company and help in measuring the ratio of wholly owned funds versus outside funds. This shows that how much does a Company is using leverage and also reflects the shareholder equity in terms of covering the outstanding debts if business slumps (Bekaert and Hodrick, 2014). The debt to equity ratio of Woolworths has spiked with double rate from 2019 which is demonstrating the aggressive nature in financing the growth of Company with debt and has resulted in excessive finance cost in terms of interest expenses.
Cash flow margin
= Cash flow from operating activities/Sales
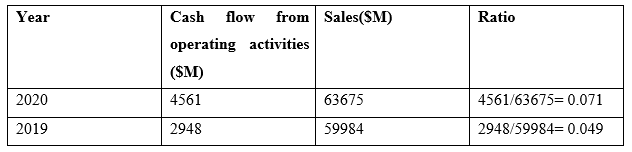
Analysis
Cash flow margin is a profitability ratio measure the earning quality of Company and efficiency. There is increase in cash flow margin from prior year which is showing that Company is able to convert sales into cash better from 2019.
Efficiency ratio
The ratio measures the ability of Company to use assets efficiently which can generate more income (Jacque, 2014). The ratio looks at the time to convert stock into cash and collect cash from customers etc.
Asset turnover ratio
=Total sales/Beginning assets (assets at start of year) + Ending assets (assets at end of year)/2
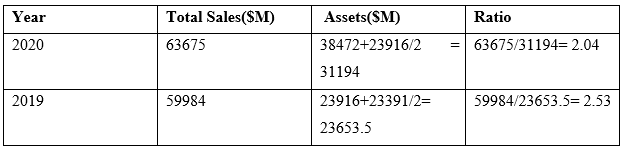
Analysis
The ratio ascertains the effectiveness of Companies to utilise assets and generate sales. Company is performing better if the ratio is high and vice versa (Alexander and Nobes, 2016). Asset turnover ratio of Woolworths has been reduced from previous year which implying that the Company is generating less revenue on assets or assets are not being utilised up to its capacity.
Inventory turnover ratio
=Cost of Goods sold/opening stock (inventory at start of year) + closing stock (inventory at end of year)/2

Analysis
Inventory turnover ratio indicates the number of times Company turn over its stock or inventory during a year. In other words, it measures the number of times the inventory is used or sold in a time period such as for one year (Eiteman, 2016). There is improvement in the ratio from previous year and now Company now replace its stock for 10 times in a year which shows the demand of goods of Company.
Day Sales outstanding
= Accounts receivable/Revenue* Days in period
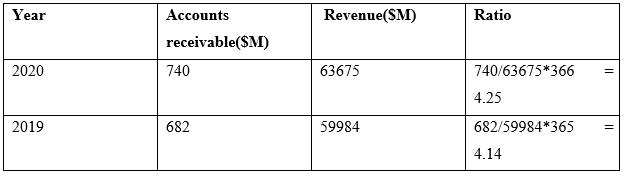
Analysis
Days Company required collecting the revenue from sales of goods on credit. The ratio shows the capability of Company to manage accounts receivables. There is increase in average number of days from previous year which indicates that Company takes long time to collect its outstanding receivables.
Investment ratio
Investment ratio helps in assessing the performance of shares of Company such as price earnings ratio and earning per share (A trill and Mc Laney, 2017). Investment ratio is more beneficial for investors in addition to the interest of ordinary shareholders.
Earnings per share
= Net income- dividend on preference shares/Weighted Average common shares outstanding
= 1165-0/1257.9 = 0.92
Analysis
Earnings per share indicate the amount of money earned by Company for each share. According to annual report of Woolworths (2020), the earnings per share of Company are decreased from previous year which was 2.06. This reflects that there is less profit or money earned on each share of Woolworths during 2020. High EPS is also good for Company as investors will show interest in investing in the Company.
Price earnings ratio
= Market price per share/ Earnings per share
Market price per share= $39.20AUD
Earnings per share = $0.92 AUD
=39.20/0.92=$42.60
Analysis
Price earnings ratio ascertains the relative value of shares value in the market. The ratio assesses the current value of share with the earnings per share (Alexander and Nobes, 2016). A share having high PE ratio is more attractive to investors and helps in valuing the value of share.
Conclusion
It can be concluded, that Woolworths is required to become more efficient by improving its ability to use the assets up to its capacity, reduce the burden of debts, find out the ways to control its cost to generate more profits. Company is also insufficient in managing its cost of sales which has decreased the revenue and degraded the performance of Company from last year. Company has adopted various plans to face the pandemic in opportunistic manner but Company capacity to meet out its short term obligations is shrinking which may downturn the financial position of business. Company is required to increase its inventory turnover and decrease its credit sales to manage the liquidity position. Furthermore, Company is cautiously required to focus on its investments and utilise the capital obtained either from borrowings or issue of shares efficiently.
References
Alexander, D. and Britton, A. 2017. International financial reporting and analysis. 7th ed. London: Cengage.
Alexander, D., and Nobes, C. 2016. Financial accounting –an international introduction. 6th edition. Harlow: Pearson Education.
Atrill, P., and Mc Laney E. 2017. Accounting and finance for non-specialists. 10th Edition.
Eiteman, D.K. 2016. Multinational Business Finance, 14th Ed., Pearson.
Bekaert, G. J., and Hodrick, R.J., 2014. International Financial Management, 2nd Ed., Pearson.
Easton, P.D., McAnally, M.L., Sommers, G.A. and Zhang, X.J., 2018. Financial statement analysis & valuation. Boston, MA: Cambridge Business Publishers.
Hill, C. W. L. 2017. International business. 11th ed. New York: Pearson.
Jacque, L. 2014. International corporate finance. London: Wiley.
Lumby, S. and Jones, C. 2015. Corporate finance: theory and practice. 9th ed., London: Cengage
Moyer, R.C., McGoogan, J.R. and Rao, R.P., 2014. Contemporary financial management. Cengage Learning.
Palepu, K.G., Healy, P.M., Wright, S., Bradbury, M. and Coulton, J., 2020. Business analysis and valuation: Using financial statements. Cengage AU.
Robinson, T.R., 2020. International financial statement analysis. John Wiley & Sons.
Watson, D. and Head, A. 2016. Corporate finance 7th ed. New York: Pearson.
Woolworths Group, 2019. Annual Report. Available at https://www.woolworthsgroup.com.au/icms_docs/195582_annual-report-2019.pdf. Accessed on 18.07.2021
Woolworths Group, 2020. Annual report. Available at https://www.woolworthsgroup.com.au/icms_docs/195794_annual-report-2020.pdf. Accessed on 18.07.2020
Research
FIN600/ FINA6017 Financial Management Assignment Sample
Question
Instructions
The basic requirement is to undertake a general financial analysis, comparing financial position and performance over the two most recent financial years, of an ASX listed company. Your Learning Facilitator will provide the details of the ASX listed company. The annual report for the chosen company should be available on the company website and/or will be provided by your Learning Facilitator. The analysis should consider each of the following financial ratios: - profitability and market performance
- Efficiency,
- Liquidity,
- Capital structure
Note: You are to use the ‘consolidated’ data in conducting your analysis. You are only required to look at the most recent financial report. For those ratios which involve averages, you will calculate an average for the most recent year only, the prior year ratio calculation will NOT consider average calculations.
This assignment will contain two elements: 1. Schedule(s) of relevant ratios and other useful calculations
- The detailed calculation of relevant ratios and other useful calculations should be included, as one appendix, prepared using Excel. An example template is provided under the assessment 2 information, Assessment 2 Appendix template.xls.
- You will be advised by your facilitator as to which ratios to calculate.
- You are advised to show the formulae used in determining particular ratios and other figures.
2. A written report The written report is the main element of this assessment. A sample template is provided under the assessment 2 information, Assessment 2 report template.doc. The written report should:
- Explain what is revealed by the ratios and other calculations, in the context of the company’s profitability, asset efficiency, liquidity, capital structure, and market performance.
- In particular, any important changes over the two financial years should be identified, discussed and, where possible, explained.
- Provide an overall assessment of whether the company, over the recent financial year, has been better than the previous financial year, in the perspective of existing equity investors (shareholders).
In preparing this report, you should:
- analyse the financial statements of the business;
- identify key ratios and apply ratio analysis; - argue the case of why the organisation may or may not succeed in the future and what the business should be doing to help it succeed;
- consider the impact of the political and competitive environment on the business;
- include external factors that need to be taken into consideration and the likelihood of a merger or acquisition;
- provide a recommendation, that is, would you invest in this company after your own analysis or under what circumstances would you buy/save the business?
SOLUTION
• Introduction
• Background and Business
Bega Cheese is an Australian Diversified food company with its manufacturing site and headquarters located in New South wales, Victoria and Queens. It was established as an agricultural business in the town of Bega located in New South Wales by suppliers of dairy in Australia. The company subsequently got public in 2011 and got listed in Australian stock exchange. More than half the shares that are currently outstanding in the market, is owns by the farmers of Bega Suppliers. Currently, it is one of the largest companies in the dairy industry of Australia and was responsible for supplying more than 750 million liters of milk for the year ending 2018 (begacheese.com.au 2021).
The primary source of income for Bega is its spread product like along with packaged dairy products and other grocery products with their flagship “Bega” brand owning 15.7% of the Australian cheese retail market. The other major food brands operating under the brand name Bega include Farmers Table, “Picky Picky” and Zoosh. Fronterra is a major distributor of all Bega dairy products under long term agreement. The 1/3 of Bega’s revenue results from export activities of the nation. The Cheese products of the brand are exported to over 40 countries around the world and distributed across Australia where they are easily available in all general stores and supermarkets (begacheese.com.au 2021).
Other business segment of the company comprises of core dairy ingredients such as cream cheese, cheese and powered milk and nutritional products produced under the Bega Bio nutrients brand which contributes to 9% of the total revenue of business. In the year 2017, Bega announced its sponsorship to mumbulla foundation 2017 gala dinner. In 2019, it won a legal dispute against Kraft Heinz over their peanut butter packaging. In 2020, they raised considerable amount of fund to purchase Kirin’s suite of dairy products (begacheese.com.au 2021).
• Company Analysis
• Current Financial performance, Key financial highlights, Economic outlook
For the year ending 2020, the Bega Cheese has performed in a sound and stable way which is why it is critical to assess the financial statement of the company. Against the backdrop of increased uncertainty imposed by covid 19, Bega successfully overcame all odds and strengthen its cash reserves while extending their helping hand in unprecedented times. The challenging year even though have left every industry shook and broke, Bega managed to survive and build resilience through is effective planning and strategy execution. The culture and experience of the business has once again reflected on the firm’s strong financial outlook and financial efficacy over the years (begacheese.com.au 2021).
Financial highlights/events of 2020
• For the year ending 2020, the company successfully increased its revenue by 5% to $1.49 Billion compared to the performance of 2019.
• While the revenue has been steadily increasing, the increasing competitive environment of milk and dairy supply chain has normalized PAT and EBITDA that amounted to $236.4 Million, a reduction of 18% (Kourtis, Kourtis & Curtis, 2019).
• The overall production of the business was drastically impacted by prolonged drought and competition in supply chain which reduced productivity by 2% to 298 thousand tonnes. Bega cheese is persistent in reviewing its infrastructure and integrating it with supply profile and the market.
• Year 2020 was the year of focusing on strengthening the balance sheet of the business and improve cash management which helped the company in reducing its net debt to $236.4 Million as at 30th June.
• The EBITDA of business amounted to $103 Million which is towards the upper end of guidance (Setiawan & Amboningtyas, 2018).
Economic Outlook
• The group is well positioned as it enters the financial year 2021 with improved profit contributions from the recently commissioned lactoferrin facility at Koroit.
• Further, the company is expecting to benefit from reduced debt and working capital which would further strengthen its potential acquisition ability.
• Innovation in the product category would depend on the performance of existing products including Simply Nuts and Vegemite (AREAS, 2018).
• The dairy category of the business would continue to strengthen the company’s performance even further and would enable it to reach new highlights of success while driving more revenue in the long run.
• In the opening quarter of 2021, the prices of milk were lower than 2020, majorly onset by the Covid 19 pandemic which reduced the demand of dairy products (Mitrovi, Kneževi? & Veli?kovi?, 2015).
• Ratio Analysis
• Profitability and Market ratios
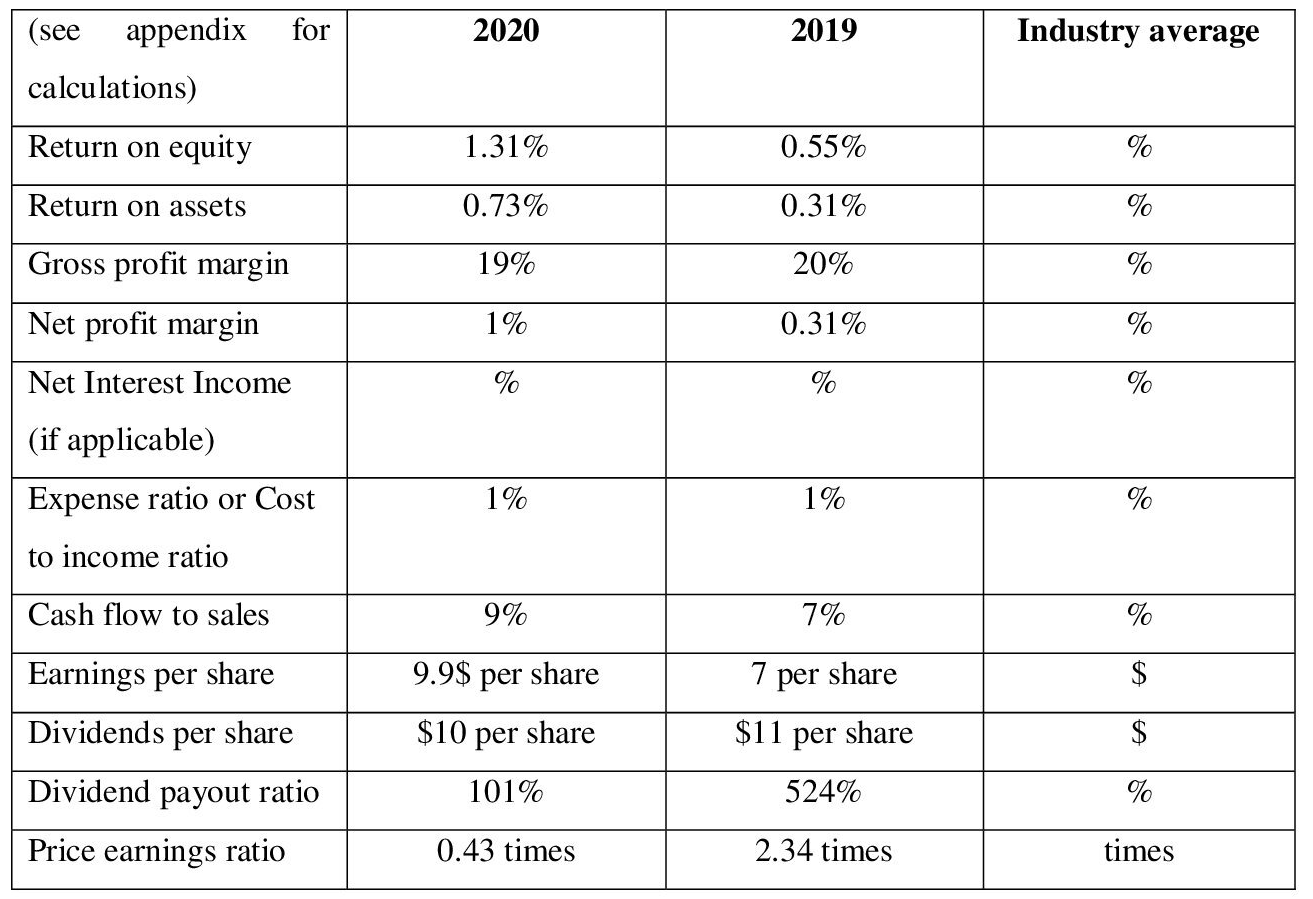
As can be observed by the table above, it represents the financial outlook of Bega Cheese for the years ending 2020 and 2019 to observe its trend and comment on its changing financial positioning. First thing to be observed is a steady growth in the ROE of business. ROE represents the returns that the company is generating from the effective investment of its equity share capital. As can be seen, even though the increase is marginal in nature, it indicates that the company’s expertise to improve its revenue stream from successful investment strategy has increased over a period of one year, and if the management continues to operate in the same pace, then the revenue stream would increase further in the future (Kanapickien? & Grundien?, 2015).
Further, the ROA, which indicates the returns from the total asset, has also increased to a marginal level from 0.31% in 2019 to 0.73% in 2020. This would not have any significant impact on the overall growth, but in general, a growing trend is a good indication and suggests that the assets of the company are effectively increasing its productivity and hence are able to generate better revenue based on the performance (Arkan, 2016).
However, the gross profit, which indicates the income of business after covering for the cost of goods sold, depicts a marginal trend, by falling to 19% in 2020 compared to 20% in 2019. Even though the decline is not drastic compared to the uncertainties that the business went through, if the reason behind the decline is not properly monitored, it would eventually leverage the entire operations of the company and would make the operations highly vulnerable. Usually, a declining trend is observed when the growth in COSG is higher than the revenue, or revenue has significantly declined, or sometimes a combination of both (Olariu, 2016).
The expense ratio seems to be in a constant state indicating the fact that the expenses have been kept effectively under control even under uncertain times like the pandemic, which has put a dent the overall performance of the business. The company needs to significantly focus on increasing its income, and be better able to cover for all the outstanding expenses, which at the moment, it relatively lower than the industry standard and is certainly an area of concern (Nofiana & Sunarsi, 2020).
The cash flow to sales ratio reflects a positive trend by increasing to 9% in 2020 compared to 7% of 2019. This means that the company has improved its cash retaining capacity and is saving more from total sales rather than spending in on operational activities of the firm. However, compared to the industry standard, the ratio is relatively lower, and means that the company is struggling to retain majority of its revenue and is rather spending a lot in its operations (Ball et al., 2015).
Further, the EPS of the business also reflects a increasing trend from 7 per share in 2019 to 9.9 per share in 2020. This means that the company has successfully invested its share in the market to improve its revenue stream. A n increasing EPS is always a good indication and suggests that the company is able of skillfully managing its revenue from and increase it using outstanding equity.
Dividend per share marginally declined which was expected as the company faced much hardship dealing with the impact of covid 19 virus. Finally. The P/E ratio of the company stood undervalued for the year 2020 compared to its value of 2019. This means that the shares of the business are being traded lower than the market value which is an ideal situation for buying shares (Ichsani & Suhardi, 2015).
• Efficiency ratios
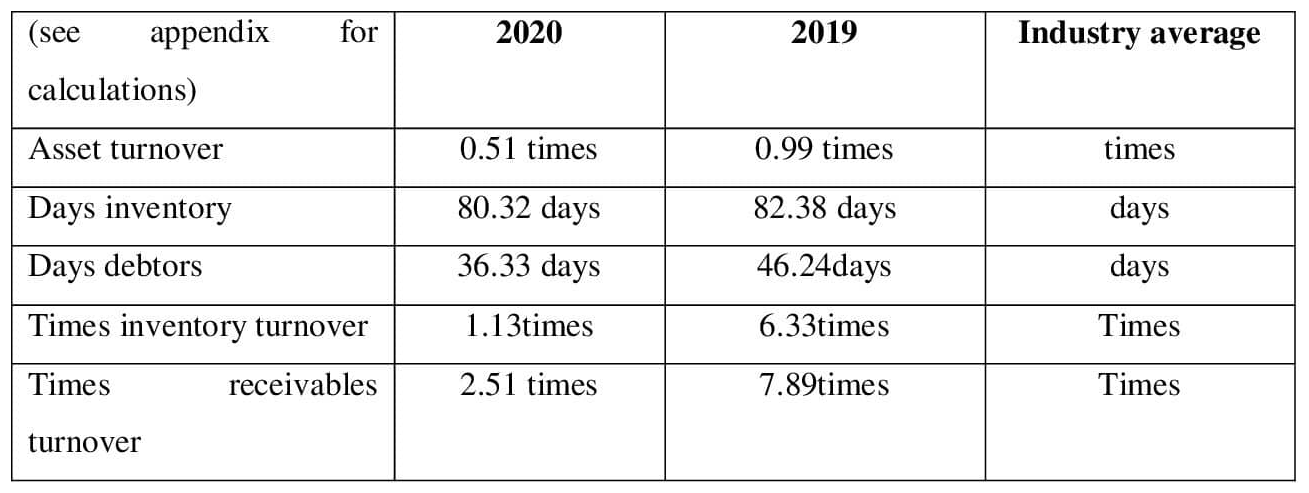
Efficiency ratios helps in assessing the ability of company to work efficiently and use its resources in a way that would generate the highest value for the company and decrease cash outflow as much as possible. Efficiency ratios are critical for the interpretation of company’s performance as it provides insight into the ability of business to effectively manage all the internal resources while keeping check on cash outflows in the process (Olesen et al., 2015).
As can be seen from the table above, the asset turnover of the business has a marginal declining trend and reduced to 0.51 times for 2020 compared to 0.99 of 2019. Even though it would not have drastic or immediate negative impact on the performance of business, a declining trend is indicative of the fact that the efficiency of total assets to generate and improve revenue has reduced, and hence the company needs to invest in the in improving its productivity and ensure that the assets are in demand and strengthen the balance sheet of business.
Day’s inventory is the number of days that the company rakes to sell its entire inventory and replace it with new one. As can be seen from the chart above, the days inventory of the business is relatively higher than the industry average. Investors usually prefer investing in companies with short inventories days as the revenue generation in these companies are usually high. Even though the days inventory of Bega Cheese has a declining trend, it is not very impressive compared to some of its competitors (Bunker, Cagle & Harris, 2019).
Days debtor on the other hand, indicate the amount of time it takes for a business to collect its receivable from debtors. As can be seen, the days debtor’s ratio of Bega cheese reduced from 46.24 days of 2019 to 36.33 days in 2020. This is a good indication and suggests that company is improving its capability of collecting its debts on time and to reduce the chances of incurring bad debts. It can undertake many initiatives to further improve its collection period like providing early bird discount. Times inventory of the business also has a declining trend which is not a good indication and suggests that the number of times an inventory is sold within a financial year has been reduced, primary due to pandemic Covid 19.
Time receivables turnover is the number of times a company collects its receivables from debtors. As can be seen, the times receivable of Bega Cheese for 2020 amounted to 2.51 compared to 7.89 of 2019, a downward trend which is not very preferred by investors as it means that the company is not putting much effort in collecting its receivables (Garanina & Belova, 2015).
• Liquidity ratios
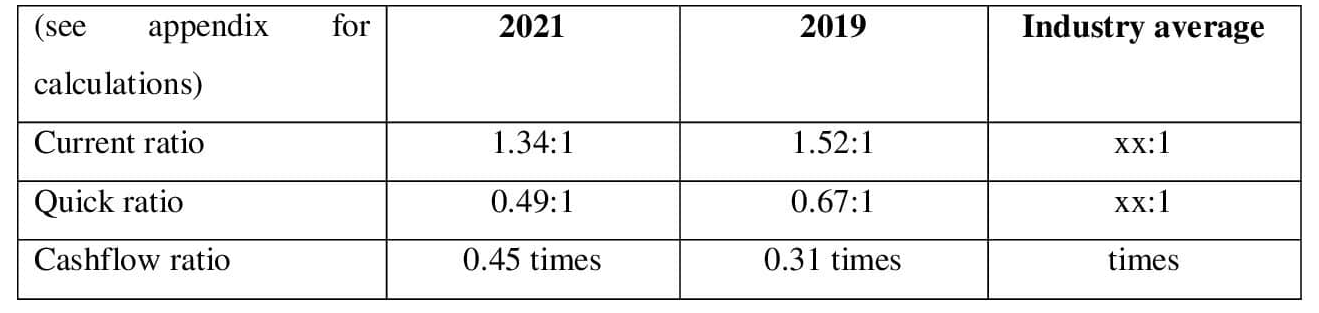
Liquidity ratio helps in assessing the short-term solvency of companies. The first and foremost liquidity that can be observed from the table above is current ratio. This ratio helps in comparing marketable assets with short term debts of the company. Current ratio of Bega Cheese for both the years is observed to be higher than one which means that the current ratio is higher than current liabilities and hence the business is capable enough to cover for all short-term debts without raising external source of funding (Saputra, 2019).
Quick ratio on the other hand helps in assessing the liquidity of business after deducting the inventories from current asset. As seen, quick ratio for both the years has been lower than one which means that the company is not capable enough to meet for its debts if the inventories are excluded from the current assets of the company (Alipour et al., 2015).
• Gearing ratios
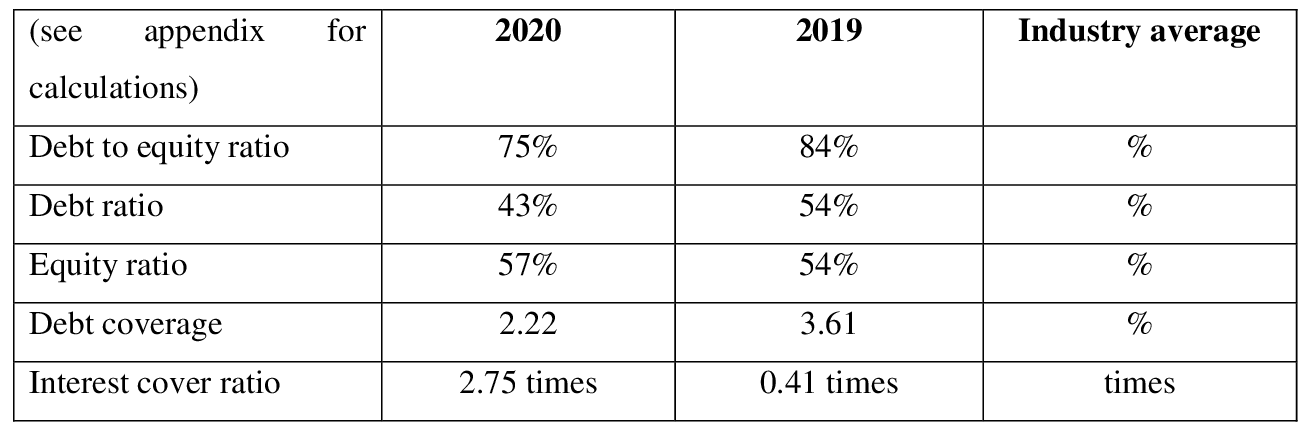
Gearing ratio helps in gaining insight into the liquidity of company. Debt to equity ratio of the business amounted to 0.75 for 2020 compared to 0.84 of 2019. For both the years the debt-to-equity ratio was lower than one which means that company gives more importance to equity to fund most of its operations (Trenca, Petria & Corovei, 2015).
Debt ratio on the other hand provides insight into the number of total debts used to fund the total assets that the company currently owns. The debt ratio of 2020 and 2019 amounted to 0.43 and 0.46 respectively. This means for every $1 spent on asset, 0.43 is funding from debts and rest from other sources of funding. Preference over s specific funding source is a matter of choice. Generally, businesses avoid being highly dependent on debts to fund most of its operation as the chances of becoming highly leveraged increases (Lang & Schmidt, 2016).
On the other hand, it can be noted that equity ratio of the business has an increasing trend which means that preference towards equity to fund the acquisition of assets is high. Also. Equity ratio of 0.57 means that for every $1 dollar spent on asset, 0.57 is sourced from the equity capital. Businesses gives high preference to equity ratio has it does not have the company leveraged and the company is not obligated to return back the capital gathered unlike the debt funding. However, the cost of maintaining equity capital is significantly higher than debt which needs to be keep in mind (Yapa Abeywardhana, 2017).
Debt coverage ratio indicates the ability of company to cover for long term debts using the cash from operating activities. As can be seen from the table above, the debt coverage ratio for both the years have been higher than one, even though having declining trend. This means that the cash from operating activities is significantly lower and can effectively cover for the long-term debts.
Lastly, the interest coverage ratio is a capital structure ratio which indicates the ability of business to cover for interest expense using the EBIT. As can be seen from the table above, the Interest coverage has significantly positive and increasing trend. This means that EBIT of company has increased at a faster pace than interest expense and hence Bega Cheese has become significantly capable of cover for its interest expense without needing funds from external sources (Öztekin, 2015).
• Recommendations and overall assessment
Has the reporting year been better than the prior reporting year for the company?
The reporting year of 2020 has not been better than the previous year, primarily due to the onset of Covid 19 pandemic is reduced prices of its dairy products. Further, the profitability ratios for both the years have not been very impressive given the competitive environment of dairy industry in Australia. Apart from the ROE, ROA and net margin ratios, with a marginal increasing trend all other profitability ratio had a declining trend (begacheese.com.au 2021).
This indicates, that even though the company has gain market leadership in the industry, it is still failing to generate significant income for itself, due to increase competition in the market and inability of investing in new innovative products. Further, the ROE and ROE of the company is not very impressive as well standing at 1.31% and 0.73% respectively which is an area of concern and indicates that the company is failing to generate value from its resources.
Will the company succeed in the future?
Based on the assessment of gearing and efficiency ratio, the chances of business succeeding in future is relatively high, as the business has survived an unfortunate event like the Covid 19 pandemic and was still able to improve its revenue significantly. Also, the current ratios of the business are more than 1 for both the years which means that the company is capable enough to cover for its short-term debts without raising external source of funding.
However, based on the efficiency ratio, the growth and success of business seems doubtful as the company does not have effective strategy in place to collect receivables from debtors and neither has a high receivable turnover ratio which increases the chances of incurring bad debts. As far as the gearing ratio is concerned, Bega Cheese is dependent on the equity share capital for funding most of its capital which means that the company would not get heavily leveraged in the future.
The likelihood of a merger or acquisition of the company?
In the upcoming years, the company is likely to acquire a business rather than getting acquired as it has significant hold over the market place and is a renowned dairy business located in Australia. It is also very likely to increase to create huge synergy through acquisition. However, the company has been lagging behind is significantly improving its profitability which is an area of concern,
Even if the company successfully acquires a business, the chances of becoming highly leverage would also increase. This is due to the fact that the company inclination towards debt money would steadily increase with increased requirement of capital. Further based on its interest coverage ratio, Bega Cheese would be able to cover for its long-term debts without needing external funding.
Suggest what should the company be doing help it succeeds
• There are several things that the business can do to improve its performance. Firstly, it can expand its line of products to attract higher customer base. It can expand its operation to international market which would help gaining traction from all around the world. It can also offer special discounts to its loyal customer to retain their loyalty.
Bega Cheese needs to improve their profitability and efficiency ratio which are considerably lagging behind in the market. The profitability can be increased by increasing revenue while the efficiency can be improved by increasing the returns from invested assets.
External impacts that need to be taken into consideration
The impact of government on the business
The external factors such as economy of country, political factors, technological factors, environmental and social factors are some of the aspects which the business needs to consider while taking any decision. Economic factors such as GDP growth can help boost the revenue of business while political factors can limit the chances of success.
Government can impose higher tax on businesses making significantly high revenue which posses’ immense threat to the income of company. Further, it regulates the performance of businesses in the market which is another reason why it is necessary to abide by the rules and regulation set by the administration of country.
Would you invest in this company?
Based on the performance and evaluation of ratios, I would not invest in the stakes of business and rather look for better alternatives which has higher chances of geniting revenue. The major concern for me is declining EPS and ROE which are two critical areas depending on which a company can the performance is assessed. Also, the shares are trading lower than market value which is another red signal for the company.
• References/Bibliography
Alipour, M., Mohammadi, M.F.S. & Derakhshan, H., (2015). Determinants of capital structure: an empirical study of firms in Iran. International Journal of Law and Management.
AREAS, B., (2018). Financial analysis. growth, 30, p.10.
Arkan, T., (2016). The importance of financial ratios in predicting stock price trends: A case study in emerging markets. Finanse, Rynki Finansowe, Ubezpieczenia, (79), pp.13-26.
Ball, R., Gerakos, J., Linnainmaa, J.T. & Nikolaev, V.V., (2015). Deflating profitability. Journal of Financial Economics, 117(2), pp.225-248.
Begacheese.com.au 2021. Home - Bega Cheese. [online] Retrieved from: https://www.begacheese.com.au/
Bunker, R.B., Cagle, C. & Harris, D., (2019). A Liquidity Ratio Analysis of Lean vs. Not-Lean Operations. Management Accounting Quarterly, 20(2), pp.10-16.
Garanina, T.A. & Belova, O.A., (2015). Liquidity, cash conversion cycle and financial performance: case of Russian companies.
Ichsani, S. & Suhardi, A.R., (2015). The effect of return on equity (ROE) and return on investment (ROI) on trading volume. Procedia-Social and Behavioral Sciences, 211, pp.896-902.
Kanapickien?, R. & Grundien?, Ž., (2015). The model of fraud detection in financial statements by means of financial ratios. Procedia-Social and Behavioral Sciences, 213, pp.321-327.
Kourtis, E., Kourtis, G. & Curtis, P., (2019). Αn Integrated Financial Ratio Analysis as a Navigation Compass through the Fraudulent Reporting Conundrum: Α Case Study. International Journal of Finance, Insurance and Risk Management, 9(1-2), pp.3-20.
Lang, M. & Schmidt, P.G., (2016). The early warnings of banking crises: Interaction of broad liquidity and demand deposits. Journal of International Money and Finance, 61, pp.1-29.
Mitrovi?, A., Kneževi?, S. & Veli?kovi?, M., (2015). RATIO ANALYSIS SPECIFICS OF THE FAMILY DAIRIES’FINANCIAL STATEMENTS. ????????? ????????????, 62(4).
Nofiana, L. & Sunarsi, D., (2020). The Influence of Inventory Round Ratio and Activities Round Ratio of Profitability (ROI). JASa (Jurnal Akuntansi, Audit dan Sistem Informasi Akuntansi), 4(1), pp.95-103.
Olariu, D.B., (2016). Profitability ratio as a tool for bankruptcy prediction. SEA–Practical Application of Science, 4(11), pp.369-372.
Olesen, O.B., Petersen, N.C. & Podinovski, V.V., (2015). Efficiency analysis with ratio measures. European Journal of Operational Research, 245(2), pp.446-462.
Öztekin, Ö., (2015). Capital structure decisions around the world: which factors are reliably important?. Journal of Financial and Quantitative Analysis, 50(3), pp.301-323.
Saputra, A.J., (2019). The Effect Of Liquidity Ratio Leverage Ratio And Activity Ratio In Predicting Financial Distress. Management and Economic Journal, pp.581-592.
Setiawan, H. & Amboningtyas, D., (2018). Financial Ratio Analysis for Predicting Financial Distress Conditions (Study on Telecommunication Companies Listed In Indonesia Stock Exchange Period 2010-2016). Journal of Management, 4(4).
Trenca, I., Petria, N. & Corovei, E.A., (2015). Impact of macroeconomic variables upon the banking system liquidity. Procedia Economics and Finance, 32, pp.1170-1177.
Yapa Abeywardhana, D., (2017). Capital structure theory: An overview. Accounting and finance research, 6(1).

- Assignment - Child Care
- Assignment - Mathematics
- Assignment - Accounting
- Assignment - Auditing
- Assignment - Biology
- Assignment - Law
- Assignment - Management
- Assignment - Nursing
- Assignment - Finance
- Assignment - Computer Science and IT
- Assignment - Humanities
- Assignment - Economics
- Assignment - Statistics
- Assignment - Architecture
- Assignment - Engineering
- Assignment - cookery
- Assignment - Marketing
- Case Study - Chemistry
- Case Study - Accounting
- Case Study - Law
- Case Study - Management
- Case Study - Nursing
- Case Study - Finance
- Case Study - Computer Science and IT
- Case Study - Engineering
- Case Study - Economics
- Case Study - Biology
- Case Study - Auditing
- Case Study - Marketing
- Case Study - Project Management
- Coursework - Diploma
- Coursework - Accounting
- Coursework - Auditing
- Coursework - Biology
- Coursework - Management
- Coursework - Nursing
- Coursework - Finance
- Coursework - Computer Science and IT
- Coursework - Engineering
- Coursework - Humanities
- Coursework - Child Care
- Coursework - Project Management
- Coursework - Economics
- Coursework - Cookery
- Coursework - Law
- Dissertation - Accounting
- Dissertation - Auditing
- Dissertation - Biology
- Dissertation - Law
- Dissertation - Management
- Dissertation - Nursing
- Dissertation - Finance
- Dissertation - Computer Science and IT
- Dissertation - Humanities
- Dissertation - Economics
- Essay - Politics
- Essay - Childcare
- Essay - Accounting
- Essay - Biology
- Essay - Law
- Essay - Management
- Essay - Nursing
- Essay - Computer Science and IT
- Essay - Humanities
- Essay - Economics
- Essay - Auditing
- Essay - Engineering
- Essay - Architecture
- Essay - Finance
- Essay - Science
- Essay - Marketing
- Programming - Computer Science and IT
- Reports - Management
- Reports - Computer Science and IT
- Reports - Project Management
- Reports - Marketing
- Reports - Nursing
- Reports - Engineering
- Reports - Accounting
- Reports - Humanities
- Reports - Finance
- Reports - Architecture
- Reports - Biology
- Reports - Economics
- Reports - Childcare
- Reports - Law
- Research - Accounting
- Research - Auditing
- Research - Biology
- Research - Law
- Research - Management
- Research - Nursing
- Research - Finance
- Research - Computer Science and IT
- Research - Science
- Research - Engineering
- Research - Humanities
- Research - Economics
- Research - Project Management
- Research - Statistics
- Research - Architecture
- Research - Marketing
- Thesis Writing - Computer Science and IT
- Thesis Writing - Engineering
- Thesis Writing - Biology
- Thesis Writing - Finance
- Thesis Writing - Humanities
- Thesis Writing - Auditing
- Thesis Writing - Economics
- Thesis Writing - Law
- Thesis Writing - Nursing
- Thesis Writing - Accounting
- Thesis Writing - Architecture


.png)
~5.png)
.png)
~1.png)


.png)


