BUS5DWR Data Wrangling and R Report 2 Sample
Assignment Details
Objective:
The main goal of this assignment is to perform a comprehensive analysis of the Dubai Real Estate Transactions of first six months in 2023 using R. Through careful data wrangling and analytical techniques, you will extract meaningful insights about the Dubai Real Estate market.
Your analysis will focus on:
- Identify trends in the types and volumes of real estate transactions.
- Highlight price trends across different property types and neighborhoods.
- Assess market activity over time, analyzing transaction fluctuations.
- Provide strategic recommendations based on your findings that can help guide real estate investment and development decisions.
Part 1: Data Wrangling & Exploration
1.1 As a data analyst, write a brief description (1 paragraph) on your initial approach to extracting meaningful insights from the Dubai Real Estate Transaction dataset. What challenges might arise during the early stages of analysis?

1.3 Identify columns with missing values. Instead of removing rows, explain two methods you would use to handle missing data related to the columns you identified and apply one method to fill in missing values for one selected column and show the dataframe.
1.4 In real-world datasets, inconsistencies in data are common and need to be addressed. The room column appears to have some inconsistencies. Analyze the data and fix the inconsistencies.
1.5 You are interested in counting the number of sales matches the below criteria:
1.6 Identify potential outliers in the amount column. Choose and apply an appropriate method for dealing with these outliers. Explain why you chose this method. (2 marks)
1.7 Create two new columns that extract the day, month from the transaction date
1.8 Define a function in R that takes the property size in square meters (property size sqm) as input and categorizes properties into three categories:
1.9 Group the data by property type and calculate the average property size sqm for each property type. Provide a brief insight based on the results. (3 marks)
1.10 Calculate the average propety sale price categorized by property subtype and present the results in descending order. What insights can be derived from this analysis?
Part 2: Market Trend Analysis & Strategic Insights
2.1 Use a histogram to analyze the distribution of the amount (property sale price) .
(a) Use a histogram to visualize the distribution of property sale amounts. Ensure the bins are appropriately adjusted to highlight key patterns in the data.
(b) Based on the histogram, provide insights into the distribution of property sale amounts. Are there any noticeable patterns or trends?
2.2 Using appropriate visualization (i.e bar graph), analyze transaction count based on room types.
(a) Create an appropriate visualization to view the transaction count based on room types (e.g., 1 B/R, 2 B/R, studio). Ensure the graph clearly shows the transaction count for different room types.
(b) Analyze the visualization and discuss the insights based on visualisation. 2.3 Using appropriate visualisation/s, analyze transaction count for the top 10 areas.
2.3 You are interested in analyzing whether the nearest landmark has a significant impact on the amount (property sale price) and the subtype of properties (i.e Flat, villas) sold in these areas.
(a) Using appropriate visualisation/s, compare property sale prices based on different nearest landmarks. Ensure the visualization clearly displays any patterns or differences.
(b) Is the dominant property subtype consistent across all landmarks, or does it vary depending on the proximity to different landmarks? (Displaying the data of dominant property subtype is sufficient)
2.4 You are interested in analyzing the monthly sales of top 10 property subtypes (e.g., flats, villas, townhouses) to discover insights. Using the new month column created from transaction_date, visualize the total number of property sales per month, based on top 10 property subtypes.
(a) Using appropriate analytic and visualization techniques analyse monthly sales grouped by property subtypes.
(b) Based on the visualizations, discuss any noticeable trends or insights you can extract.
Solution
Introduction
The Dubai real estate market, which has grown and developed swiftly and includes various transactions, calls for insights based on existing research. This case study is based on a transactional analysis of data gathered on the property market within the first half of 2023. Knowledge of these mechanisms is essential for making correct investment choices and forecasting a perspective evolution of quotes.
Objectives
- To assess patterns of transactions and define trends in the Dubai real estate market.
- To compare the sales prices of the different types of properties and to measure the changes that happen in the market at different periods.
- To support investment decisions regarding the promotion of business initiatives with clear growth strategies and statistics.
Dataset
The dataset sample size is more than 81000, and the data specifies the real estate sales in Dubai within the 1st half of 2023. Some of the rich fields that it contains include “transaction number”, “date of transaction”, “type of property”, “size”, “amount of transaction”, and “location”. Further specifications with the “number of rooms”, “parking”, “close metro”, and “mall” facilities help in the elaborative study of market transactions. The implication of this particular dataset of transaction frequency, price fluctuation and investment potential by type of property and neighbourhood is a unique resource that enables strategic decision-making at a time of significant market volatility.
Part 1: Data Wrangling and Exploration
1.1
The first stage in dealing with the Dubai Real Estate Transaction dataset is data preprocessing and visualization. This involves dealing with cases of missing data; cleaning up errors; and managing variables such as property size and transaction value (Piryonesi and El-Diraby, 2020). Some of the difficulties include handling missing values, peculiarities in the variance of goods’ values, and variations in categorical variables such as property type, or room numbers for the assignment helpline Besides, the required accuracy of the data especially when dealing with many transactions can interfere with the analysis process (Hu et al. 2021). All these early-stage issues need to be sorted out to obtain clear and valuable data helpful in investment decisions.
1.2
.png)
Figure 1: Summary of Data
(Source: R Studio)
The dataset has in total of 81,601 records and the attributes of the dataset include among others, transaction number, amount, and size of property in terms of square meters. All but “amount” and “property size sqm” are categorical while these two are quantitative with very high variability. For example, the transaction amount varies from 57 to more than 3.8 billion and therefore, it also contains outliers. Moreover, there is have missing value in the “property size sqm” column. The diversity of this data set creates many possibilities for studying pricing and room categorization as well as area specificities to make market-oriented decisions.
1.3
![]()
Figure 2: Removing Null Values
(Source: R Studio)
Two typical strategies for dealing with missing data are to replace numerical “imputing to the median” because it is not sensitive to outliers and to “apply the mode to categories”. From the dataset, missing values in property_size_sqm were imputed by the median since dropping some of the observations might in essence distort the result set.
1.4
.png)
Figure 3: Unique Value and Fixing Consistency
(Source: R Studio)
The image illustrates the cleaning of room column where raw observations include “1 bedroom” and “3 bedroom” are standardised to “1 B/R” and “3 B/R” respectively Non-residential values are excluded including “Shop” and “Office”. This makes it easier to maintain consistency in the representation of data hence enhancing the accuracy of analysis regarding room types and characteristics of any given property.
1.5
a)
.png)
Figure 4: Countling the Sales
(Source: R Studio)
The image shows filtering of property transactions that are located in the area containing “bay” (CASE INSENSITIVE) and gave 5482 hits. This depicts sales of a high number in bay related areas suggesting the need or probably popularity of such developments in such areas.
b)
.png)
Figure 5: Countling the Sales
(Source: R Studio)
The attached image displays the filter of property sale located either in an area that includes the words Jumeirah and/or Marina with a sale size exceeding 100 sqm. The study also revealed that there were 8,051 transactions in these areas, showing their activerx market, especially for properties of this size. Perhaps these regions are considered to be either prime or high usage areas.
1.6
.png)
Figure 6: Outliers using Box plot and removal of outliers
(Source: R Studio)
This is evidenced by the boxplot for property sale amount that shows potential outliers in these values and values that may go up to 4 billion or more. The code uses the IQR to outliers and filters with bounds for amounts beyond this context, which came from the interquartile range. This improves the generalisability of the data set because analyses are conducted on standard or average transactions that are not distorted by outliers.
1.7
.png)
Figure 7: Mutating Date Column
(Source: R Studio)
The code is used to change the type of transaction date column into date format and also make two new columns day and month. It can be used to analyze the transaction cross-section over one day and month to establish the potential transition of transaction surge period or property sales on a seasonal basis.
1.8
.png)
Figure 8: Categorising and Function
(Source: R Studio)
The code assigns a function that partitions properties into three categories Small if they measure less than or equal to 500 square meters, Medium if they are more than 500 square meters but less than or equal to 1500 square meters, and Large if they are more than 1500 square meters. The function is used on the dataset by creating a new column named “property size category”. The first five rows ensure modification of the data for analysis of the size of the properties; together with the insights for the investors interested in specific property types.
1.9
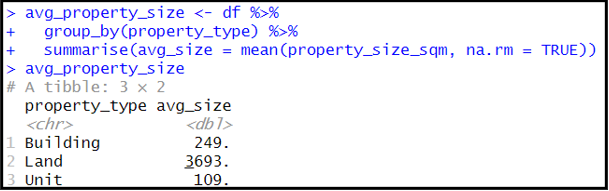
Figure 9: Average Property Size
(Source: R Studio)
The code ideally splits the data according to the property_type where it computes the Mean property size for each property type. The study found that land properties possess the largest average size of 3693 sqm while buildings with 249 sqm and units of 109 sqm. This analysis reveals the variation in size of different property types, which is useful in identifying property investment opportunities depending on space.
1.10
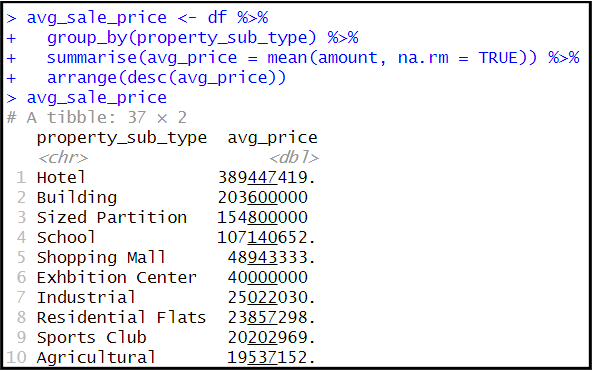
Figure 10: Average Sale Price
(Source: R Studio)
The code then computes the average of the sale prices for each property subtype arranged in a descending manner. Hotels have the largest number on average price at 389.4 million, again followed by buildings and partitioned properties. This can be seen from the significant differences in the property values for subtypes, using the example of commercial and specialized properties that are more expensive than residences, including flats and agricultural land.
1.11
![]()
Figure 11: Filtering
(Source: R Studio)
The code searches through properties in the Jumeirah which are FLATs and cost not more than 2000000, of 2 bedroom and freehold tenure. This selection focuses on investing in mid-ranked assets in the best area for those investors who are searching for stable and cheap properties. Such criteria increase the chances of consistent revenues because Jumeirah’s market value is high and the need for residential flats continues to rise.
Part 2: Market Trend Analysis & Strategic Insights
2.1
a)
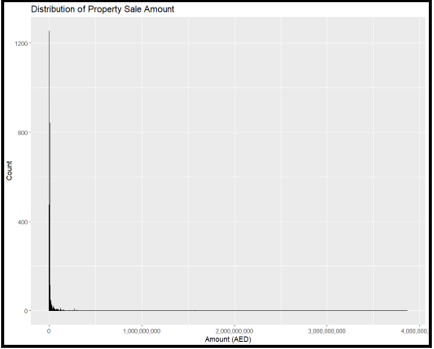
Figure 12: Distribution of Property Sale Amount
(Source: R Studio)
The histogram provided below displays the amounts of property sales in Dubai and it is quite clear that there are a large number of sales that occurred in comparatively less amount and as we go to higher amounts, there is a drastic decrease in the number of transactions. The market of properties can be considered quite active, as most of the properties being sold are of values below 1 billion. Approximately 3.9 billion are made up of a small number of very large or luxury items, including commercial transactions. These skew the distribution, pointing to the fact that the market is diverse, as shown in the figure above.
b)
This indicates a dichotomy in the market a large number of lower-priced or middle-range properties that are affordable by a large pool of potential consumers with a relatively smaller number of high-value deals for luxury consumers. To stakeholders, these extremes are beneficial when planning for investment solutions, where market solutions are continuously liquid and are differentiated from luxury that deals with high-end individuals. Such analysis is important in providing a prognosis of the best investment strategies for the returns to be realized in a volatile market.
2.2
a)
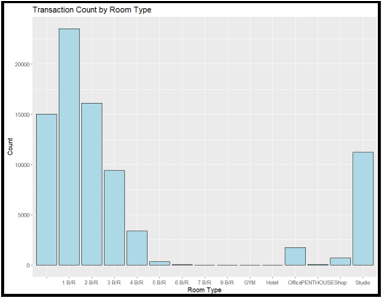
Figure 13: Count of Room Type
(Source: R Studio)
The bar chart depicting the transaction given by the room type depicts that there are much higher transactions than 2 B/R (two-bedroom) than 1 B/R and studio apartment. The number of transactions of properties with three or more bedrooms is relatively lower. While analyzing the results the respondents’ preferences for studio apartments are evident and can probably be attributed by it has higher demand due to cost and demand for rentals (Asquith et al. 2023).
b)
Notably, there are few transactions for luxury items like; the penthouses, huge flats with five or more bedrooms, and commercial structures like offices and retail shops. The higher stock percentage for smaller residential units includes 1 B/R, 2 B/R and Studio because Dubai continues to experience increasing demand in mid-segment and affordable housing more so by the expatriates and young people. This insight informs the finding that investors who focus on smaller properties have higher liquidity and demand whereas the premium, large properties are likely to be sold to speciality buyers or long-term investors who wish to make high-value gains.
2.3
a)
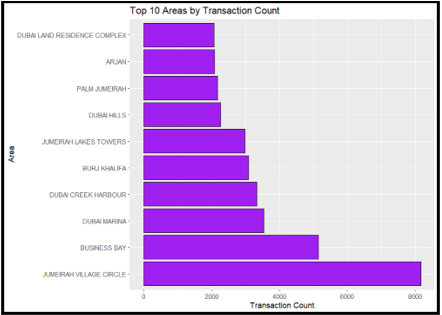
Figure 14: Transaction Count
(Source: R Studio)
The bars in the chart represent the 10 regions in Dubai with the highest count of transactions; Jumeirah Village Circle has the most transactions followed by Business Bay and Dubai Marina. These areas are generally characterized by integrated use and have been the most affordable and competitive for investors as well as buyers.
b)
Business Bay and Dubai Marina have also recorded market activities due to their business-friendly locations and lifestyle properties. However, locations such as Burj Khalifa and Palm Jumeirah record relatively low numbers of transactions mainly because they are on the high end and property prices are relatively expensive (Al-Kodmany, 2024). This implies that though there are luxury properties which are good investment tools there are mostly ‘mid-market’ stocks in well-located, easily accessible areas which drive the market. This insight is so comforting to investors targeting sectors of the market that attract most transactions, hence greater liquidity, and thus safer investment options that yield quick results.
2.4
a)
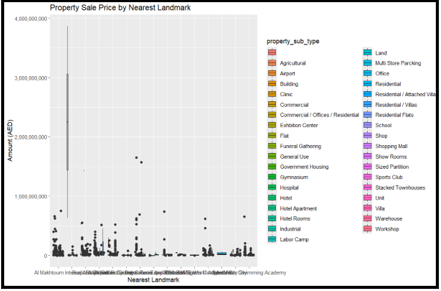
Figure 15: Property Sale Price by Landmark
(Source: R Studio)
b)
The subtype of property most dominant is not the same depending on how close it is to different structures. A number of commercial properties like offices and hotels are available close to special landmarks like airports whereas a large number of residential flats are available close to general like malls. It shows that location plays an important role in determining the kinds of properties and market forces in any given market.
c)
Location plays a major role in the revaluation, and properties closer to such attractions attract higher prices than those located in industrial or residential areas which contain airports and business accommodations respectively. On the other hand, residential flats close to general landmarks such as malls have moderate pricing implicating a different trend between the type of a landmark and the price of a property.
2.5
a)
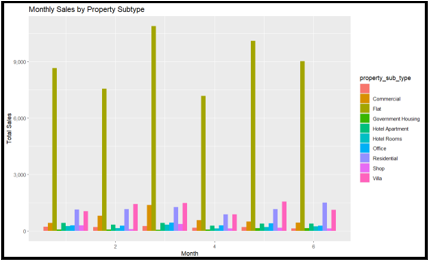
Figure 16: Monthly Sales By Property Subtype
(Source: R Studio)
The bar chart illustrating monthly sales distribution by property subtype reveals that the category of flats stands as the most popular one each month and this signifies that the market for residential flats remained active the entire year. Other subtypes like villa, commercial and residential properties are also much less volatile but show comparatively less variation.
b)
This means that flats are more popular as the property to rent or buy throughout the year thus closing more deals, commercial and residential properties have minimal and stable rates of sales, proving the fact that it is rather in greater demand than flats.
Conclusion
The examination of Dubai’s real estate also reveals that the demand for flats is high while other types have a limited market. The strategic view shows prices changing in proximity to landmarks and helps investors make more informed decisions for the greatest profitability.
References

- HI5020 Corporate Accounting Assignment
- HT5006 Childrens Language and Literacy Essay 2
- ACCM4300 Financial Reporting
- Statistical Analysis Assignment
- TBUS610 E Business Strategies Assignment
- BC400 Communication and Media Management Report 2C
- TSM11105 International Tourism Assignment
- CL4304 Public Law Assignment
- Novel Protein Acherons Distribution Using Fluorescence Microscopy Assignment
- MITS5501 Software Quality Change Management and Testing Report 2
- MBA623 Healthcare Management Case Study
- MATH11247 Foundation of Mathematics Assignment
- ACCT6005 Company Accounting Case Study
- Project Management Workshop Assignment
- LAWS20058 Australian Commercial Law Assignment
- MANU1381 Sustainable Engineering Systems and Environment Assignment
- BUS3004 Corporations Law T1 2023 Essay 1
- Research and Data Modelling Assignment
- Internet Use and Economic Development Evidence and Policy Implications Assignment
- Early Childhood Education Assignment


.png)
~5.png)
.png)
~1.png)


.png)


