MEM602 Engineering Risk Management Case Study 3 Sample
Task Summary
To complete this assessment, you will identify TWO significant process-based risks as prioritised and listed in the Risk Register (Assessment 2). You are to draw upon the data provided in ALL six modules and provide discussion in the form of a Technological Report of 2,500 words (+/- 10%) as to why these risks are significant for the organisation.
Technology Report criteria:
Refer to the Case Study. Take into account ALL of the case’s context;
1. Identify TWO significant process based risks as prioritised and listed in the Risk Register (Assessment 2);
2. Provide discussion as to why they are deemed as significant;
3. Use the following technological risk sequencing and evaluation techniques (A and B) to further this discussion:
A. Adopt a Decision Tree Analysis (DTA) approach and answer the following questions:
i) What is the decision that must be made;
ii) Identify two significant Process-based risks (for Option A and Option B);
iii) Identify two expected scenarios that focus on the risk’s use of controls with each of these options (an opportunity scenario with the use of risk controls and a deviation away from objectives due to use of risk controls) and the likelihood of each scenario;
iv) determine an expected outcome for each of these scenarios
B. Using the same process-based risk or an alternative (as per level of significance and priority identified in the risk register) apply an Event Tree Analysis (ETA) to determine the functioning/not functioning of the risk controls to mitigate this risk’s consequences. Your lecturer/facilitator will be able to assist in formulating your.
Report structure:
1. Executive Summary (what is the purpose and nature of the report);
2. Contents page;
3. Introduction - Background information;
4. Body (as outlined in Technology Report Criteria);
5. Conclusion;
6. Recommendations;
7. List of References;
8. Appendices
Assessment criteria and weighting is as follows (also refer to the assessment rubric).
1. Group presentation of concepts: 20% of this assessment
2. Analytical depth and discussion of technological risks: 35% of this assessment
3. Critical thinking and reflection: 35% of this assessment
4. Communication of ideas /quality of the style and structure of the response: 10% of this assessment.
Types of media used:
All assessment submissions must be in the form of a written report. The report can be supported by the following types of media:
• static imagery;
• Panopto video;
• PowerPoint slides;
• MPV video
Solution
Introduction
Regular inspections are essential to guaranteeing the dependability and durability of our fleet of vehicles in the face of a dynamic operating environment. The background information and importance of Preventive Maintenance Programs (PMPs) in reducing the risks of machine failures are highlighted in the introduction. For Assignment Help, It emphasizes the financial and operational ramifications of ignoring routine inspections, laying the groundwork for the analysis that follows. A fleet of vehicles' overall productivity and efficiency can be negatively impacted by skipping routine inspections, which can also result in expensive repairs and downtime. It may also present a safety risk to motorists and other users of the road if possible problems are not found and fixed quickly. The report explores the results of several analytical techniques used to explore the complexities of the inspection routine risk, including the Pareto chart, decision tree analysis, process mapping, and event tree analysis. The introduction establishes the context for a thorough examination of the ways in which these analyses provide insights and suggestions to strengthen our preventive maintenance strategies.
The first chosen processed based risk to be evaluated from our risk register is the first on the list which is that of inspection routine.
It is deemed worthy of attention because for the following reasons:
a. On-time routine inspection is vital as it puts in check the risk of any negative surprises that might occur in a machine or equipment, in this case, the vehicles. This is highlighted by Al-Refaie & Almowas (2023, p. 51) as the aim of any Preventive Maintenance Program (PMP) is to minimize as much as possible, the cost of repair and equipment downtime. When this is tackled properly, it results in increase in the useful life of these vehicles, as well as enhancing their systems’ availability. On the other hand, failure to prioritize and treat such risk would lead to lost production capacity or reduced product quality.
b. Secondly, Pirbalouti et al. (2023, p. 1) defines major accidental hazards (MAHs) as hazards that can damage human health environment, damage installations, as well as lead to an organization’s reputation loss. Neglecting this risk of late inspection routine could be detrimental as it can possibly lead to MAH(s).
c. Finally, the occurrence of any or both previous two instances could have a detrimental effect on the image of an organization.
In analysing the above risk, we adopt a Decision Tree Analysis (DTA). In doing so, we follow the method as outlined by Ostrom et al., (2012, p. 172). Firstly, we create an accident classification table by allocating classes to the above possible accidents, describing them, and assigning them costs. This is tabulated below:
.png)
Next, we create a table for the probability of these accidents occurring as depicted below:
.png)
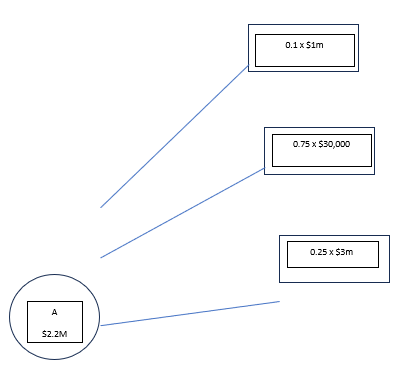
System A
0.1 x $1,000,000 = $100,000
0.75 x $30,000 = $22,500
0.25 x $3,000,000 = $750,000
Total cost = $100,000 + $22,500 + $750,000 = $872,500
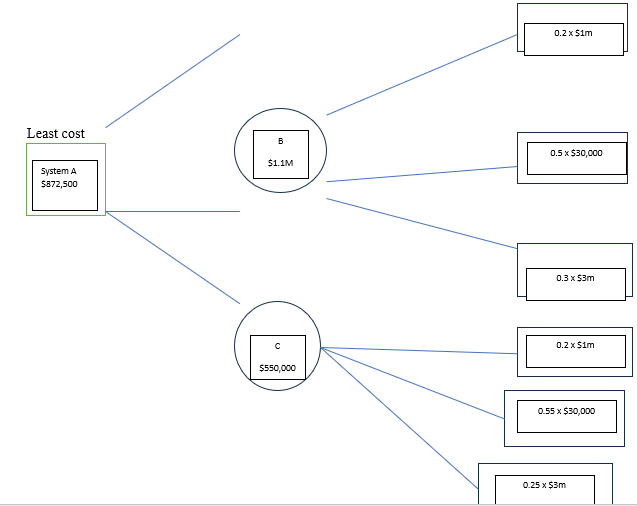
System B
0.2 x $1,000,000 = $200,000
0.5 x $30,000 = $15,000
0.3 x $3,000,000 = $900,000
Total cost = $200,000 + $15,000 + $900,000 = $1,115,000
System C
0.2x $1,000,000 = $200,000
0.55 x $30,000 = $16,500
0.25 x $3,000,000 = $750,000
Total cost = $966,500
From the above analysis, it clear that system/policy A is the way to go.
Representing this analysis in a Decision Tree is shown in the figure below:
NOTE: Still ETA is pending for risk 1, my group mate will add.
Apareto chart is pending my group mate will add
Process mapping.
RTS carried out process failure mapping to identify inefficiencies, challenges, and opportunities to improve their PM process. A flow chart was used to streamline the PM activities and create opportunities for in-depth evaluation. Furthermore, a Pareto chart deployed to aid detail the primary concern of the PM process.
Figure 1.0.
RTS PM Process
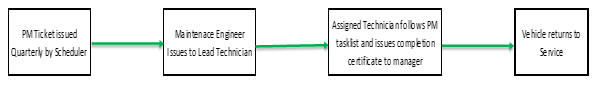
Note: Flow chart created by the authors.
Figure 2
Failure mapping within the PM process.
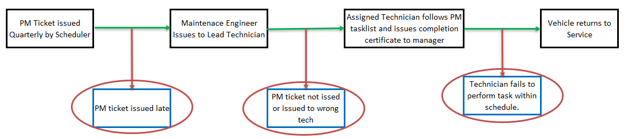
Note: Flow chart created by the authors.
RTS PM pareto evaluation.
Pareto chart performed on RTS PM process indicated that the 80% of the PM challenge are from PM ticket issued late, PM ticket not issued, and PM issued to wrong technician. These issues were analyzed using Decision Tree Analysis (DTA) and Event Tree analysis (ETA). To resolve part of the issues identified, RTS needs to implement an automated system that sends reminders to the manager a day before a task is scheduled for completion. Lastly, integrate a feature in the scheduler to incorporate a latest finish time on the job ticket, enabling the scheduler to notify the manager when this deadline is approaching (see recommendation section).
Figure 1.0
RTS PM pareto chart
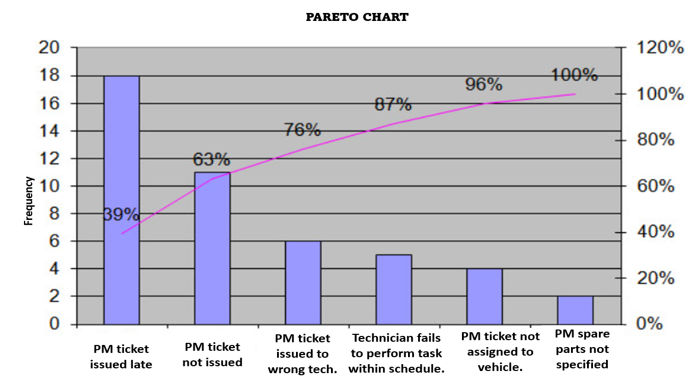
Note: Nic, (2021). The Pareto Principle (80-20 rule) explained. https://www.paretolabs.com/the-pareto-principle-80-20-rule-explained/
Figure 1.0
Decision Tree Analysis
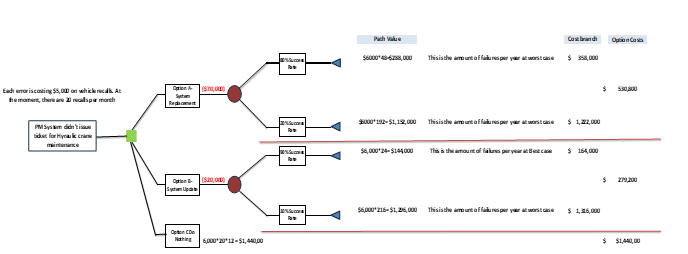
Option A Path Value
Path Value 80% success rate =6000*(100-80)/100) *12*20) = 6000*(20/100) *12*20= 6000*48 = $288,000.
Path Value 20% success rate = 6000* ((100-20)/100) *12*20) = 6000*(80/100) *12*20 = 6000*192 = $1,152,000.
Option B Path Value
Path Value 90% success rate =6000*(100-90)/100) *12*20) = 6000*(10/100) *12*20= 6000*24 = $144,000.
Path Value 10% success rate = 6000* (100-10)/100) *12*20) = 6000*(90/100) *12*20 = 6000*216 = $1,296,000.
Option A Cost Branch
Cost branch = Total cost + Path Value
Option A1 = 70,000+288,000 = $358,000
Option A2 = 70,000+1,152,000 = $1,222,000
Option B Cost Branch
Option B1 = 20,000+144,000 = $164,000
Option A2 = 70,000+1,296,000 = $1,326,000
Option Cost
Option A.
Option cost = Cost branch*success rate (%) A1 + Cost Branch*success rate (%) A2
Option cost = (358,000*80%) +(1,222,000*20) = $530,800
Option B.
Option cost = Cost branch*success rate (%) B1 + Cost Branch*success rate (%) B2
Option cost = (164,000*90%) +(1,316,000*10) = $279,200
Option C.
Option cost = $1,440,000
From the above computations, Option B ($279,200) is a viable option for RTS to choose based on the DTA outcome.
Maintenance activities are routinely & integral part of the ETA business processes commonly employing a variety of tools such as hand tools, mechanical devices, electronic instruments, lift equipment, and more. However, the utilization of these tools introduces a notable level of risk. Event Tree Analysis (ETA) emerges as a systematic approach to identifying potential accident scenarios and sequences within complex systems. ETA, employing an inductive methodology, meticulously delineates all conceivable outcomes stemming from an accidental (initiating) event. It takes into account the operational status of safety barriers and factors in additional events and considerations. By utilizing ETA, potential vulnerabilities in the design become apparent, allowing for a comprehensive assessment. This assessment facilitates the implementation of appropriate mitigating measures, enhancing overall safety in the maintenance process (Rausand, 2004).
Figure 1,0
Event tree Analysis
.png)
Note: Rausand, M. (2004). System reliability theory; event tree analysis.https://www.ntnu.edu/documents/624876/1277590549/chapt03-eta.pdf/6f3e1b19-4824-4812-adc8-9762d2201c22
PM System failed to lodge Hydraulic Lift Crane for maintenance.
One of the risks higher than maintenance is absence of maintenance of equipment or tools. RTS have a high chance of experiencing a disastrous hydraulic lift collapse within the maintenance activities due to negligence and notable knowledge gap within the operators of this high-risk equipment. The initial challenge identified on the ETA is the PM system failure to lodge hydraulic crane for maintenance. This
The practical application of Event Tree Analysis (ETA) for the given scenario involving a Hydraulic Lift Crane. The sequence of events can be analyzed as follows:
Initiating Event: PM System Failure to Lodge Hydraulic Lift Crane for Maintenance.
This event marks the beginning of the analysis. The preventive maintenance (PM) system fails to schedule the required maintenance for the Hydraulic Lift Crane.
Branche 1- Failure of PM System
PM system failure could be attributed to various reasons such as technical glitches, human error in data entry, or system malfunction that could. This problem could possibly be avoided by taking proactive measures in training employees, system auditing and upgrade to avert human error or negligence. These measures could minimize the likelihood of the undesirable event and promote safety and reliability of the equipment.
Branch 2: Crane Not Maintained
PM system failure could possibly lead to neglect of routine PM operations, thereby translating into late or missed maintenance of the equipment. If the crane is not subjected to the necessary maintenance tasks, it could possibly lead either of the two possible outcomes- triggers the maintenance caution system to signal overdue maintenance schedule or failed caution signal.
Branch 2.1: Warning Not Activated
There's high level safety concern in the event of this failure mode. One critical aspect is the activation of warning systems to alert the maintenance team. If the mechanism that generates alerts regarding the crane's maintenance state fails, the safety precautions are further compromised, leading to a more dangerous situation.
Branch 2.2: Safety Lock Failed
In the absence of maintenance, the failure of a safety lock could be a critical failure point. Safety locks are crucial mechanisms to prevent accidents during crane operations. It is the last line of defense before final breakdown of the equipment. At this point, the outcome is often undesirable and very expensive.
Outcome: Crane Collapsed
The culmination of these events could result in the catastrophic failure of the machinery. In the event collapse occurs, it could possibly result in additional damage to the equipment, the environment, and the potential loss of life of personnel(s) caught up in the case of this disaster.
In practical terms, this Event Tree Analysis helps identify failure mode and their potential consequences. It allows for a systematic evaluation of the factors contributing to the functional failure. This analysis becomes evident that the breakdown in the PM system, lack of maintenance, and failures in warning systems and safety locks are all critical elements that, when combined, lead to the ultimate failure of the crane. Implementing ETA in this scenario enables proactive identification of weaknesses in the maintenance and safety systems, providing an opportunity to address these issues before they escalate into a major incident like a crane collapse (Hulett, 2006).
Recommendation
i. Implement robust preventive maintenance Program (PMP) that prioritizes timely routine inspection to minimize repair cost, reduce equipment downtime, and extend useful life of equipment.
ii. Adapt system A to ensure highest degree of safety, and probability of major accidental hazards (MAHs)
iii. Implement regular system audit, system upgrade, and employee training to minimize human error.
iv. Regularly assess the risk management strategies and make necessary changes to align with business objectives.
v. Adopt comprehensive reporting and documentation system for all maintenance activities.
Conclusion
In conclusion, the analysis of the routine inspection risk highlights how crucial it is to take proactive preventive action. The Decision Tree Analysis directs us toward a system or policy that maximizes overall safety while simultaneously reducing expenses. Our PM process's main obstacles are highlighted by the Pareto chart, which directs us toward focused enhancements. We can efficiently allocate resources and prioritize our efforts to address the most critical issues in our preventive maintenance process by combining the insights from the Pareto chart and Decision Tree Analysis. This all-encompassing strategy makes sure that we are minimizing possible risks in addition to cutting expenses, which eventually results in a safer and more effective operation. While event tree analysis reveals the potentially disastrous effects of a PM system failure and motivates us to give system audits and employee training top priority, process mapping reveals inefficiencies. The recommendation section highlights the need to strengthen our defenses against the risks identified as we navigate these revelations by implementing a strong preventive maintenance program, upgrading our systems, and providing training to our employees. This report acts as a compass, pointing the way toward a proactive and robust approach to risk management and maintenance within our operational environment.
Reference
.png)

- MBA621 Healthcare Systems Report 3
- Taxation Law Assignment
- BE284 Strategic Management Assignment
- ACCT6007 Financial Accounting Theory and Practice Report
- MIS501 Principles of Programming Learning Activity Assignment
- ENGR9704 Engineering Management Assignment
- EC301 Agriculture and Resource Policy Report 2
- MKTG10001 Principles of Marketing Assignment
- PUBH6013 Qualitative Research Methods 3A Report
- ACC601 Introduction To Financial Accounting Assignment
- MK400 Agribusiness Marketing Report 3
- GDECE103 Language and Literacy Assignment
- TITP105 The IT Professional Assignment
- HEAPH6007 Public Health Ethics Assignment
- MKT101A Marketing Fundamentals Assignment
- BUS5DWR Data Wrangling and R Report 2
- MCRIT010 Innovation and Commercialisation in IT Report 3
- BUECO5903 Assignment
- EDU30064 Teaching Science Report 2
- AURETR010 Repair Wiring Harnesses Looms Assignment


.png)
~5.png)
.png)
~1.png)


.png)


