ENEM28001 FEA for Engineering Design Report 2 Sample
Task Description:
The goal of this assessment is to test your ability to use ANSYS Workbench®.
You will develop a portfolio of 5 workshops as indicated below. Marks as indicated.
Workshop 1: 2D Analysis of Rack and Pinion System
Carry out a full analysis of the workshop, including the extension tasks on the last slide. In addition, insert a contact tool and examine the nature of contact between the rack and the pinion.
Workshop 2: Meshing
Carry out the meshing workshop using the various meshing methods in ANSYS Workbench.
Workshop 3: Transient Thermal Analysis
Carry out the workshop on phase change heat transfer analysis.
Workshop 4: Stresses due to Shrink fit between 2 cylinders
A hollow cylinder is shrink fitted in another. Both cylinders have a length, ‘l’. The flat surfaces of both cylinders are constrained in the axial direction while free to move in the radial and tangential directions. An internal pressure, P is applied on the inner surface of the inner cylinder. Assume all dimensions and pressures.
1. Set up an FE model and examine the maximum tangential stresses in both cylinders.
2. Verify and validate your results using thick cylinder theory.
Hints: (i) Tangential stresses can be obtained by using the cylindrical coordinate system in ANSYS Workbench, (ii) To simulate interference, consider contact type as ‘rough’ with interface treatment set to ‘add off set’ with offset = 0.
Workshop 5: Fatigue Analysis
Submit the workshop on strain-based variable amplitude, proportional load fatigue analysis.
Solution
Workshop 1
1. Introduction
A Rack and Pinion system's performance, safety, and efficiency may be assessed using critical engineering analysis. This research used ANSYS Workbench to analyze a Rack and Pinion system in 2D. Deformation, stress, strain, and rack pinion contact behavior are examined in this investigation. To model real world operating settings, the research uses frictionless support, distant displacement, and other boundary conditions. Rack and pinion systems are used in steering mechanisms in cars and linear motion systems in industrial machines. Understanding their behavior in diverse situations is crucial for design optimization and dependability. For Assignment Help, The Rack and Pinion system's pitch, dimensions, and tooth profiles are correctly modeled to start the study. To replicate the system's operating environment, boundary conditions reflecting physical restrictions and external pressures are introduced. This assesses stress distribution, deformation patterns, and contact behavior to ensure system safety and performance.
This report also examines the project requirements' extension tasks, which investigate advanced system behavior. The rack-pinion interaction may be examined in ANSYS Workbench using a contact tool to reveal frictional forces and contact stresses. This research helps engineers and designers improve the Rack and Pinion system by revealing its behavior. This extensive study's methodology, analytical findings, and conclusions will be explained in the following parts.
2. Problem Description
The goal is to analyze and evaluate a Rack and Pinion system, a common mechanical arrangement in engineering. Understanding the system's deformation, stress distribution, and contact characteristics under varied operating situations is the main goal. ANSYS Workbench is used to model and analyze the system.
A linear rack and rotary pinion gear make up a Rack and Pinion system. Rack, a straight toothed bar, is the linear element, while pinion gear, a circular gear, is the rotary element (ROY, 2021). The mechanism works simply: the pinion gear connects with the rack to turn rotary motion into linear motion or vice versa. Many technical applications use this method. It's used in automobile steering systems to convert the steering wheel's rotating motion into linear motion to operate the front wheels. Industrial automation equipment like CNC (Computer Numerical Control) machines employ Rack and Pinion systems for precise linear positioning.
In such applications, system efficiency and dependability are crucial. Thus, this research analyses its performance under various loads and situations, including deformation, stress, strain, and contact behavior (Bernabei et al. 2022). This study helps engineers and designers optimize the system for performance and durability in various engineering applications.
3. Assumptions for Analysis
In this study, to simplify and simulate the Rack and Pinion system model in ANSYS, various assumptions were made. To model and understand findings efficiently while recognizing real-world system complexity, several assumptions are necessary.
- The study assumes linear elastic behavior for all materials in the Rack and Pinion system. This keeps Young's modulus and Poisson's ratio constant under applied loads. Material nonlinearities like plastic deformation are not studied.
- The study assumes equilibrium and continuous loads. The static analysis ignores dynamic influences like vibrations and transient reactions (Babu et al. 2021).
- They simplified the geometry of the Rack and Pinion components. It assumes flawlessly machined components without tooth profile or surface roughness deviations. Real-world geometry deviations are ignored.
- The study assumes frictionless rack pinion contact. Friction affects system behavior, yet include it complicates analysis. The following analysis may include friction for a more complete picture.
- Assumed isotropic materials have consistent qualities in all directions. This assumption simplifies analysis but may not accurately reflect anisotropic materials.
- Contact analysis assumes linear contact behavior, where contact forces between rack and pinion teeth fluctuate linearly with deformation. We ignore nonlinear contact behavior such as significant deformations or plasticity.
4. Analysis Methods
Performing the analysis, there has been a focus on various functions in the Ansys workbench to understand and analyze the rack and pinion system. The applied methods are described below.
4.1 Geometry and contact tool
.png)
Figure 1.1: Geometry of the Rack and Pinion system
(Source: ANSYS)
Figure 1 shows Rack and Pinion 2D geometry. A linear rack, straight-toothed bar, and pinion gear, circular-toothed gear, are shown. (Vu et al. 2022) Rotary motion becomes linear or vice versa when the pinion contacts the rack. This mechanical arrangement is used in many technical applications.
.png)
Figure 1.2: No separation contact tool
(Source: ANSYS)
Figure 2 shows ANSYS's specialized contact tool for examining rack-pinion contact behavior. This contact tool analyses their interaction, including frictional effects and contact forces, without separating them. This tool improves simulation accuracy, allowing engineers to understand Rack and Pinion system contact mechanics.
4.2 material Assignment and Mesh generation
.png)
Figure 1.3: Material Assignment
(Source: ANSYS)
Performing the analysis structural steel has been assigned as the material of the rack and pinion system.
.png)
Figure 1.4: Mesh generation
(Source: ANSYS)
Figure 4 shows the crucial ANSYS mesh-generating stage. The model is discretized using 1.5 mm elements for accuracy. The computational domain has 5,842 nodes and 1,829 elements from this thorough meshing. Mesh creation is crucial to simulation accuracy and dependability. The mesh's tiny granularity lets engineers examine stress, strain, and deformation patterns to understand the Rack and Pinion system's structural behavior under different situations.
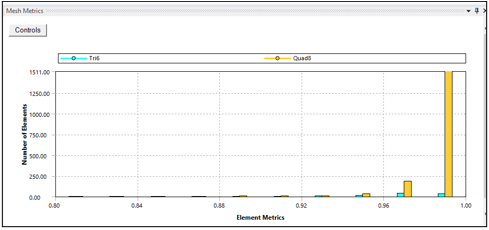
Figure 1.5: Mesh Element Quality Matrices
(Source: ANSYS)
In Figure 5, mesh element quality matrices range from 0.92 to 1, indicating excellent quality. These quality matrices show ANSYS analysis mesh element uniformity and appropriateness. Values near 1 indicate high-quality components, whereas 1 indicates full geometric congruence. This consistency guarantees the mesh correctly depicts geometry and minimizes simulation distortions. Such high-quality parts ensure the analysis's accuracy and dependability, improving the comprehension of the Rack and Pinion system's structural behavior.
4.3 Boundary Conditions
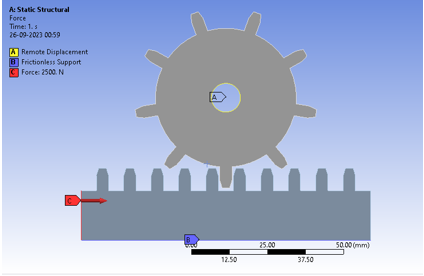
Figure 1.6: Boundary Conditions
(Source: ANSYS)
ANSYS boundary conditions are essential for modeling car rack and pinion steering systems. At point A, a Remote Displacement boundary condition allows the pinion to travel horizontally 30 mm in 1 second. This properly simulates steering wheel rotation, and starting rack action. Point B uses a Frictionless Support to secure the rack to the chassis by limiting all degrees of freedom. This keeps the rack immobile throughout the simulation, imitating its real-world use. These boundary conditions allow the study to derive performance characteristics like the reaction force at the pinion, which affects steering effort. Stress and deformation values of rack and pinion components are also assessed to determine system structural integrity.
4.4 Solver Settings
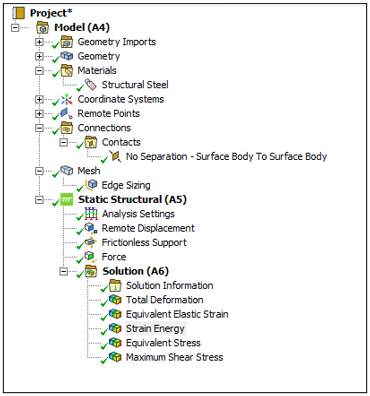
Figure 1.7: Solver Settings
(Source: ANSYS)
The above figure shows the solver setting for the analysis.
5. Results
The Rack and Pinion system's complete ANSYS study reveals its mechanical behavior under different situations. Under properly constructed boundary conditions, this approach explains the system's deformation, stress distribution, and contact mechanics. Similar to a vehicle's steering system, boundary conditions imitate real world events, making these discoveries important to engineering (Khalifa, 2023). These discoveries improve Rack and Pinion system design, efficiency, and safety, advancing mechanical engineering practices and assuring dependable performance in varied engineering settings.
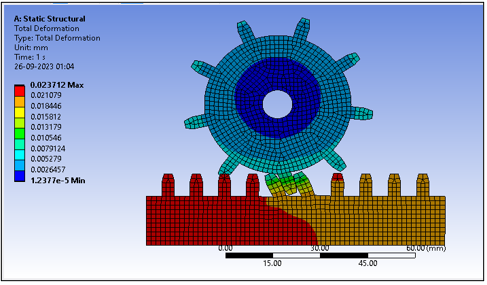
Figure 1.8: Total Deformation
(Source: ANSYS)
Total Deformation analysis, based on boundary conditions, provides valuable insights into Rack and Pinion system structural behavior. The system's minimal deformation value of 1.24E 05 indicates structural integrity under operating loads. Even while 2.37E 02 is high, it's within acceptable limits, showing the system's stress tolerance. The boundary conditions simulate real world circumstances well since the average deformation of 1.20E-02 shows a balanced reaction to applied forces. These findings confirm the system's stability and give crucial data for design and safety improvements.
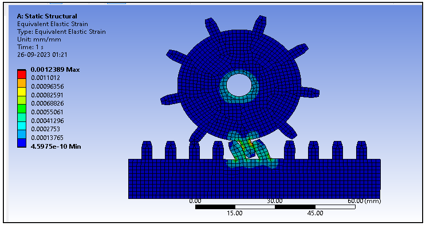
Figure 1.9: Elastic Strain Distribution
(Source: ANSYS)
Elastic Strain Distribution study inside the boundary conditions exposes Rack and Pinion system deformation properties. Under these circumstances, the minimum elastic strain is 4.5975e 010, indicating structural stability. The maximal score of 1.2389e 003, albeit higher, is within an acceptable range, suggesting moderate stress tolerance. At 5.7506e 005, the average elastic strain balances applied forces, proving that boundary conditions simulate real-world events. These insights aid system dependability and design optimization.
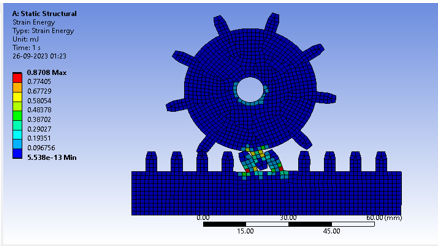
Figure 1.10: Strain Energy
(Source: ANSYS)
Strain Energy measured in mJ (millijoules) provides valuable insights into the Rack and Pinion system's mechanical behavior under defined circumstances. Little energy contribution of 5.54E-13 mJ suggests little system deformation or strain. However, the highest value of 0.8708 mJ, although larger, is within an acceptable range, reflecting the system's energy absorption and release. The system's energy distribution is balanced by the average Strain Energy of 29.585 mJ. These findings verify the system's structural integrity, aiding design and performance evaluation.
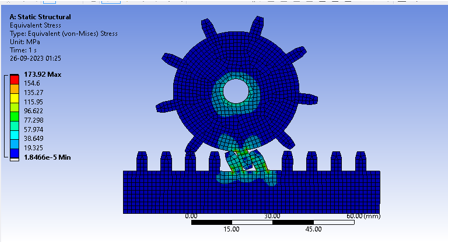
Figure 1.11: Equivalent Stress
(Source: ANSYS)
Equivalent Stress, measured in MPa (mega pascals), gives essential insights into the Rack and Pinion system's mechanical behavior under boundary circumstances. Minimum stress of 1.85E-05 MPa indicates exceptionally low stress levels, indicating a safe and stable system. While greater, the maximum stress measurement of 173.92 MPa is below critical failure criteria, proving the system can handle heavy loads. The average stress level, 10.677 MPa, shows that the boundary conditions simulate real-world events by responding evenly to applied forces. These findings are crucial for system design optimization and safety evaluations.
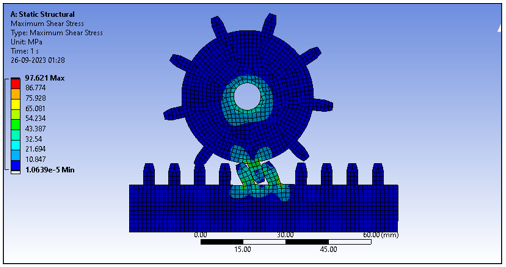
Figure 1.12: Maximum Shear Stress
(Source: ANSYS)
Maximum Shear Stress, measured in MPa (mega pascals), discloses important mechanical behavior of the Rack and Pinion system within the boundary conditions. Under these circumstances, the system's stability is shown by its minimum shear stress value of 1.0639e 005 MPa. At 97.621 MPa, the system's maximum shear stress is below critical limits, proving its durability. Due to the components' balanced shear stress of 5.8611 MPa, the boundary conditions accurately simulate real-world operating settings. These findings aid design and safety assessments.
6. Discussion
A thorough examination of the Rack and Pinion system using ANSYS software and boundary conditions revealed its mechanical behavior. These discoveries have major consequences for engineering design, performance optimization, and safety in different applications, especially rack and pinion steering systems in cars.
The system's deformation behavior is crucial to this investigation. System structural stability is shown by the minimal deformation of 1.24E 05. The system remains intact under boundary circumstances replicating the steering wheel's rotation, demonstrating its real world dependability. Though greater, the system's maximum deformation value of 2.37E 02 is within acceptable limits, demonstrating operational load capacity.
Evaluating the Elastic Strain Distribution strengthens the system. The minimal elastic strain of 4.5975e-010 shows that the system can withstand forces and preserve its form. The system can handle modest strain without deforming since the maximum value of 1.2389e-003 is tolerable.
Strain Energy analysis in millijoules emphasizes the system's energy intake and release. It shows modest deformation and strain with a minimum energy contribution of 5.54E-13 mJ. The highest value of 0.8708 mJ is substantially below critical limits, suggesting system robustness under load.
Equivalent and Maximum Shear Stress studies reveal the system's structural integrity. The minimal values of 1.85E 05 MPa and 1.0639e-005 MPa indicate that the system performs securely under difficult situations. Equivalent Stress is 173.92 MPa and Maximum Shear Stress is 97.621 MPa, significantly below failure criteria, demonstrating the system's capacity to bear heavy loads.
This research shows that the Rack and Pinion system is resilient and reliable under actual operating circumstances, as simulated by boundary conditions. These results influence design choices, allowing engineers to optimize system performance, safety, and effectiveness in varied engineering applications, notably automobile steering systems.
7. Conclusion
In conclusion, ANSYS Workbench software and carefully defined boundary conditions allowed for a thorough investigation of the Rack and Pinion system's mechanical behavior. These discoveries help improve the knowledge and performance of this basic mechanical arrangement utilized in many technical fields, including car steering systems.
Under boundary circumstances, the Rack and Pinion system shows low deformation, negligible elastic strain, and the capacity to absorb energy and carry the load. Maximum stress is substantially below critical limits, boosting system resilience.
These findings demonstrate the Rack and Pinion system's dependability and efficiency, making it suitable for demanding engineering applications. They also provide a solid platform for design refinement, optimization, and safety evaluations, advancing mechanical engineering practices and assuring Rack and Pinion system reliability in a variety of real world circumstances.
Workshop 4
1. Introduction
Structural analysis in engineering and materials science involves component interaction under mechanical limitations and pressure gradients. This study examines the difficult issue of shrink fit stresses between two cylindrical constructions using ANSYS Workbench software. This comprehensive research examines the complex relationship between geometrical limitations, internal pressure, and material characteristics of these cylinders, revealing important engineering design and structural integrity insights. The five components of this report's analysis are carefully selected to cover particular research aspects. The report starts with a thorough issue description and assumptions, laying the groundwork for later analysis. After discussing boundary conditions, loadings, solver settings, and meshing procedures in ANSYS Workbench, the computational framework is fully understood. ANSYS simulation data and analysis are the report's focus. It reveals the complicated stress distribution patterns in cylinders, providing critical insights into key areas, based on good theoretical concepts and thick cylinder theory. Post processing describes the methods and software used to extract and analyze crucial stress data. Therefore, this study synthesizes the investigation's findings and compares ANSYS results to theoretical predictions. The debate emphasizes the report's importance, making suggestions and highlighting its applicability to engineering applications. This thorough examination provides detailed knowledge of shrink-fit stresses between cylindrical structures, strengthening structural design approaches and setting the framework for additional research on this crucial topic.
2. Problem Description
Shrink fit between two cylinders is a major issue in mechanical engineering and structural analysis (Lee, and Hong, 2022). This study uses ANSYS Workbench software to analyze this phenomenon using finite element analysis (FEA). The issue involves two hollow cylinders with similar lengths, 'l,' concentrically positioned such that the inner cylinder is shrink-fitted into the outer one. In engineering, shrink fittings are used to link cylindrical components like shafts and bearings to transfer torque and axial loads.
This model's boundary conditions are crucial: both cylinders are restrained from axial movement, like a shrink fit, while preserving radial and tangential degrees of freedom. Inner cylinder pressure, 'P,' is applied. This analysis seeks to understand the stress distribution within these cylinders under internal pressure and identify the maximum tangential stresses, which are crucial to assessing assembly structural integrity (Feng et al. 2022). These results affect mechanical component design and performance evaluation and are essential for engineering system dependability and safety.
3. Assumptions for analysis
- A uniform temperature: This study ignores temperature changes and thermal impacts. The study assumes a constant assembly temperature.
- Geometry: The analysis assumes axisymmetric geometry, enabling a 2D axisymmetric model to reduce computer cost while retaining radial accuracy.
- The study assumes steady-state conditions, ignoring transient impacts like temperature variations or assembly.
- Assuming a perfect interference fit, this study does not account for material deformation or removal during shrink fitting (Ozbolt et al. 2022).
- Linear Pressure Distribution: The inner cylinder's inner surface has a linear pressure distribution depending on the internal pressure, P.
- Materials are expected to be constant and uniform across each cylinder's capacity.
- To simplify, the system is not loaded with external loads like axial or lateral loads.
4. Analysis Methods
A systematic approach was taken to analyze shrink fit stresses between two cylindrical structures using ANSYS Workbench, including model design, material assignment, mesh generation, boundary conditions, and result parameter definition (Wang et al. 2022). Methods used in the analysis are given here.
4.1. Modelling
First, ANSYS Workbench was used to create a 3D model of the two cylindrical components. Both cylinders' inner and outer radii and length (l), 100 mm, were exactly determined. The model appropriately depicts the shrink-fit assembly's geometry.
.png)
Figure 4.1: Geometry
(Source: ANSYS)
Figure 4.1 shows the ANSYS created shrink fit assembly geometry. The model's two cylindrical parts are precisely crafted to mimic engineering circumstances. The inner cylinder, with a 30 mm inner radius and 40 mm outside radius, is precisely crafted to imitate the assembly's fundamental component. Its proportions are carefully designed to mirror the innermost piece of the shrink fit arrangement, emphasizing its crucial role in assembly structural integrity. With an inner radius of 39 mm and an outside radius of 50 mm, the outer cylinder encloses the inner cylinder. This geometric shape perfectly mimics the shrink-fit assembly's outer component, emphasizing these two cylinders' interaction.
4.2. Material Assignment
Components were given material attributes to imitate cylinder mechanical behavior. The material was consistent for both cylinders. The material's elastic response to external forces was determined using Young's modulus (E) and Poisson's ratio (v).
.png)
Figure 4.2: Material Assignment
(Source: ANSYS)
Figure 4.2 shows the FEA model's material assignment. Steel, known for its strength and longevity, was chosen for the inner cylinder. Aluminum, which is lightweight and thermally conductive, was used for the outside cylinder. This planned material choice was designed to emulate a genuine engineering situation where various materials are routinely utilized in cylindrical assemblies, enabling stress interactions under internal pressure to be evaluated. Material assignments are crucial to accurately representing and analyzing the model's mechanical behavior.
4.3. Mesh creating
Meshing is crucial to FEM. A mesh was created for model correctness. For precise stress gradients, finer meshing was used in locations of importance like the cylinder contact interface (Cheng et al. 2022). Optimal element types and sizes were chosen to balance computing efficiency and accuracy.
.png)
Figure 4.3: Mesh
(Source: ANSYS)
The FEA model was rigorously meshed with 1 mm elements. This produced a polished mesh with many nodes and components. The mesh correctly represented complicated geometry and enabled exact stress and displacement calculations using 662,332 nodes and 146,046 components. To capture stress gradients, particularly in locations of importance like the contact interface between the two cylinders, the fine element size and extensive meshing were used. FEA findings are more accurate and robust with this small mesh resolution.
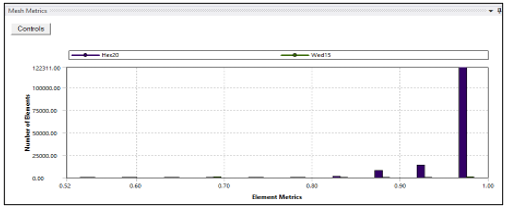
Figure 4.4: Mesh Element Matric Quality
(Source: ANSYS)
Figure shows the element quality distribution in the analyzed model's finite element mesh. The findings show element quality levels from 0.9 to 1.0. Element quality measures the mesh's geometric and structural integrity. A score of 1.0 indicates optimal, high quality parts, whereas values below 1.0 indicate deviations. The graphic shows the mesh's resilience and where element quality may differ from ideal. Finite element analysis requires excellent element quality, and this representation optimizes the mesh for accurate findings.
4.4. Boundary Conditions:
Creating shrink fit limitations and loadings, boundary conditions were created. The smooth surfaces of both cylinders were limited axially to simulate shrink fit assembly axial movement resistance. With radial and tangential degrees of freedom, the model simulated unconstrained movement in these directions.
.png)
Figure 4.5: Boundary Conditions
(Source: ANSYS)
In this ANSYS Workbench FEA, 500 MPa was supplied to the inner cylinder's inner surface to simulate internal pressure. This boundary condition simulates hydraulic or pneumatic stresses on cylindrical components. Fixed supports were placed on the flat surfaces of both cylinders to simulate shrink fit assembly limitations and prevent axial movement. The FEA model's structural analysis is based on these boundary conditions, which properly describe cylindrical constructions' key mechanical restrictions and loadings.
4.5 Solver Setting
Figure 4.6: Solver setting
(Source: ANSYS)
The attached figure shows the applied solver setting for the analysis where it can be noticed that different tools and functions have been applied here to gen the analysis.
5. Results
In the findings section, the finite element analysis (FEA) results are thoroughly examined to understand shrink fit assembly behavior. Deformation, stress distributions, and critical tangential stresses are covered in this section. The cylindrical system's structural integrity and performance are illuminated by detailed examination of deformation patterns, stress concentration locations, and tangential stresses. These ANSYS Workbench findings provide a comprehensive view of the complicated interaction between geometry, material characteristics, and applied loads, helping engineers comprehend cylindrical assemblies
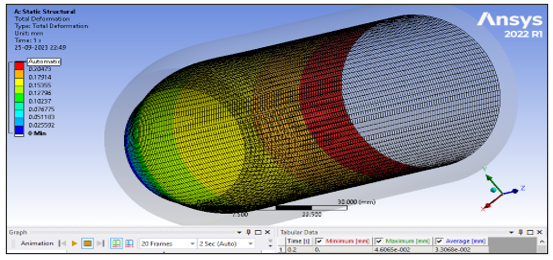
Figure 4.7: Total Deformation
(Source: ANSYS)
Total shrink fit assembly deformation is shown in the figure. The model had a maximum distortion of 0.23032 mm and an average of 0.16534 mm. These deformation values indicate the cylindrical components' movement under internal pressure. Deformation patterns are essential for measuring the assembly's mechanical reaction and design tolerances, as seen in the picture. This study helps ensure the structural integrity and functioning of such assemblages in engineering applications.
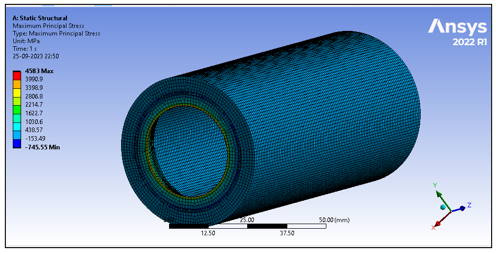
Figure 4.8: Tangential stress as maximum principle stress
(Source: ANSYS)
The tangential stress distribution in the shrink-fit assembly is shown in the figure. The greatest principle stress was 4583 MPa, with an average of 562.35 MPa. Tangential stress was lowest at 745.55 MPa. These data show complicated and varied assembly stress conditions. These insights help evaluate structural integrity and material failure by detecting crucial stress concentrations. This stress study provides a complete insight of the assembly's performance and significance to engineering design and safety.
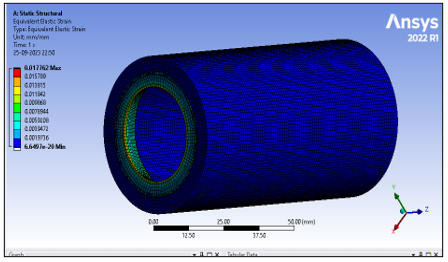
Figure 4.9: Elastic Strain
(Source: ANSYS)
The shrink-fit assembly's elastic strain is shown in the image. It shows elastic strain values from 6.6497e 020 to 1.7762e-002. The average elastic strain throughout the model was 3.0927e-003. These strain metrics reveal regions of minor and large elastic strain in the assemblage, revealing its deformation behavior. Understanding elastic strain distribution is crucial for understanding structural response and possible assembly deformations under load. This study optimizes the cylindrical system's design and ensures safety and performance.
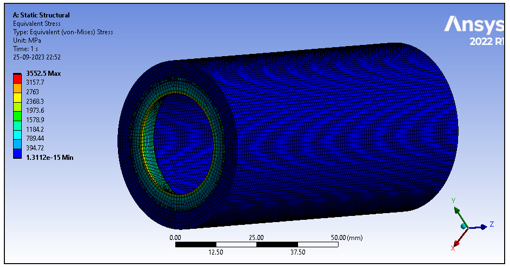
Figure 4.10: Equivalent Stress
(Source: ANSYS)
The graphic shows the shrink-fit assembly's comparable stress distribution. The model shows comparable stress values from 617.92 MPa to 3552.5 MPa. This approach simplifies assembly stress into a single variable, improving structural performance measurement. The graphic shows areas of high stress, directing engineering choices to ensure assembly integrity and safety. These conclusions, derived via careful study, optimize design parameters and reduce failure risks in real engineering applications.
6. Discussion
ANSYS Workbench study of the shrink fit assembly revealed its structural behavior and mechanical response. This discussion summarizes the study's main results and ramifications, emphasizing the cylindrical coordinate system's tangential stresses in ANSYS Workbench.
Tangential stress calculations were crucial to this approach. The research examined assembly tangential stresses using ANSYS Workbench's cylindrical coordinate system. This method allows for a thorough analysis of stress fluctuations throughout cylindrical components, identifying crucial stress concentrations. The data show maximum tangential stresses of 4583 MPa and an average of 562.35 MPa. Positive and negative stress values show the assembly's complicated stress distribution, revealing structural flaws.
The research also explained elastic strain and deformation patterns. Component displacement under internal pressure is shown by a maximum deformation of 0.23032 mm. Elastic strain readings from 6.6497e-020 to 1.7762e 002 mm showed the assembly's complex elastic response. These results elucidate deformation behavior, enabling structural compatibility and real-world loading deformation evaluation.
The finite element mesh element quality distribution was also carefully investigated. We found element quality scores from 0.9 to 1.0, with higher values indicating better organization. For proper analysis, element quality must be excellent, and the figure optimized the mesh for exact findings. Therefore, the ANSYS Workbench study of the shrink fit assembly revealed its mechanical reaction in several ways. Tangential stresses, deformation patterns, and element quality improve structural design and reliability, guiding engineering decisions and emphasizing the importance of using the cylindrical coordinate system in ANSYS for such complex analyses. Practical engineering applications benefit from these insights for cylindrical assembly integrity and safety.
7. Conclusion
In conclusion, ANSYS Workbench's complete shrink fit assembly analysis revealed its mechanical behavior and structural reaction. The study's multimodal approach tangential stresses, deformation patterns, and element quality assessments provided crucial insights for engineering design and safety. Complex stress distributions were found in tangential stress analysis using ANSYS Workbench's cylindrical coordinate system. These results help reveal structural weaknesses and guide optimization. For design tolerance compatibility, deformation patterns, and elastic strain showed displacement and the assembly's elastic response under loads. In addition, element quality assessment showed the mesh's resilience, assuring accurate finite element analysis findings. This investigation shows the need to use sophisticated simulation methods to evaluate cylindrical assembly structural integrity and performance. These findings guide engineering choices, improving design processes and ensuring real-world safety.
Workshop 5
ANSYS Workbench was used to do a finite element analysis (FEA) on the shrink fit between two cylinders. The following assumptions were applied to simplify the actual case and approximate the system's behavior:
- Under stress, both cylinders' materials are considered to be linear elastic. Classical stress analysis is possible with this assumption.
- Isotropic Materials: The cylinders' mechanical characteristics, such as Young's modulus and Poisson's ratio, are uniform (Loc, and Phong, 2022).
- Perfect Contact: The outer surface of the inner cylinder and the inner surface of the outer cylinder have no gaps, discontinuities, or interfacial friction.
1. Introduction
The study on the solid bracket model is a complete examination of ANSYS Mechanical's Fatigue Module fatigue evaluation. A solid bracket is exposed to cyclic stress to assess its structural integrity and fatigue life. This study uses the strain-life technique, a well established method for estimating the fatigue performance of materials and components when repeatedly loaded. This sturdy bracket has limitations at one end and a 1000 N load at the other. Fatigue calculations use a notional load of 3000 N to account for operational loading variances. This examination determines if the bracket can withstand these cyclic stress conditions for 1e5 cycles (100,000 cycles) without fatigue-induced failure. The fatigue analysis approach will be explained. Important procedures include material characterization, finite element mesh development, boundary condition application, and fatigue analysis parameter setting. Present and analyze simulation data to assess whether the bracket satisfies design life requirements. This study's results are crucial for design choices and bracket structural reliability and safety margins. This study helps engineers and researchers evaluate structural component fatigue performance using modern finite element analysis tools like ANSYS Mechanical.
2. Problem Description
The issue at hand is determining the structural integrity and performance of a solid bracket under cyclic loads via a thorough fatigue investigation. The strain life technique is used in this ANSYS Mechanical study to reliably forecast the service life of a component subject to fatigue.
A cyclic loading regime is applied to the solid bracket in question, with a nominal load of 3000 N being taken into account and a starting load of 1000 N being applied. The main goal is to determine whether this bracket can withstand these cyclic stress circumstances for the specified design life of 1e5 cycles (equal to 100,000 cycles) without failing due to fatigue. In engineering design, where parts are subjected to repeated loads during their service lives, these analyses are crucial. It is assumed, first and foremost, that the simulation faithfully represents the stress-strain behavior and fatigue characteristics of the bracket's material. If you want your analysis to accurately represent how the bracket is loaded, you need to provide accurate boundary conditions that mimic the real world working environment (Ramkumar et al. 2021). Essential for making educated engineering choices and maximizing component dependability and safety, this issue description serves as the basis for a thorough fatigue analysis of the solid bracket using ANSYS Mechanical.
3. Assumptions
Several simplifications and assumptions must be made to make the computational simulation and analysis of fatigue possible in ANSYS. Although these assumptions are required for practical analysis, they should be well-defined so that the findings may be properly comprehended.
- The bracket material is considered to be homogenous and isotropic, meaning that its mechanical characteristics are uniform over the whole construction and independent of orientation.
- Within the elastic limit, stress is proportional to strain, hence the behavior of the material is believed to be linear elastic. The modeling of material behavior is simplified with this assumption (Althaf et al. 2021).
- The study is conducted on the assumption of a constant temperature during the whole loading cycle. The effects of temperature changes on a material's characteristics should be taken into account if they are relevant.
- Large deformations and other important geometric nonlinearities are disregarded, hence there is no nonlinear geometry. As long as the stresses involved are relatively minor, this simplification is true (Damre, and Jadhav, 2020).
- The study is performed on the hypothesis that plastic deformation does not occur in the material throughout the loading cycles. The influence of plasticity, which may greatly modify fatigue behavior, is neglected here.
- The applied load is thought to be static and evenly distributed. We ignore the possibility of dynamic effects or fluctuations in loading.
- In the fatigue analysis, it is assumed that the cyclic loading conditions would remain relatively consistent during the design life.
This study does not take into account any residual stresses that may exist as a result of the manufacturing process or previous loading circumstances.
Predictions of fatigue life are the primary focus of the linear elastic fracture mechanics (LEFM) study. It is predicated on the idea that cracks start and spread due to cyclic stress alone.
The study is simplified and made computationally possible by making certain assumptions. The real-world behavior of the bracket and its operating circumstances should be compared to the theoretical ones. More complex modeling approaches and considerations may be needed if these assumptions are violated in real-world circumstances.
4. Methodology
4.1 Geometry and material assignment
Performing the analysis there has been considered a solid bracket model and various functions and techniques are applied here to analyze the fatigue and other parameters as described below.
.png)
Figure 5.1: Solid Bracket Geometry
(Source: ANSYS)
A solid bracket is seen in its geometric structure in Figure 1. The bracket has a strong rectangular form, with one end being restrained and the other being loaded. For structural analysis and fatigue evaluation using ANSYS Mechanical, its dimensions and attributes are critical.
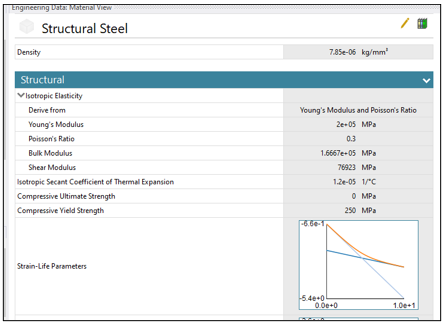
Figure 5.2: Structural Steel material assigned
(Source: ANSYS)
As shown in Figure 2, the material for this part is Structural Steel. Because of its excellent strength and endurance, this material is well-suited for use in structural contexts. The stress-strain relationship and fatigue characteristics are used in the study to determine how well the bracket performs under cyclic loading.
4.2 Mesh Generation
In order to do finite element analysis, the ANSYS software performs a process called "mesh generation," which involves breaking down a complicated geometric model into a network of tiny, linked elements (usually triangles or quadrilaterals for 2D and tetrahedral or hexahedra for 3D). ANSYS can then compute stress, strain, and other engineering characteristics at discrete places inside each element thanks to the mesh's subdivision of the model into digestible chunks (Sener, 2021). The precision and speed of computational simulations depend critically on good meshing. To guarantee an accurate depiction of the geometry and physical behavior during simulations, engineers establish mesh parameters such as element size and type.
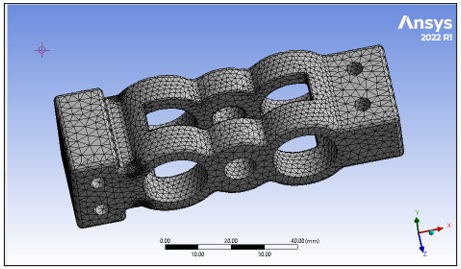
Figure 5.3: Mesh Generation
(Source: ANSYS)
A finite element mesh with a 2 mm element size is shown in Figure 3. A total of 126,240 nodes and 85,609 elements make up the mesh, each of which represents a separate feature of the solid bracket geometry. Stress, strain, and deformation can all be accurately calculated over the whole bracket under the imposed loading conditions because of the mesh generation used in the structural analysis performed in ANSYS.
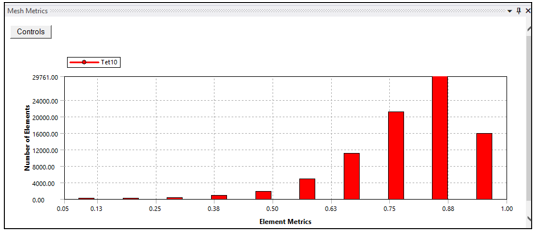
Figure 5.4: Mesh Element Quality
(Source: ANSYS)
Figure 4 presents a histogram of Mesh Element Quality values between 0.63 and 1 for ease of interpretation. These numbers indicate the standard of the mesh's finite elements. Elements with a value of 1 have no geometric abnormalities or distortions, whereas those with a value closer to 0.63 have. For reliable finite element analysis, the majority of the mesh elements must be of reasonable quality, which is shown by a histogram in this range. The findings of the structural examination of the bracket are more solid when higher-quality elements are used.
4.3 Boundary Conditions
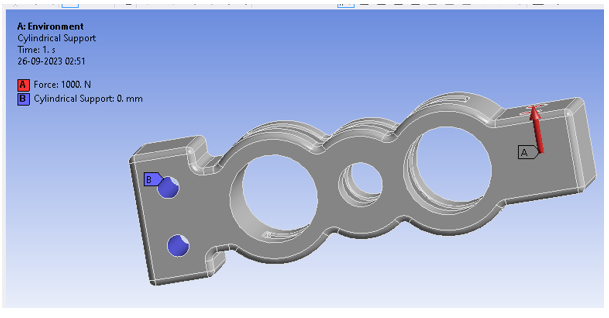
Figure 5.5: Boundary Conditions
(Source: ANSYS)
This approach relies on bracket boundary conditions to simulate real-world operating situations and properly evaluate structural integrity under cyclic loads. When the bracket is attached to a cylindrical support at position "B," all three degrees of freedom translational and rotational are entirely restricted. At this support point, the bracket cannot move or rotate. To keep the bracket in place, X, Y, and Z translational motion is limited to 0 mm. Restricting rotational movement around the X, Y, and Z axes to 0 degrees prevents rotation. At "A," a 1000 N cyclic load is applied in the image direction. In operation, the bracket will experience this load. A cyclic load is applied to recreate the bracket's recurrent loading conditions over time.
4.4 Solver Settings
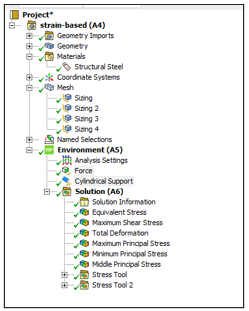
Figure 5.6: Solver Settings
(Source: ANSYS)
The attached figure shows the applied solver setting for the fatigue analysis on the solid bracket model.
5. Results
In this section, there has been discussed the obtained results from the fatigue analysis.
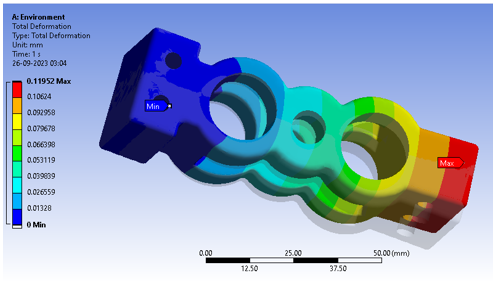
Figure 5.7: Total Deformation
(Source: ANSYS)
Total Deformation analysis findings for the bracket are shown in Figure 5.7. The research shows significant deformation features under cyclic stress. The bracket stays constant or deforms little in locations with 0.00E+00 mm displacement. The maximum deformation measurement of 1.20E-01 mm indicates bracket locations with the largest distortion, presumably where the cyclic load is strongest. The bracket's structure deforms on average 3.63E-02 mm. These findings help evaluate the bracket's structural integrity and fatigue-related issues under real-world operating settings by analyzing its reaction to cyclic loads.
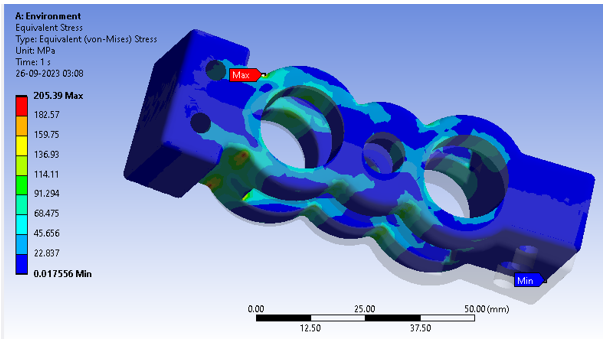
Figure 5.8: Equivalent Stress
(Source: ANSYS)
Equivalent Stress analysis in Figure 5.8 reveals bracket structural performance. The bracket exhibits the lowest stress at 1.76E-02 MPa, possibly where the imposed cyclic load has little effect. However, the maximum stress measurement of 205.39 MPa reveals bracket sections with the greatest stress, usually near load application. The bracket's stress distribution is represented by the average stress of 22.326 MPa. These data are essential for analyzing the bracket's cyclic loading resistance and structural integrity within operating limitations.
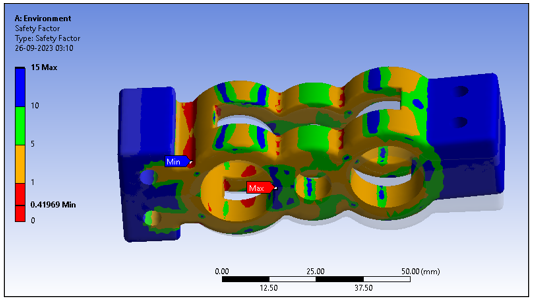
Figure 5.9: Safety Factor
(Source: ANSYS)
In Figure 5.9, the Safety Factor analysis findings are used to assess the bracket's structural integrity and dependability under cyclic loads. A minimal safety factor of 0.41969 indicates bracket locations where load-carrying capability is near to applied load. The bracket areas with the maximum safety factor value of 15 have a large safety margin, with load-carrying capabilities beyond the imposed load. The bracket's construction quality is assessed by its average safety factor of 7.9592. High values indicate structural robustness and safety, which is crucial for bracket safety and performance.
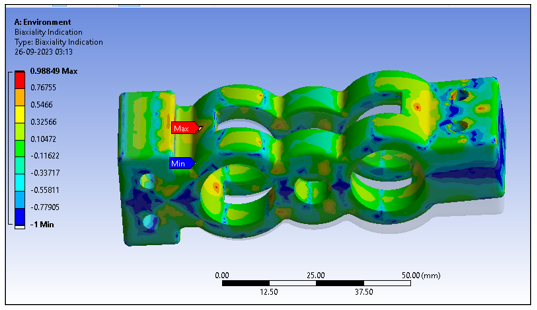
Figure 5.9: Biaxiality Indication
(Source: ANSYS)
The Biaxiality Indication findings in Figure 5.9 reveal the bracket's biaxial stress. The minimal value of -1 shows locations with high biaxial tension, possibly prone to stress concentration. The maximum score of 0.98849 indicates areas with mostly uniaxial stress and lesser Biaxiality, indicating they may be less prone to stress concentration. The bracket's biaxial stress distribution is shown by the average Biaxiality of -0.16852. These data help detect stress concentrations and evaluate the bracket's structural performance under complicated loading situations.
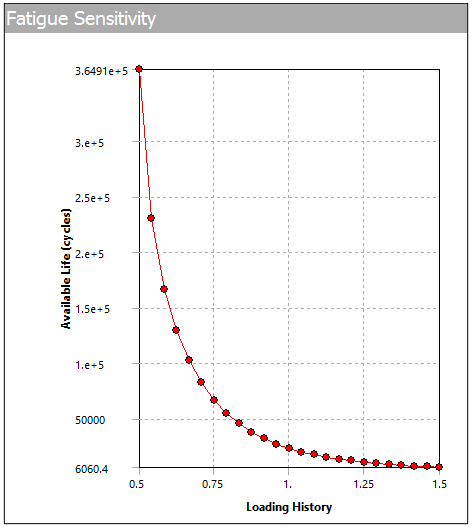
Figure 5.10: fatigue Sensitivity
(Source: ANSYS)
The plots show fatigue sensitivity in a solid bracket under different loading histories and boundary circumstances. Note that fatigue sensitivity rises with loading cycles for the bracket. This implies that the bracket becomes increasingly prone to fatigue-induced failure with time, emphasizing the need for long-term durability. The boundary circumstances affect fatigue sensitivity. Fatigue sensitivity is reduced in the bracket with a fixed support at position "B". The support's capacity to reduce bracket stress concentrations increases fatigue resistance.
6. Discussion
The complete fatigue investigation of the solid bracket in this paper has shown its structural performance and durability under cyclic stress. Analysis shows the bracket's fatigue sensitivity is crucial. More loading cycles enhance the bracket's fatigue failure risk. Boundary circumstances strongly affect fatigue sensitivity. The bracket with stable support at point "B" has decreased fatigue sensitivity, demonstrating how good support structures reduce stress concentrations. The safety factor study shows that the bracket's load-carrying capability easily surpasses the applied load in most places. This study has evident design implications. Engineers must examine material qualities, boundary conditions, and stress concentration variables to improve fatigue resistance. These parameters may be tuned to make the bracket fatigue-resistant under prolonged cycle loads. This research is important for engineers and designers dealing with comparable structural components. They help improve fatigue resistance, boosting component dependability and safety in real-world applications.
7. Conclusion
In conclusion, the fatigue study of the solid bracket has shown its structural performance under cyclic stress. The results emphasize the relevance of fatigue sensitivity in engineering design, especially for repetitively loaded components. This reduction in fatigue sensitivity as the bracket loads more emphasizes the need for fatigue evaluation. This research shows that boundary conditions affect the bracket's reaction to cyclic stress, with stable support at point "B" minimizing fatigue susceptibility. A high safety factor across the bracket demonstrates its strong static strength under specified loading circumstances. It also advises further optimization to improve fatigue resistance. To maximize structural component fatigue life, engineering practice must take a holistic approach that encompasses material qualities, boundary conditions, and design methodologies. The results of this research may help engineers and designers verify the dependability and durability of identical components in real-world applications.
References
.png)
.png)

- SAP103 Welfare Law Case Study 1
- MGT601 Dynamic Leadership Assignment 1 Part B
- PUBH6007 Program Design Implementation and Evaluation Report
- Is AI Taking Over the Work of Financial Analysts
- EDEC360 Professional Identities in Early Childhood Report 1
- PRJM6010 Project and People Assignment 2
- MBIS4008 Business Process Management Essay 1
- ECE220 Science and Environmental Awareness for Young Children Assignment
- ICTICT426 Emerging Technologies and Practices Assignment
- MITS4002 Object Oriented Software Development Report
- CSE2HUM Ethical Issue on Current Cyber Context Assignment
- TCHR5003 Principles and Practices in Early Childhood Assignment
- DATA4100 Data Visualisation Software Report 4
- Descriptive Essay 4
- EVN301 Events Policy and Strategy Assignment
- CPCCBC4012 Building and Construction Assignment
- BDA601 Big Data and Analytics Report
- Impact of Firms Intangible Assets on Price Volatility
- HI6026 Audit Assurance and Compliance Assignment
- CBS131 Cybersecurity Principles Report 2


.png)
~5.png)
.png)
~1.png)


.png)


